Money & Cycles Weekly Bulletin
Disappointing Chinese money data
mai 13, 2024 par Simon Ward
Chinese money trends yet to reflect rates decline. Weak April money / credit numbers push back recovery hopes but six-month narrow money momentum remains above its December low, with recent lower yields suggesting improvement (see charts).
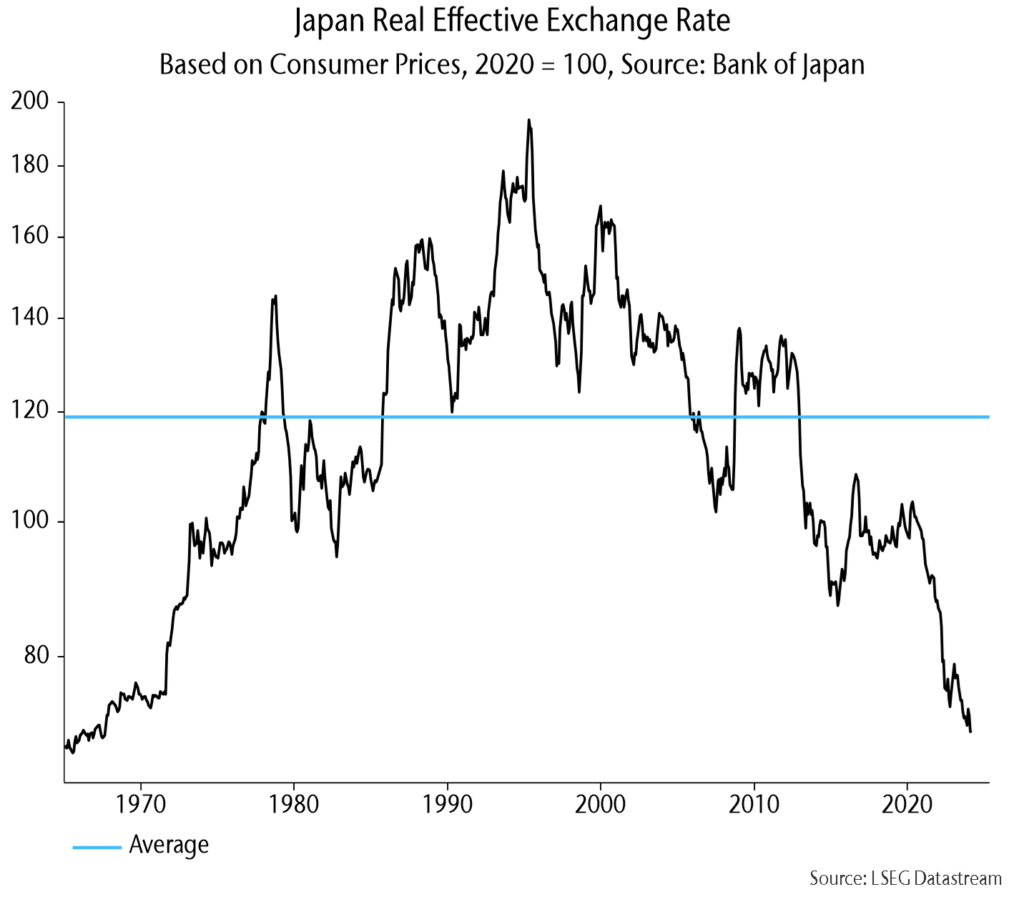
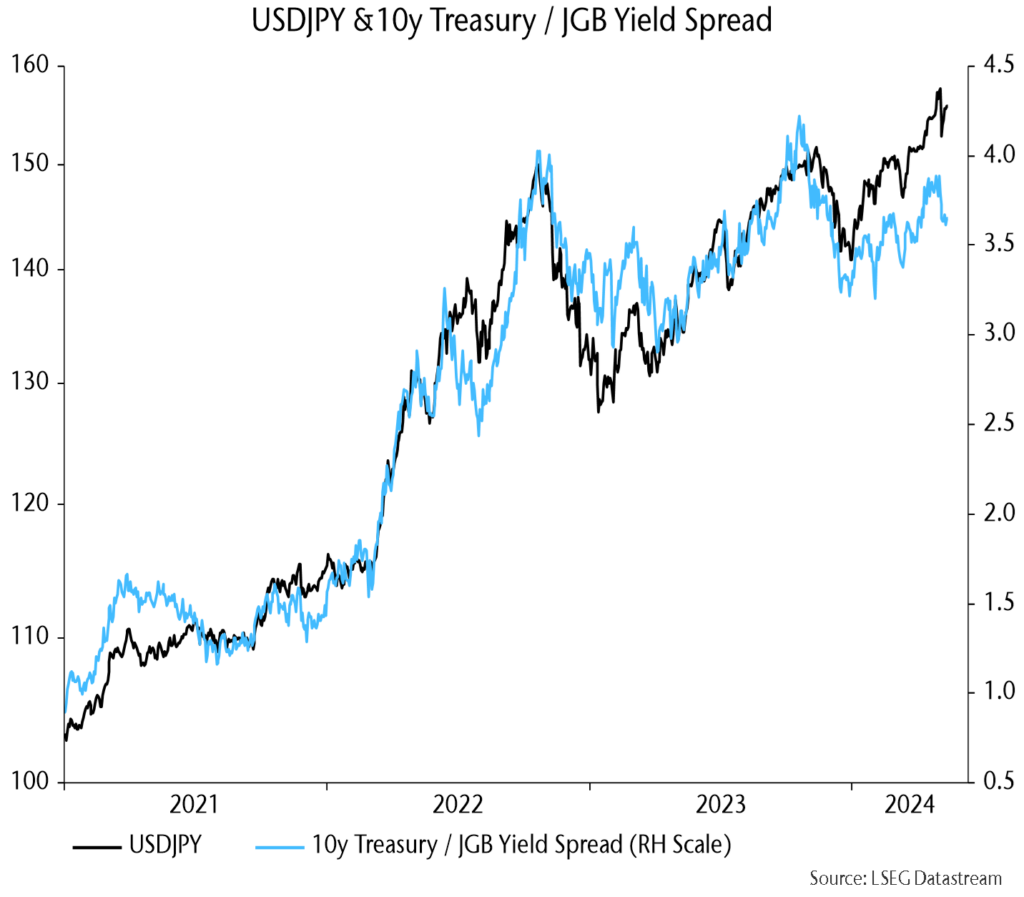
Is the yen bottoming? The real effective rate is the lowest since the 1960s, Japan / US trade numbers have moved in the yen’s favour and the recent USDJPY high wasn’t confirmed by US / Japanese yield spreads (see charts).
UK nominal GDP slowdown supporting early rate cut. Commentary focused on a stronger-than-expected 0.6% real GDP rebound in Q1 but nominal weakness is the bigger story, with the GDP deflator rising by just 1.5% annualised in the latest two quarters (see charts).
Chinese money trends yet to reflect rates decline
Chinese April money numbers were a significant negative surprise, with six-month narrow money momentum slipping again and broad momentum at a new low:
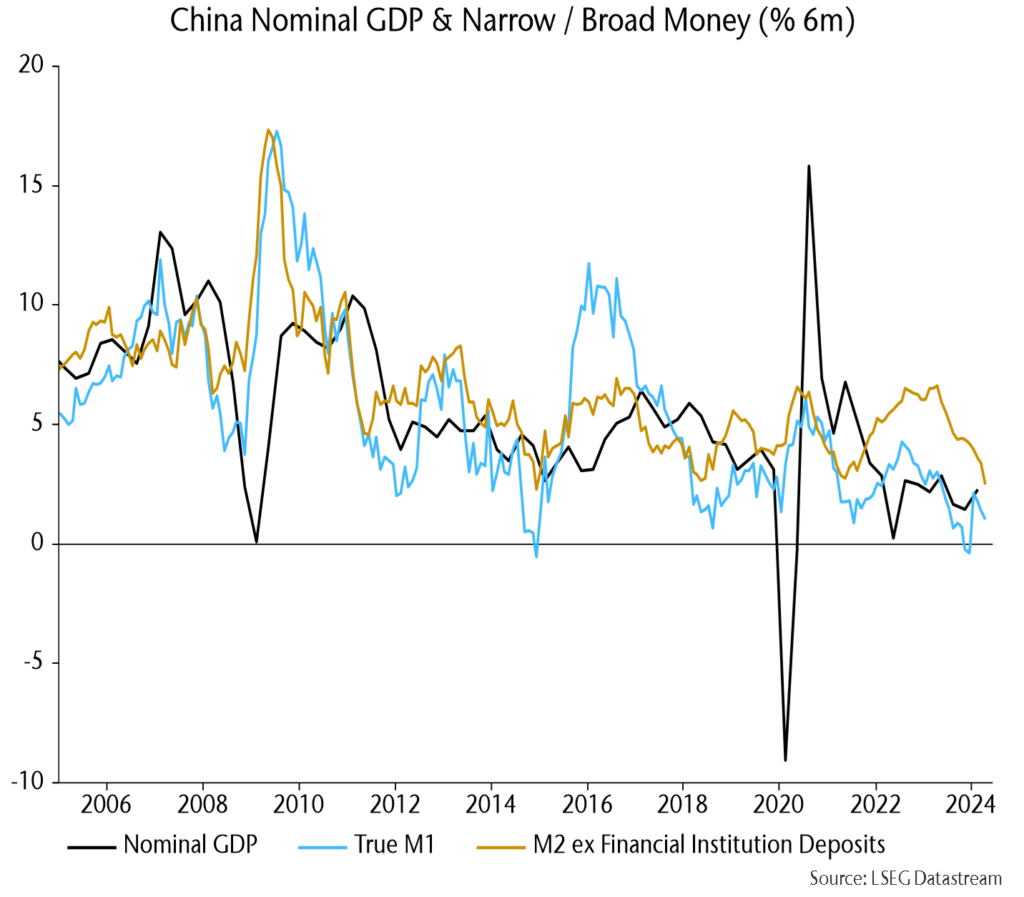
The optimistic view is that monetary weakness reflects rising rates in late 2023 and a recent bigger fall will lift momentum through the rest of the year:

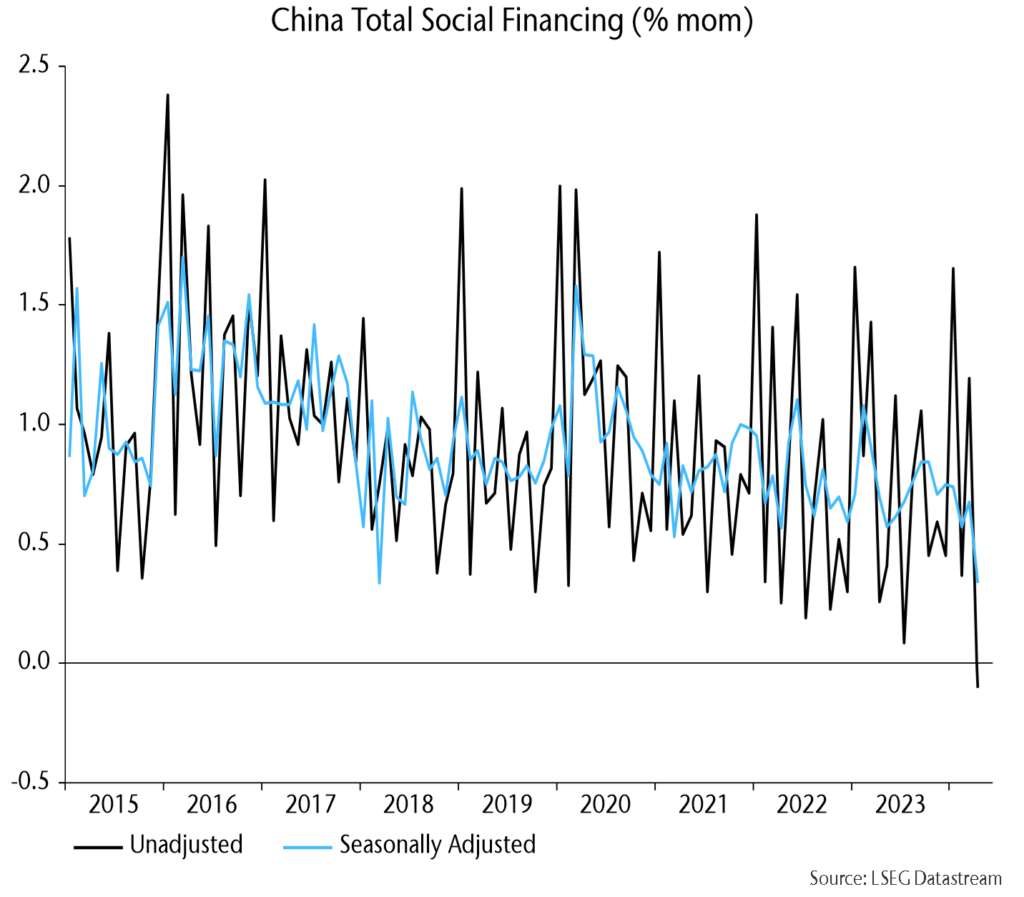
A rare monthly contraction in total social financing partly reflected seasonals and temporarily weak government bond issuance:
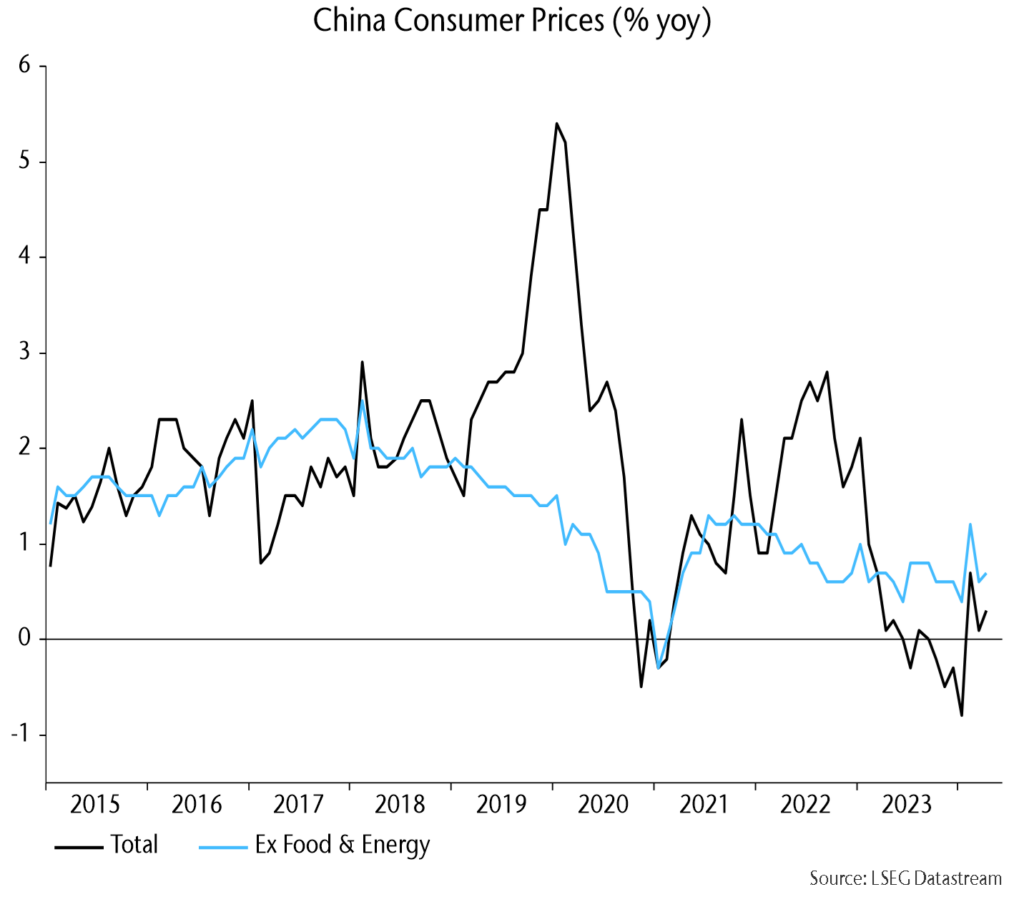
Core CPI inflation is weak but moving sideways, while food deflation is likely to ease, based on wholesale agricultural prices:
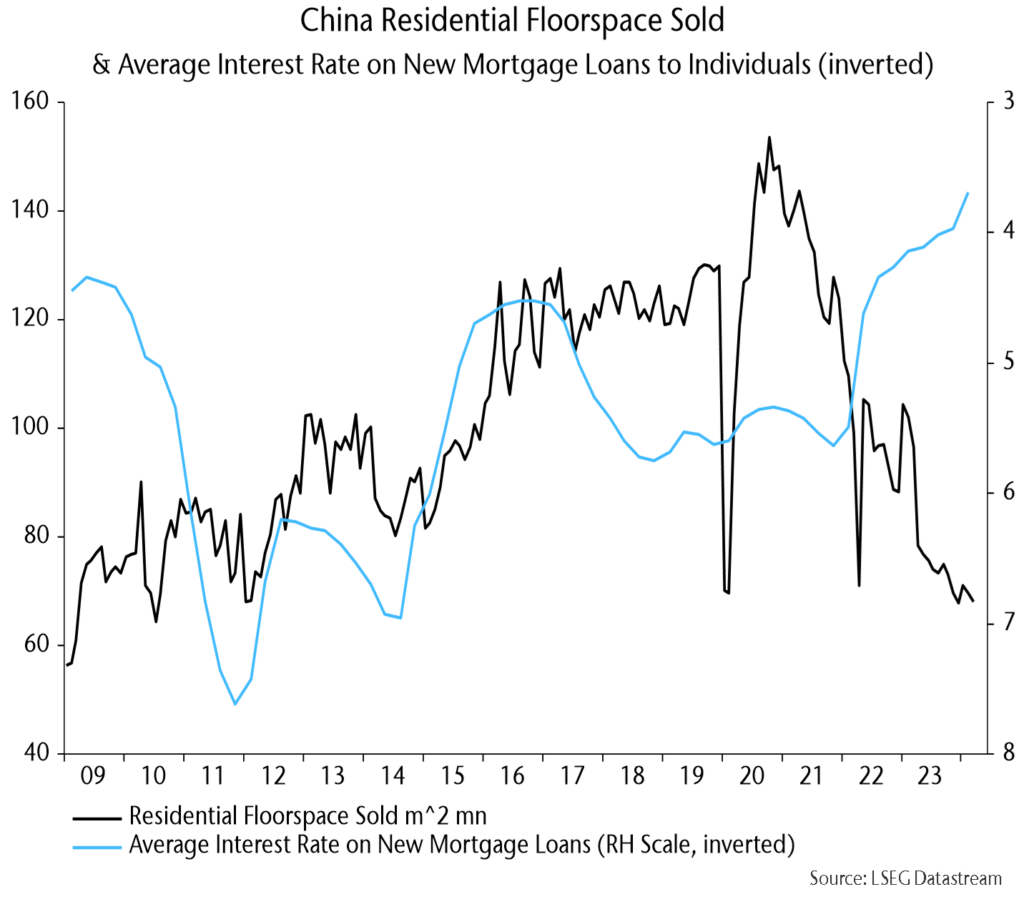
The average interest rate on new mortgages hit a new low in Q1 – will home sales finally start to respond?:
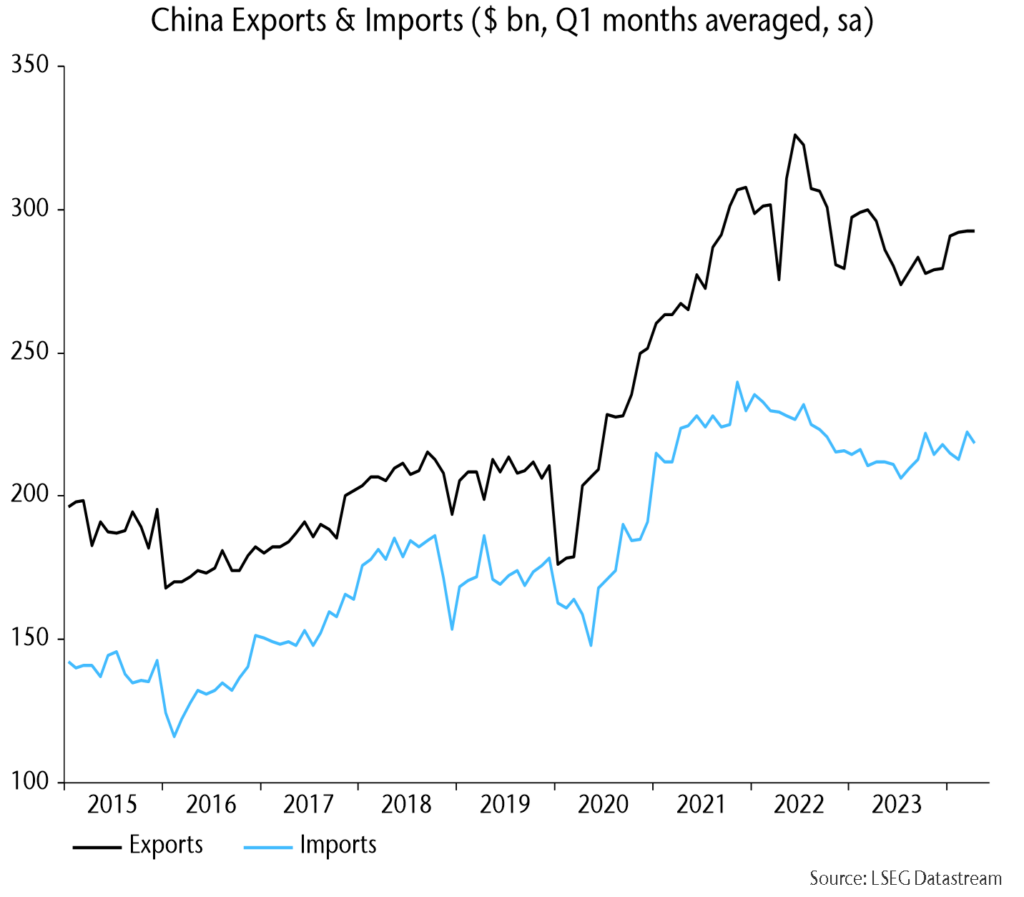
Exports consolidated in April after a Q1 rise:
Is the yen bottoming?
Will recent Japanese f/x intervention mark a turning point for the yen? The real effective rate is the lowest since the late 1960s:
Dollar-yen has been tracking the US / Japanese yield spread but the two have started to diverge:
Major dollar-yen turning points historically were usually preceded by a reversal in the US / Japan relative trade position, which peaked around a year ago:
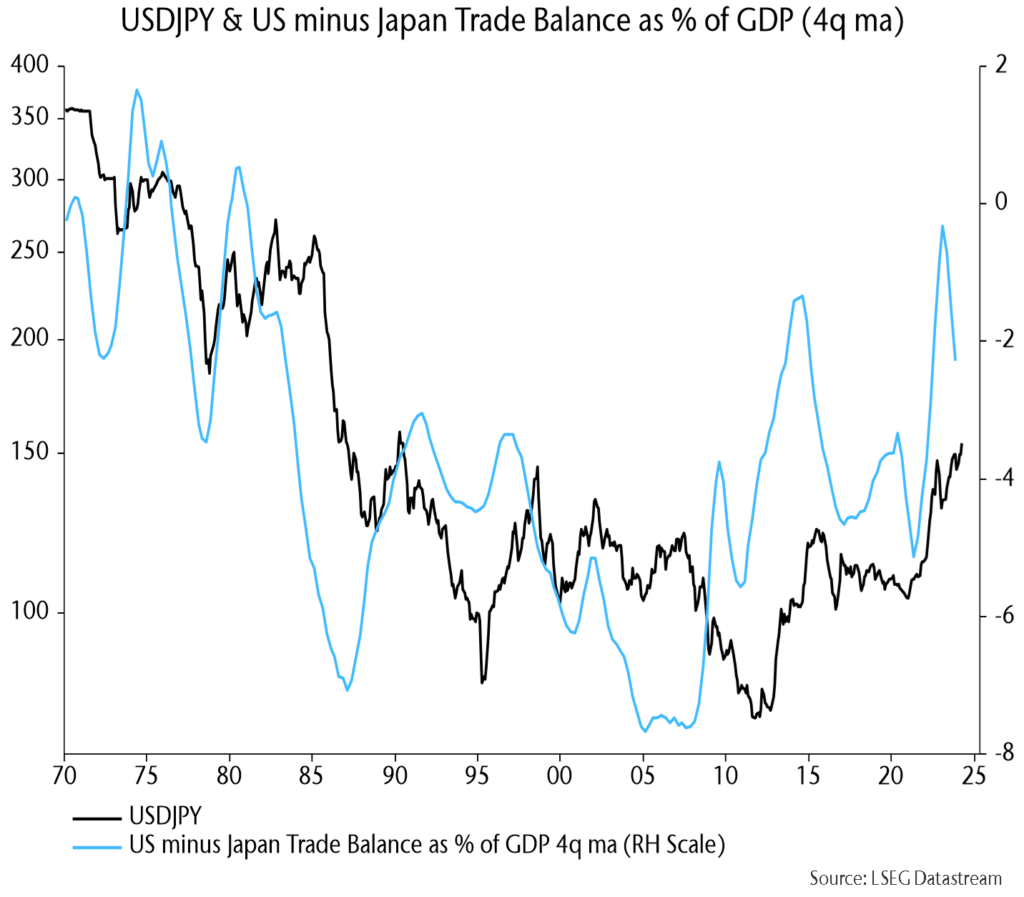
US and Japanese trade deficits have been falling but Japan’s has declined by more, reflecting lower energy prices.
Speculators have been (correctly) long the dollar for three years and two months, close to a record three years and three months over 2012-16 before a major reversal:

UK nominal GDP slowdown supporting early rate cut
UK real GDP grew by 0.6% in Q1 after a 0.3% Q4 fall but the bigger story is recent nominal deceleration – the GDP deflator rose by just 1.5% annualised in Q4 / Q1 combined:

Nominal GDP weakness reflects monetary contraction in 2022-23; money momentum has recovered but remains lower than in the 2010s:

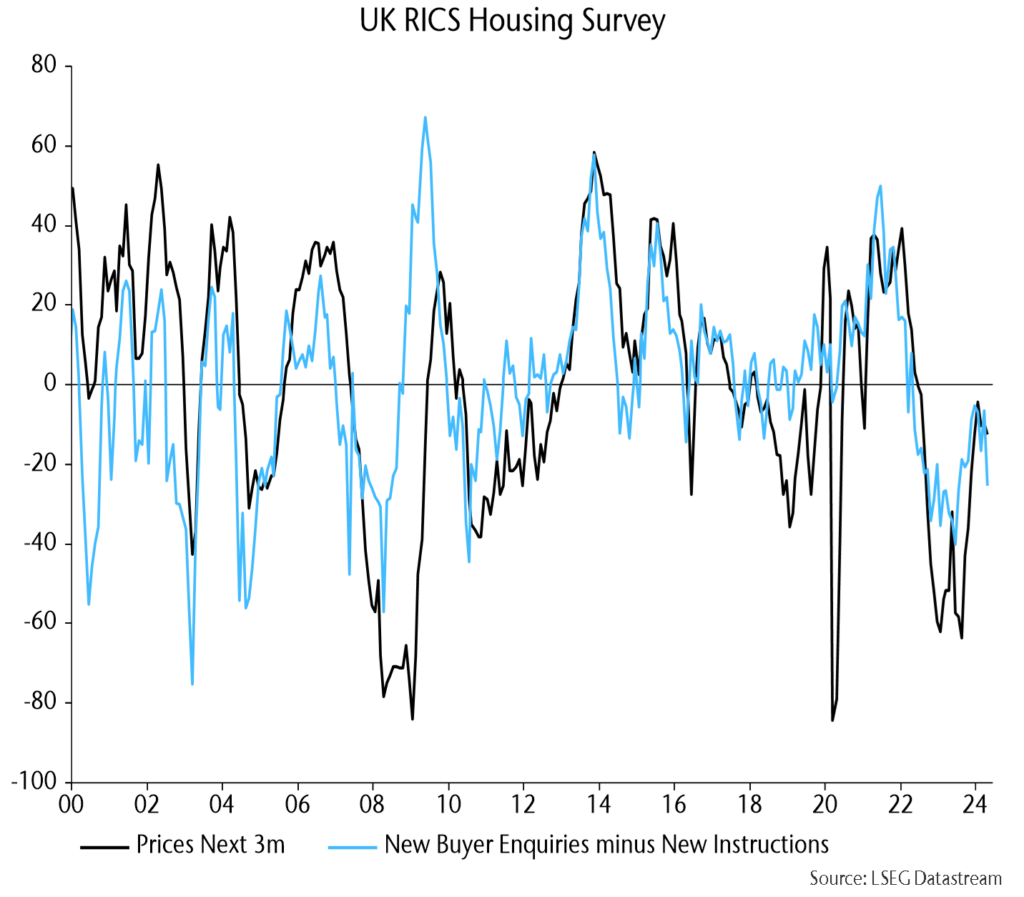
The MPC’s delay in cutting rates has stalled a housing market recovery, which threatens to go into reverse:
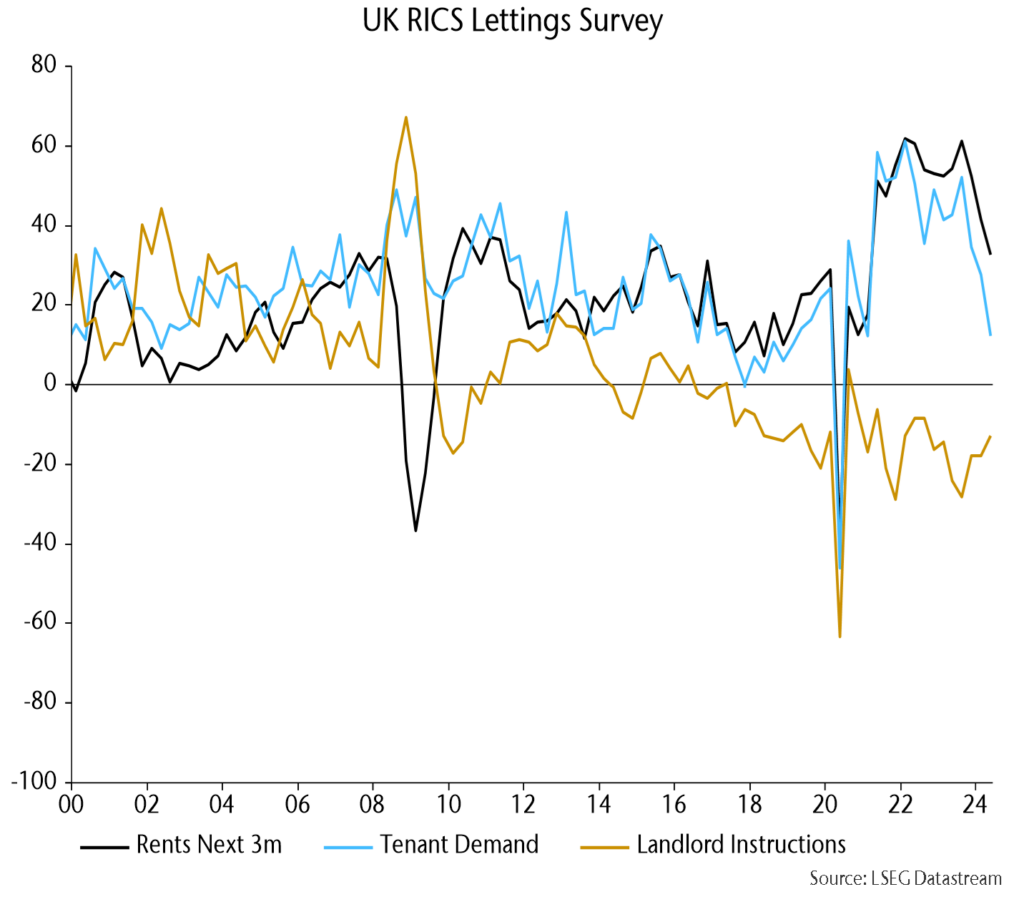
The rental market is also cooling fast – another reason for expecting more significant services disinflation ahead:
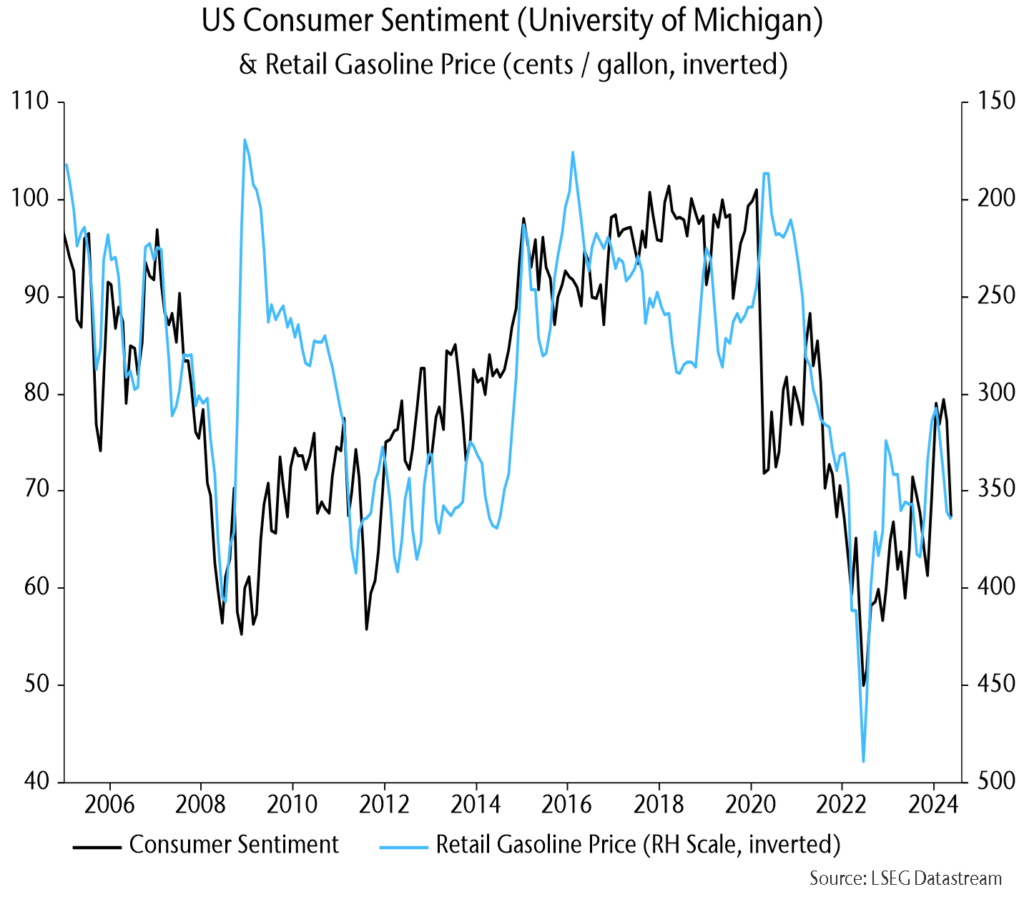
US Michigan consumer sentiment mirrored an earlier sharp drop in Conference Board confidence, with higher gasoline prices likely a key driver:
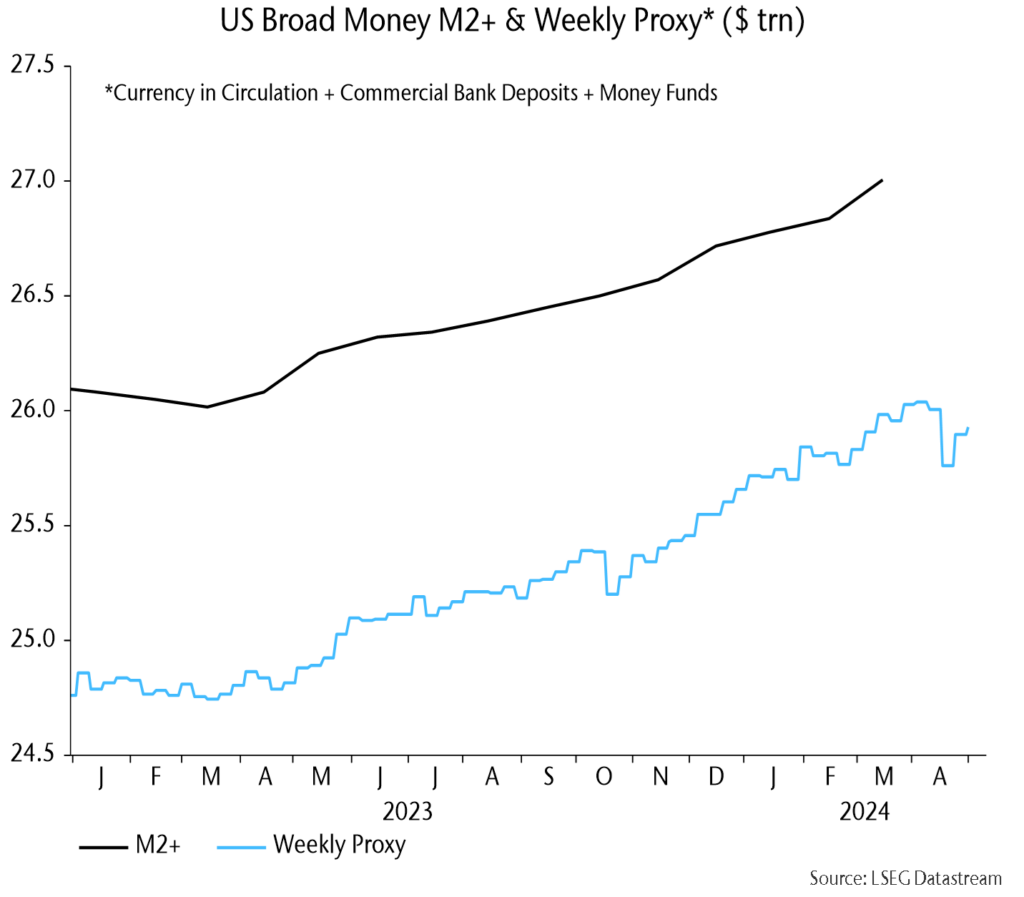
Weekly numbers remain consistent with a monetary stall since end-Q1:
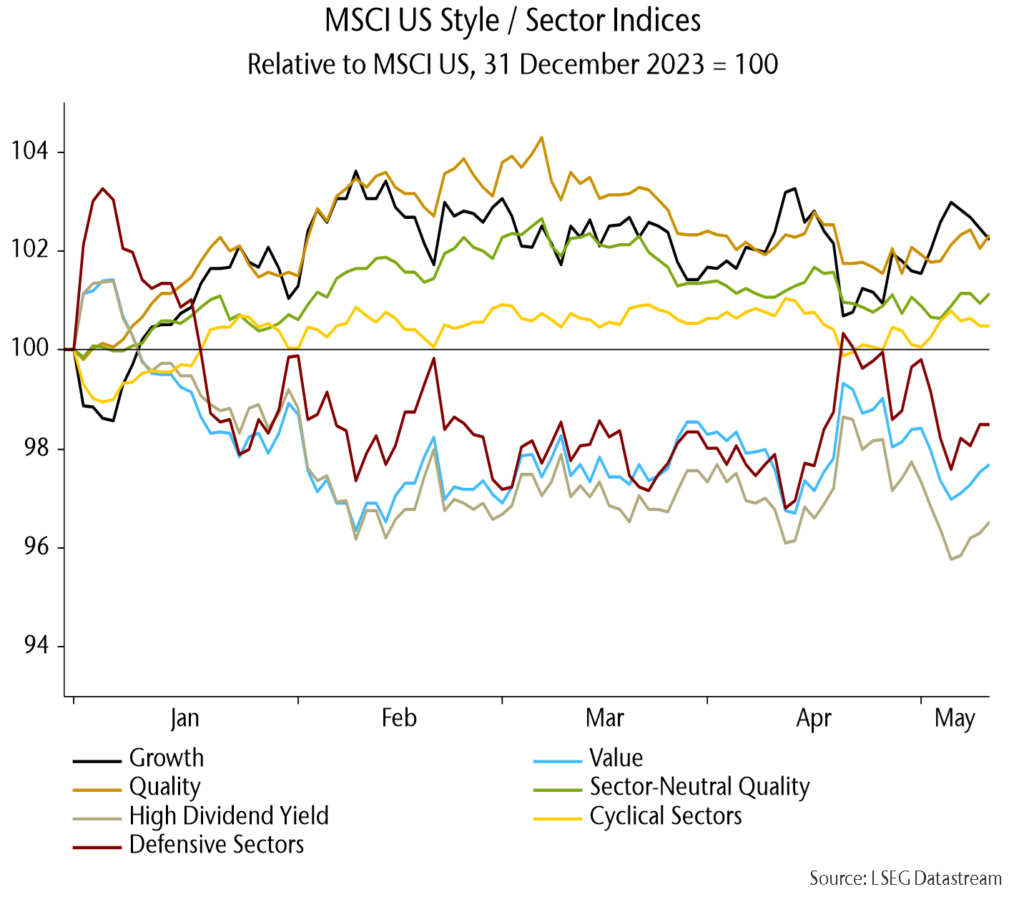
US growth / quality are still well ahead of value / yield YTD:
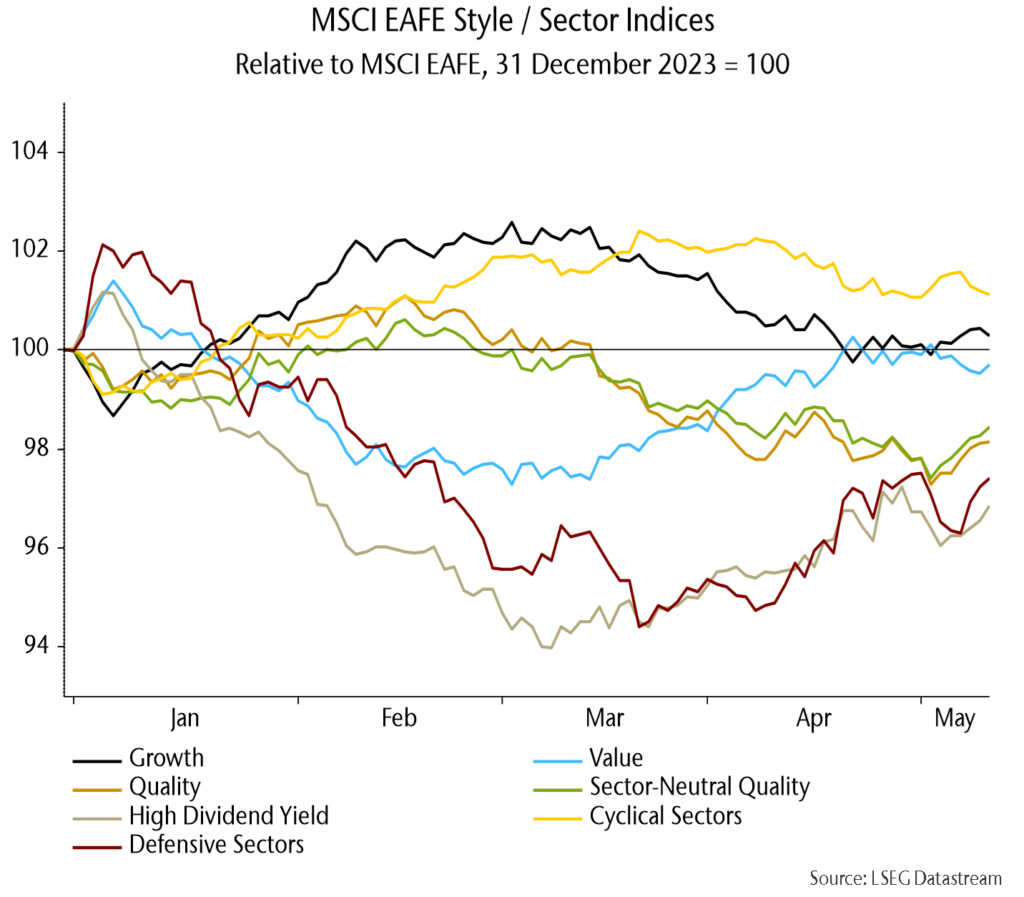
The growth / value differential is much smaller in EAFE with quality still lagging, though better – along with defensive sectors – last week:
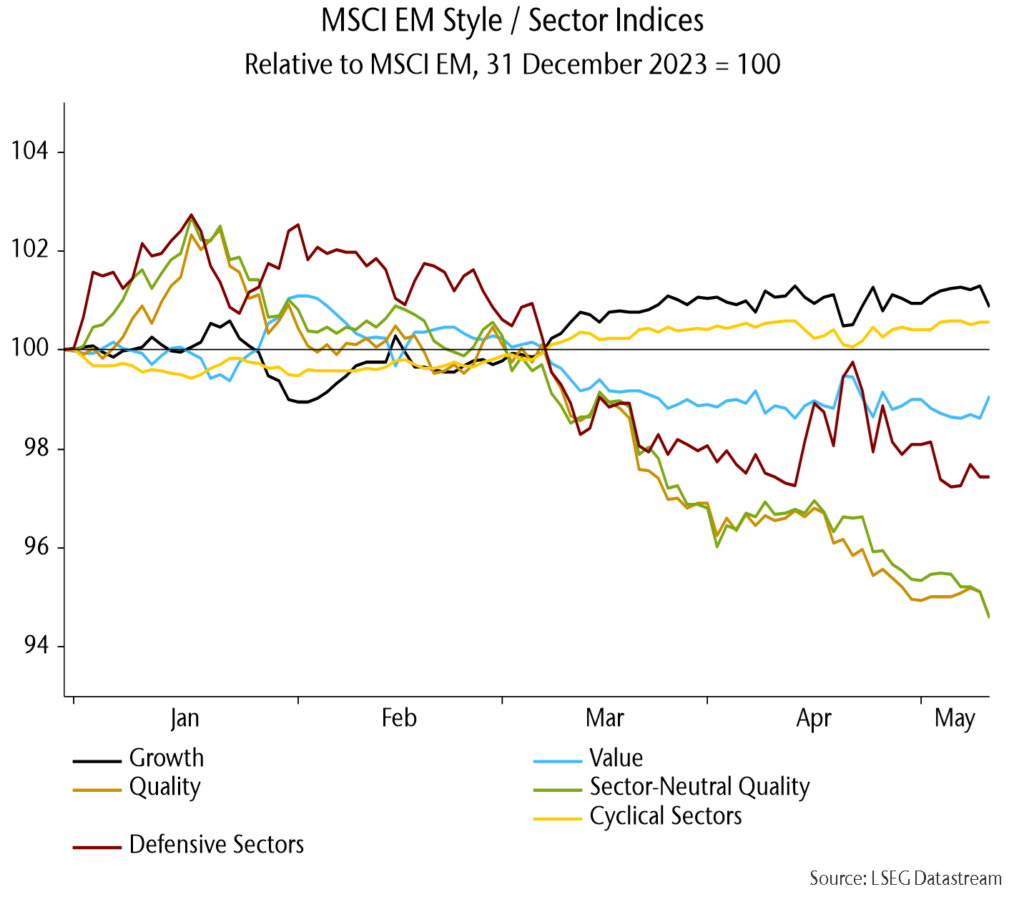
The EM quality index is also behind and weakened further, as Chinese quality continued to lag the rally there: