Money & Cycles Weekly Bulletin
Better March monetary data but more improvement needed
avril 29, 2024 par Simon Ward
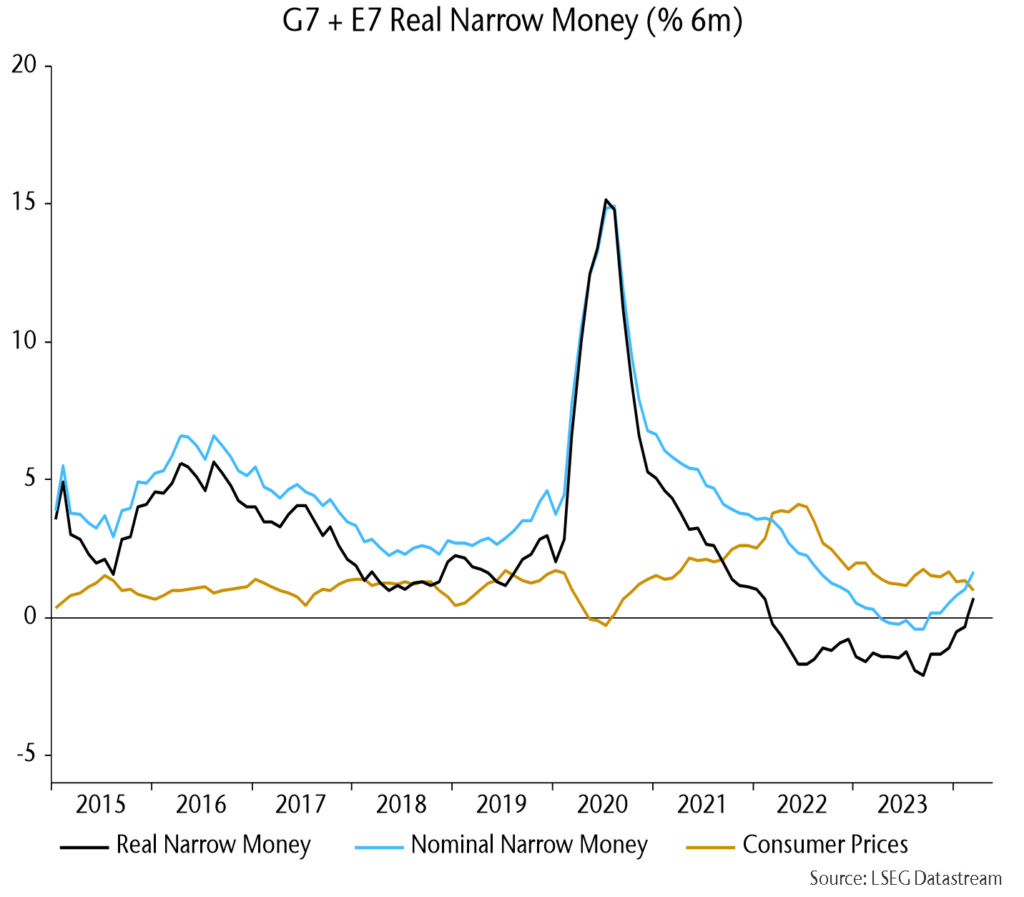
Monetary recovery still fragile. Global six-month real narrow money momentum returned to positive territory in March but remains weak and could reverse lower as headline CPI momentum recovers and US Treasury financing operations turn contractionary (see charts).
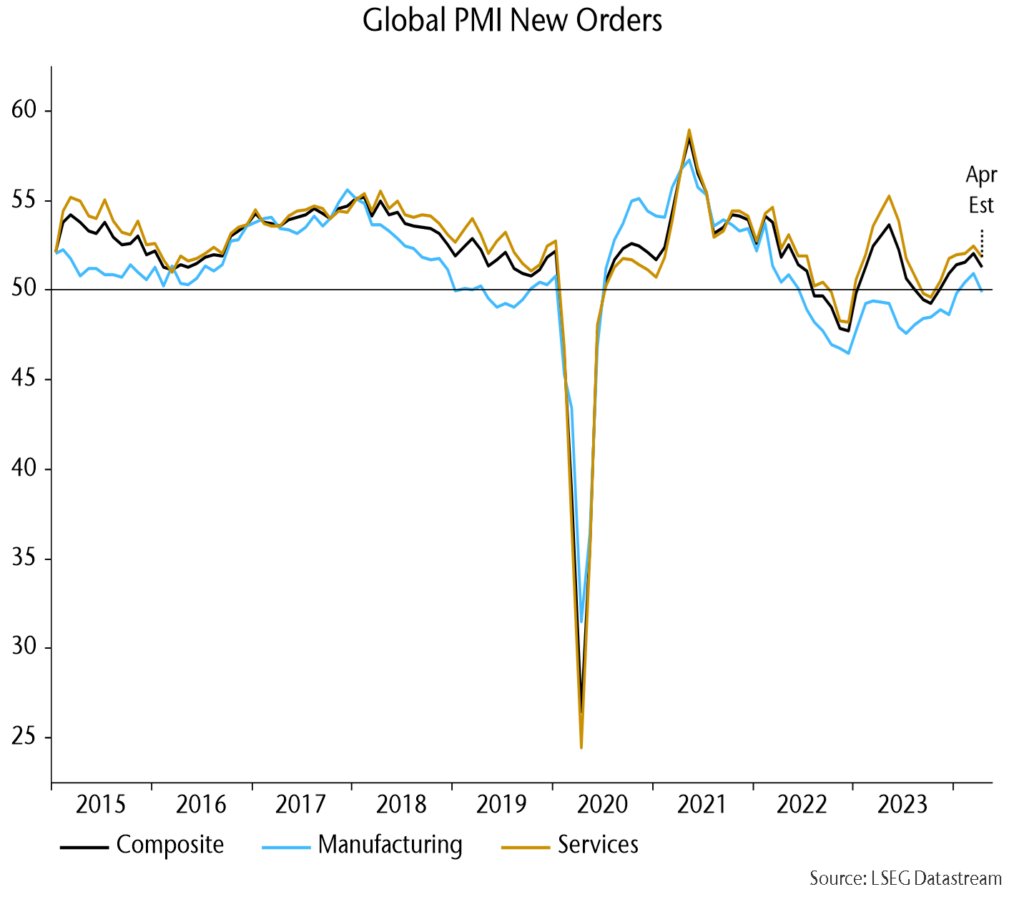
Flash PMIs question upswing hopes. DM results suggest that global new orders fell back this month, possibly marking the start of a downswing into H2, consistent with earlier monetary weakness (see charts).
FOMC Q4 inflation projection still feasible despite Q1 disappointment. Core PCE prices would have to rise by 0.17% per month for annual inflation to fall to 2.6% in Q4; the H2 2023 average was 0.16% and lagged money trends suggest a disinflationary impulse in H2 2024 (see charts).
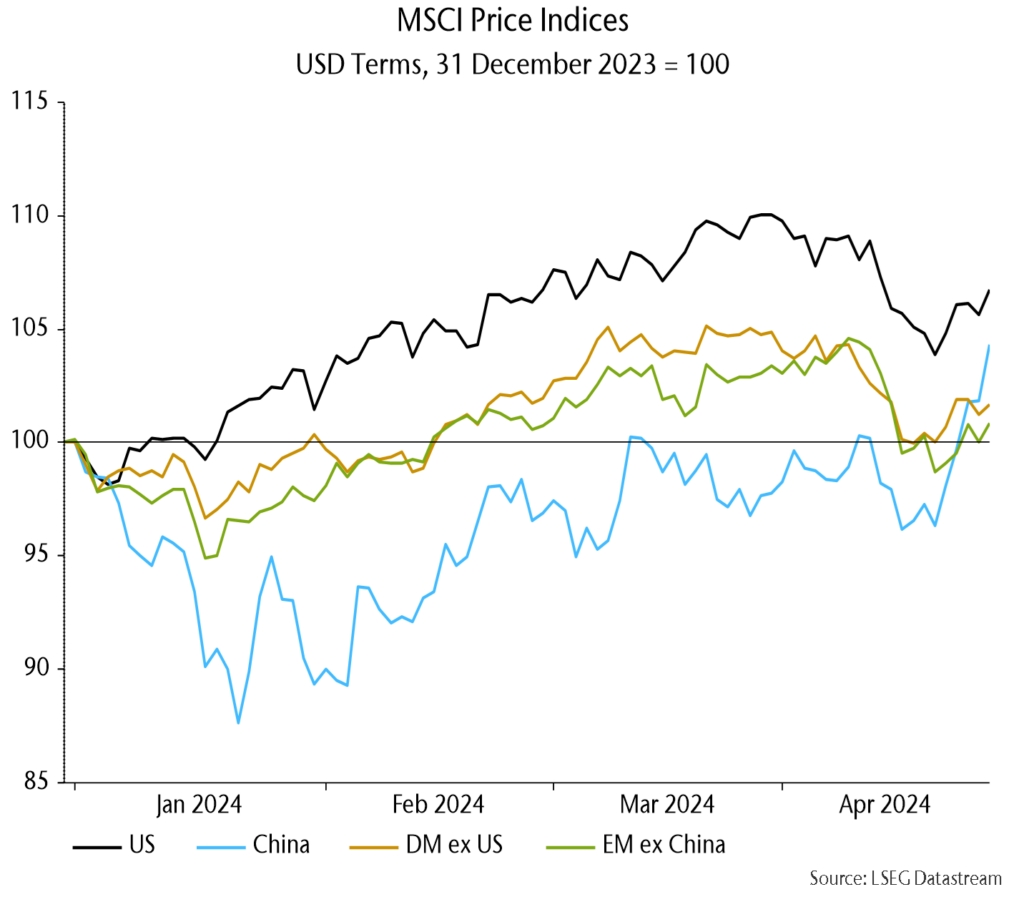
In other news … Tokyo CPI inflation surprised favourably, Swedish unemployment jumped higher and MSCI China overtook DM ex. US and EM ex. China indices YTD (see charts).
Monetary recovery still fragile
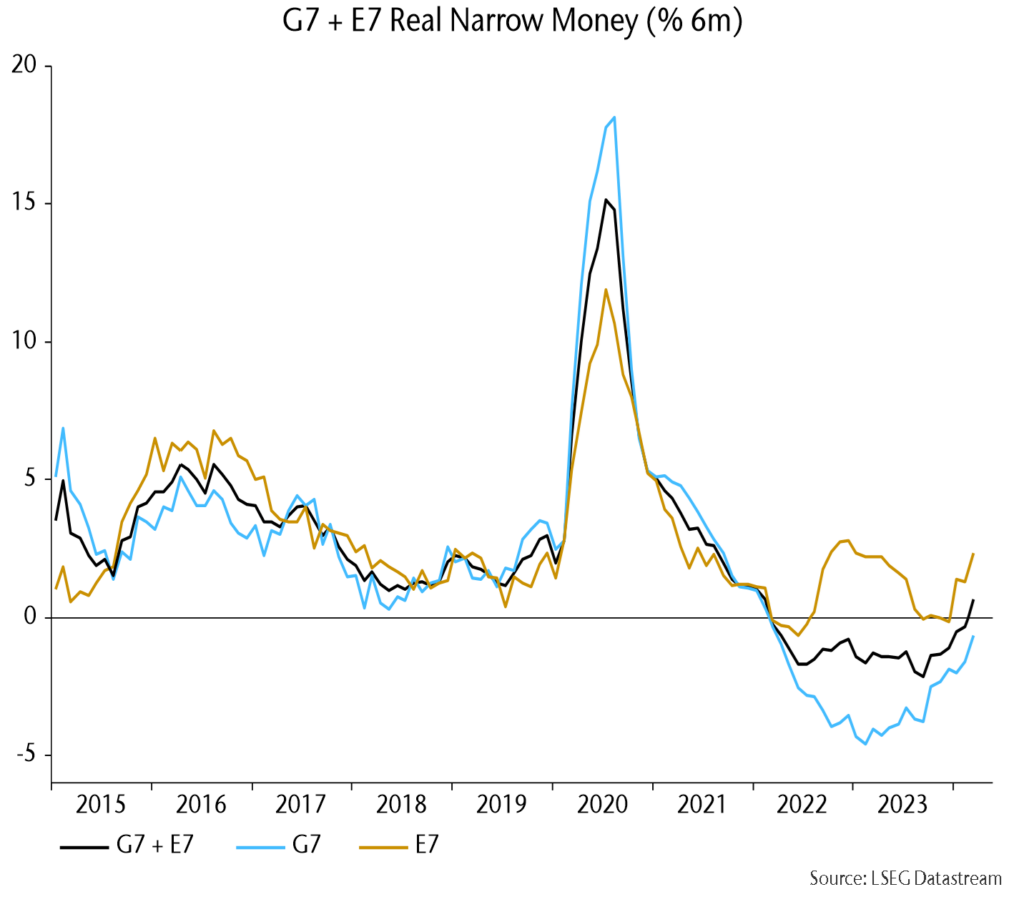
G7 plus E7 six-month real narrow money momentum turned positive in March, reflecting both stronger nominal growth and a further fall in CPI momentum:
Reasons for downplaying this development, at least for now: 1) momentum remains weak and a decline into September 2023 is still feeding through to activity:
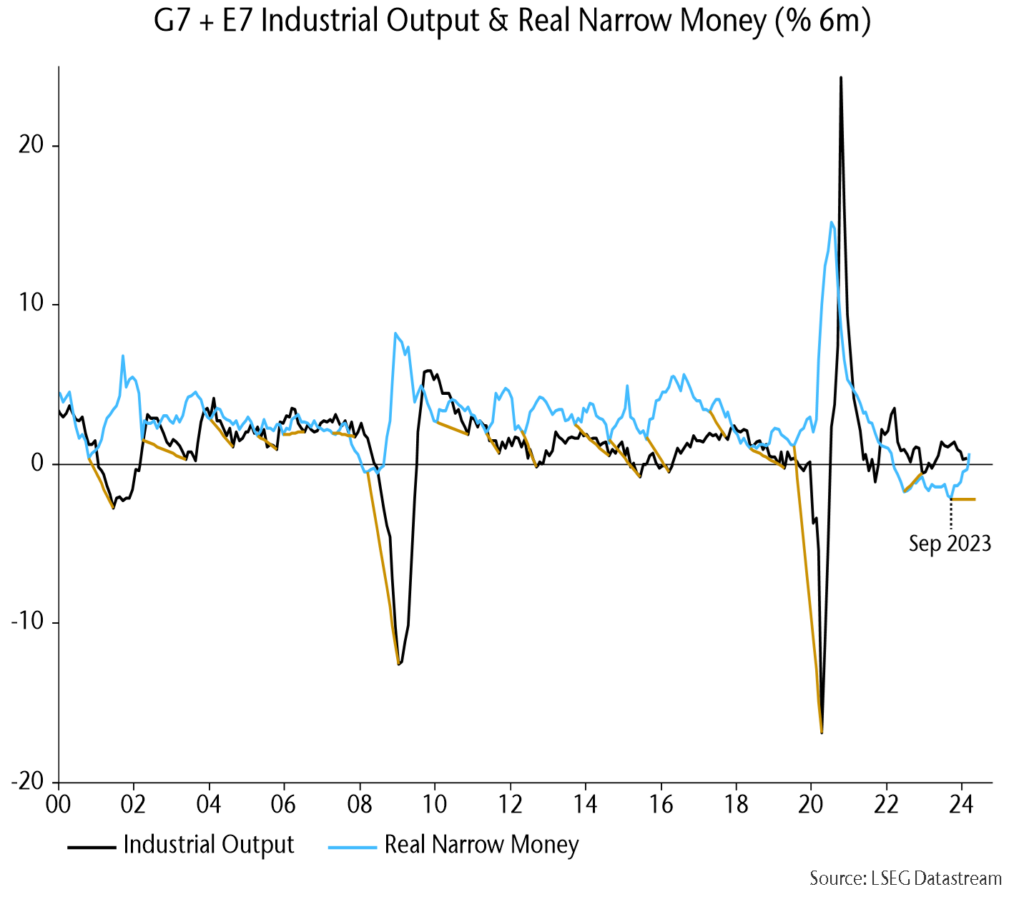
Note: the real money / industrial output momentum gap may have turned positive in March (output number not yet available).
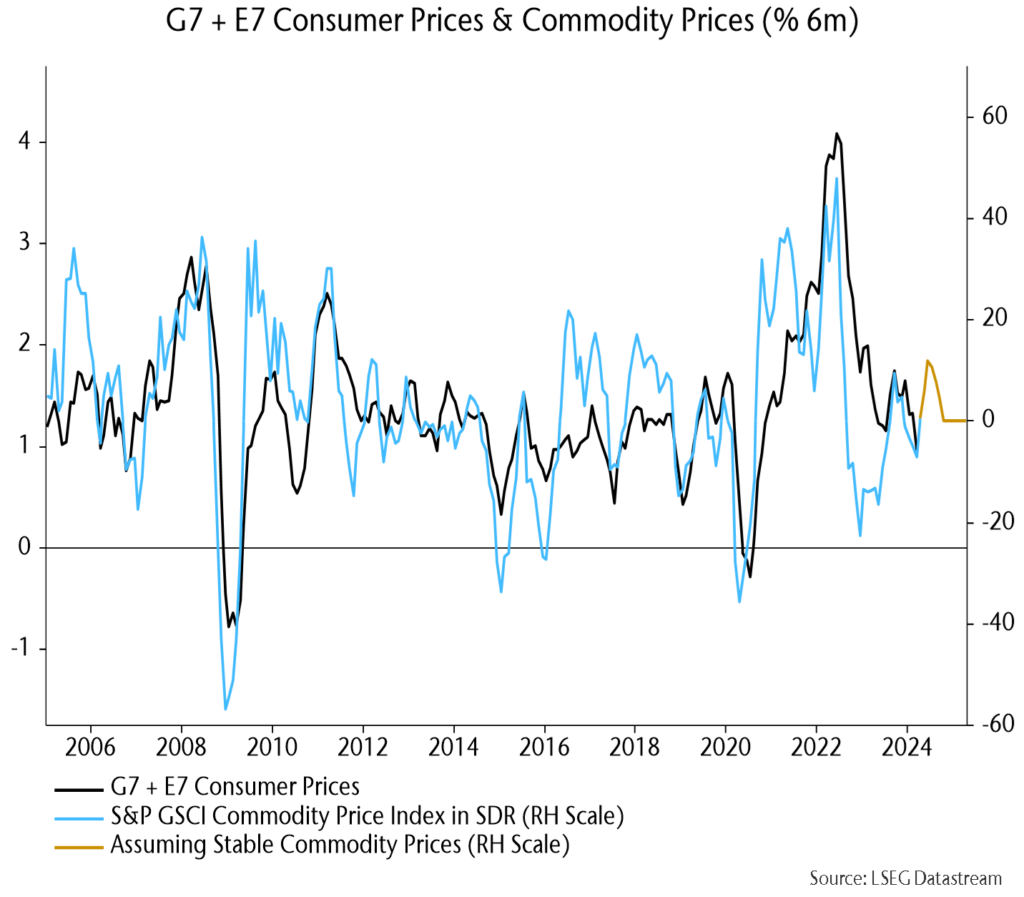
2) Recent firmer commodity prices suggest a rebound in six-month CPI momentum (increased drag on real money):
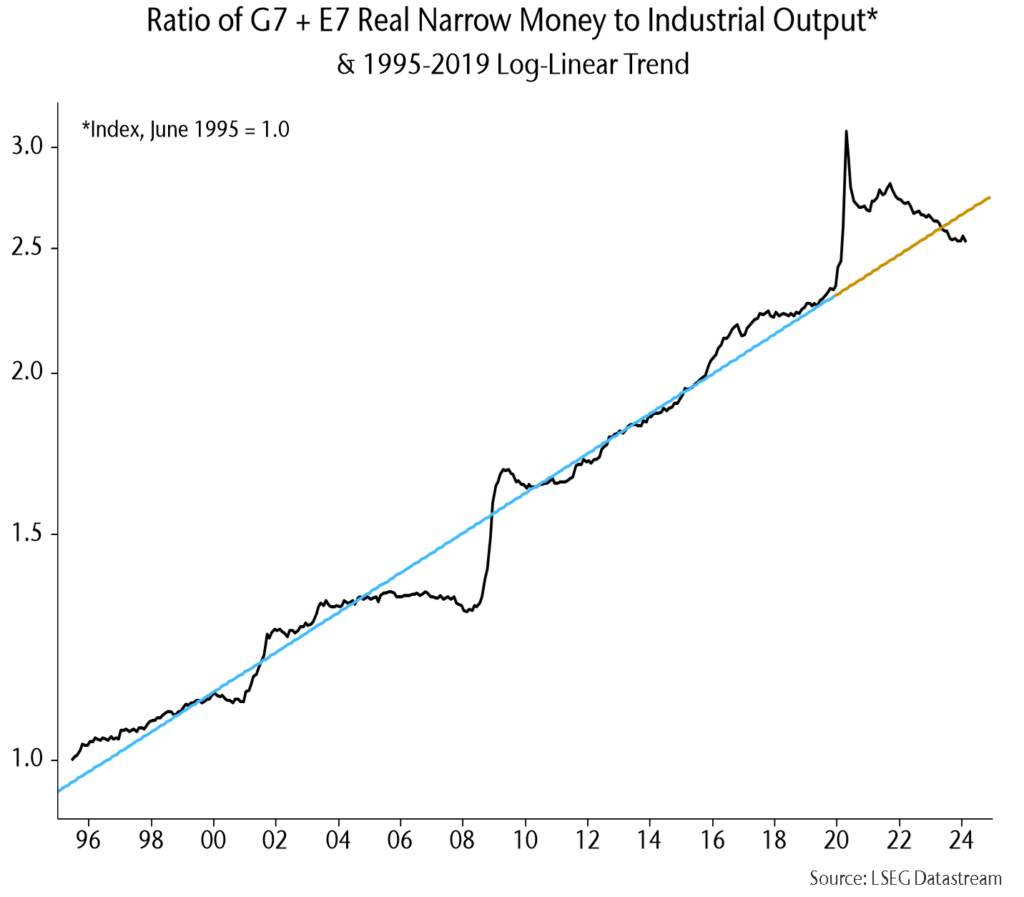
3) The ratio of real money to output remains below trend – is a return to trend necessary before a recovery in momentum starts to have positive effects?
4) Positive global momentum reflects solid E7 growth, with G7 momentum still negative:
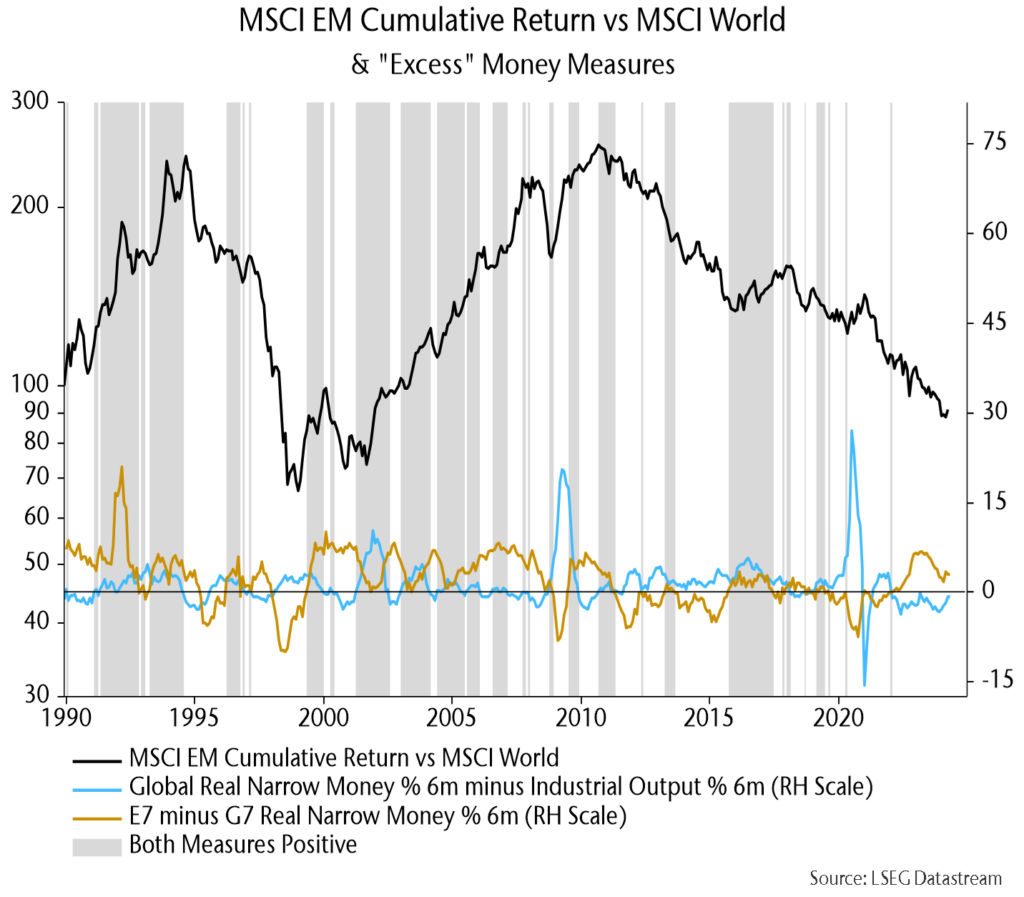
E7 vs. G7 strength coupled with a positive global real money / output momentum gap (unconfirmed) has been favourable for relative EM performance historically:
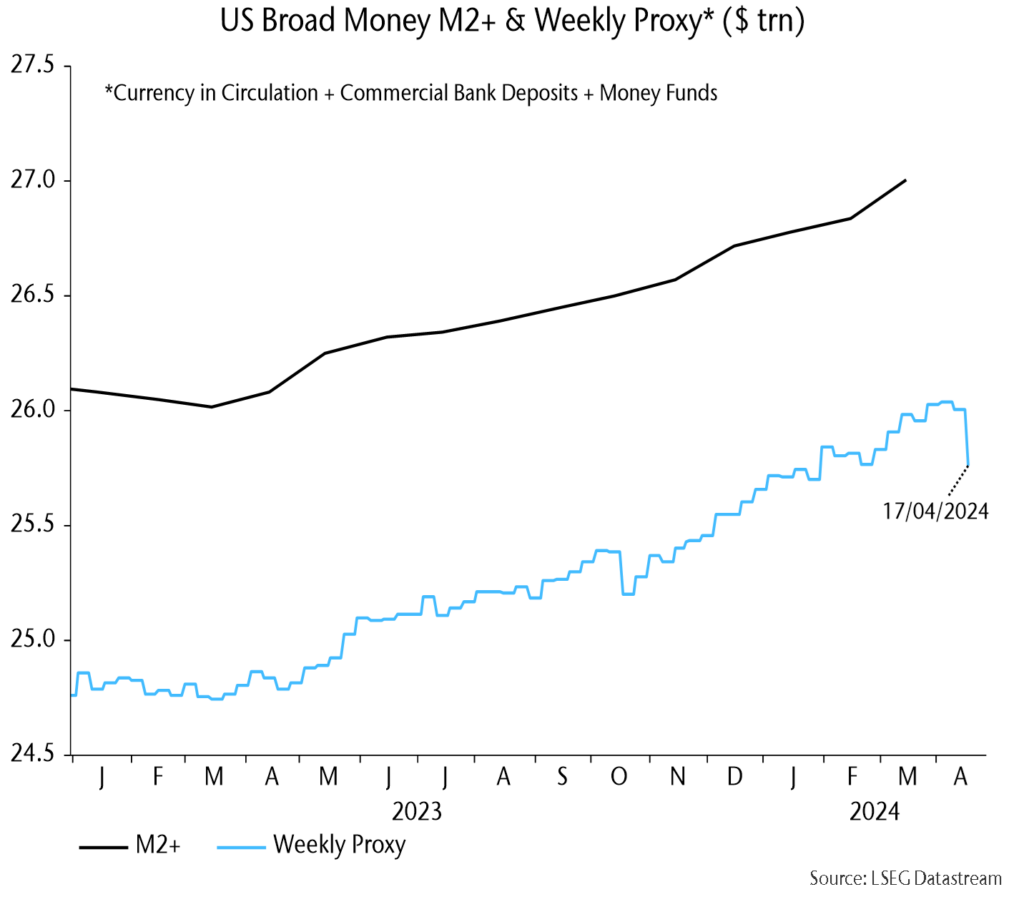
5) US Treasury financing operations (high bill issuance) again offset the monetary impact of Fed QT in Q1 but Q2 plans suggest a contractionary influence:
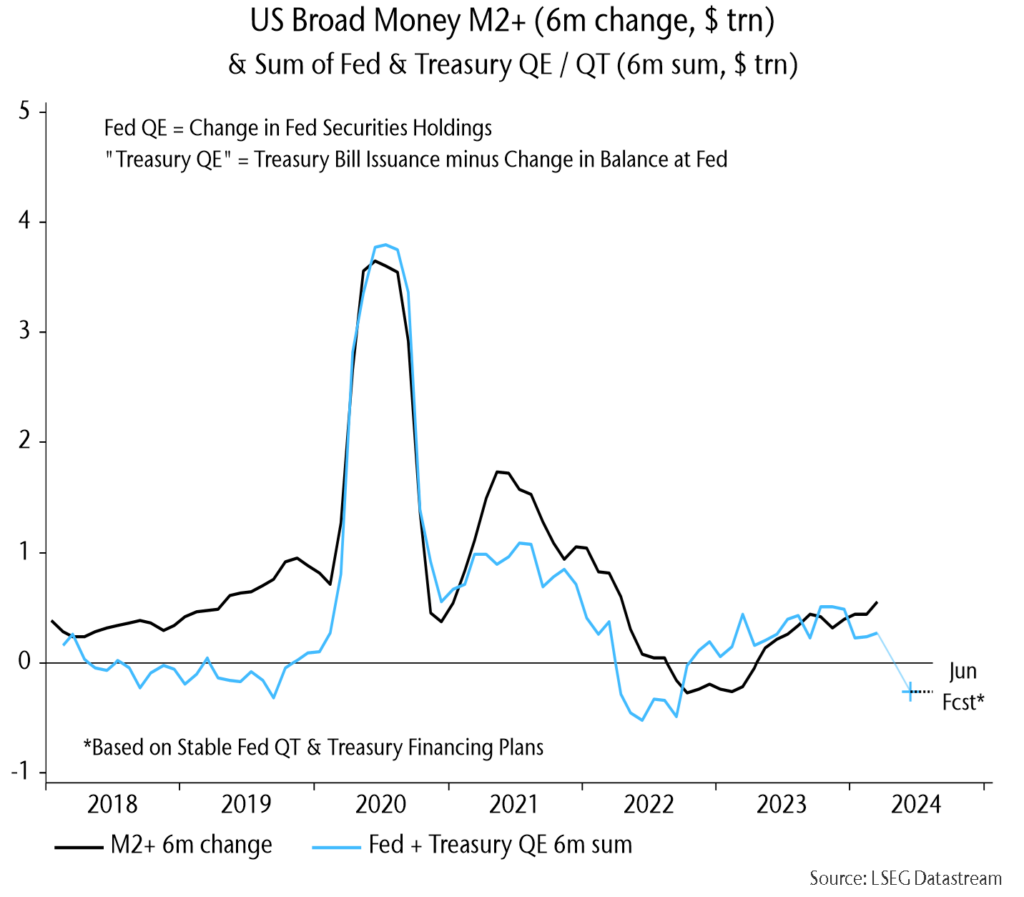
Weekly commercial bank / money fund data suggest a reversal – watch:
Flash PMIs question upswing hopes
DM April flash PMIs were mixed but overall disappointing, suggesting that global orders indices fell (data this week):
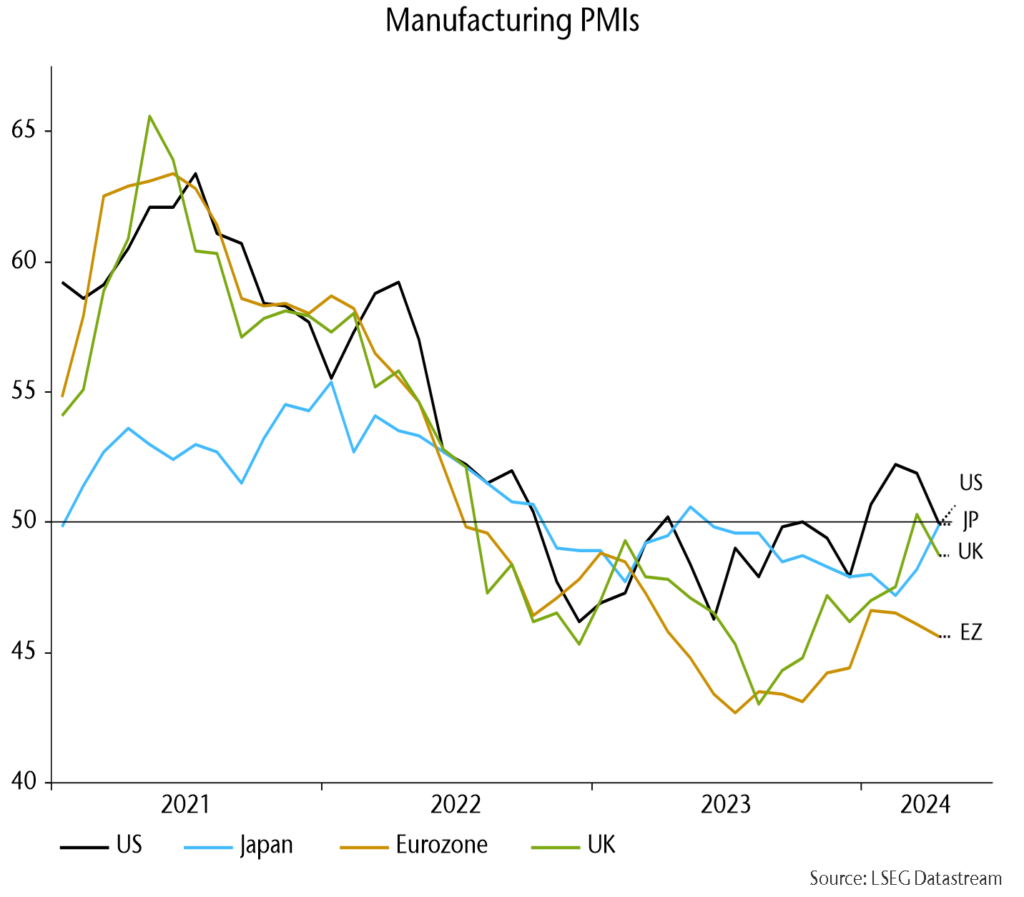
US / European manufacturing PMIs weakened; Japan bucked the trend but often lags:
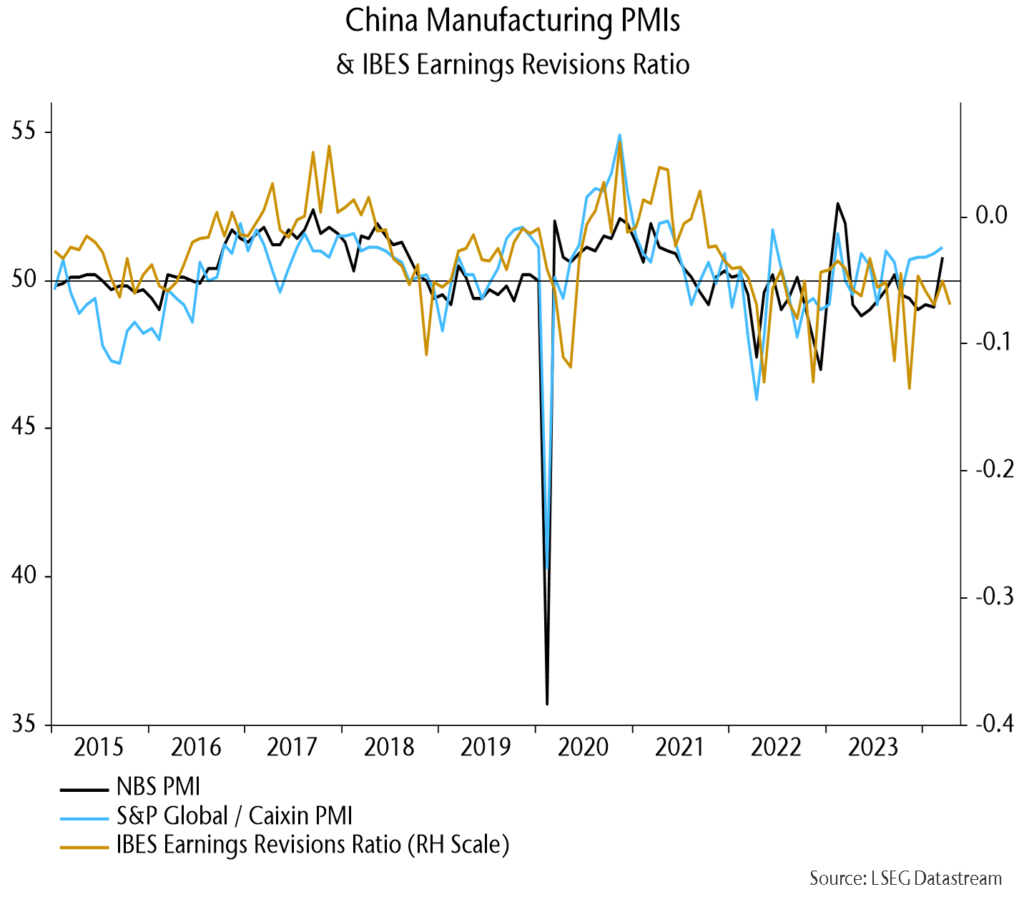
Chinese April earnings revisions were downbeat, suggesting a reversal in recent better manufacturing PMIs:
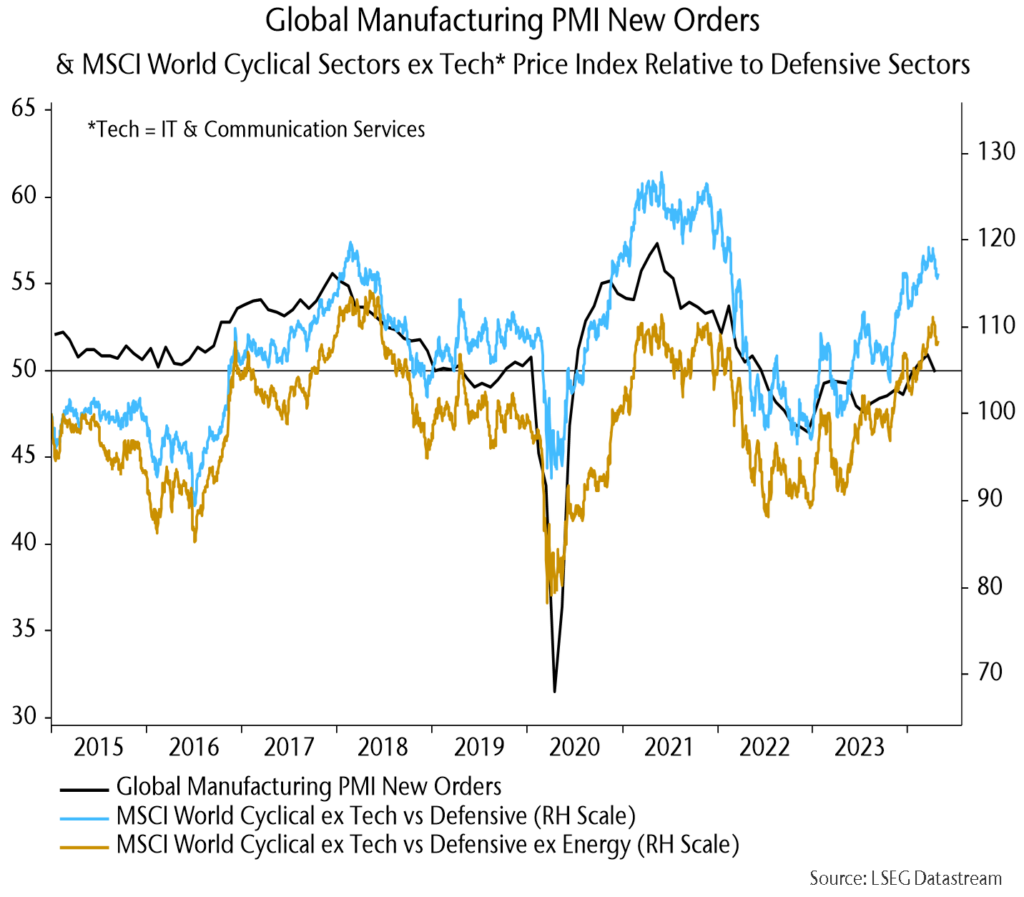
A manufacturing PMI downswing into H2 would be consistent with earlier monetary weakness – are cyclical sectors starting to sniff out this scenario?
FOMC Q4 inflation projection still feasible despite Q1 disappointment
US core PCE prices would need to rise by 0.17% per month over the rest of 2024 for annual inflation to fall to 2.6% in Q4, the March FOMC median projection:
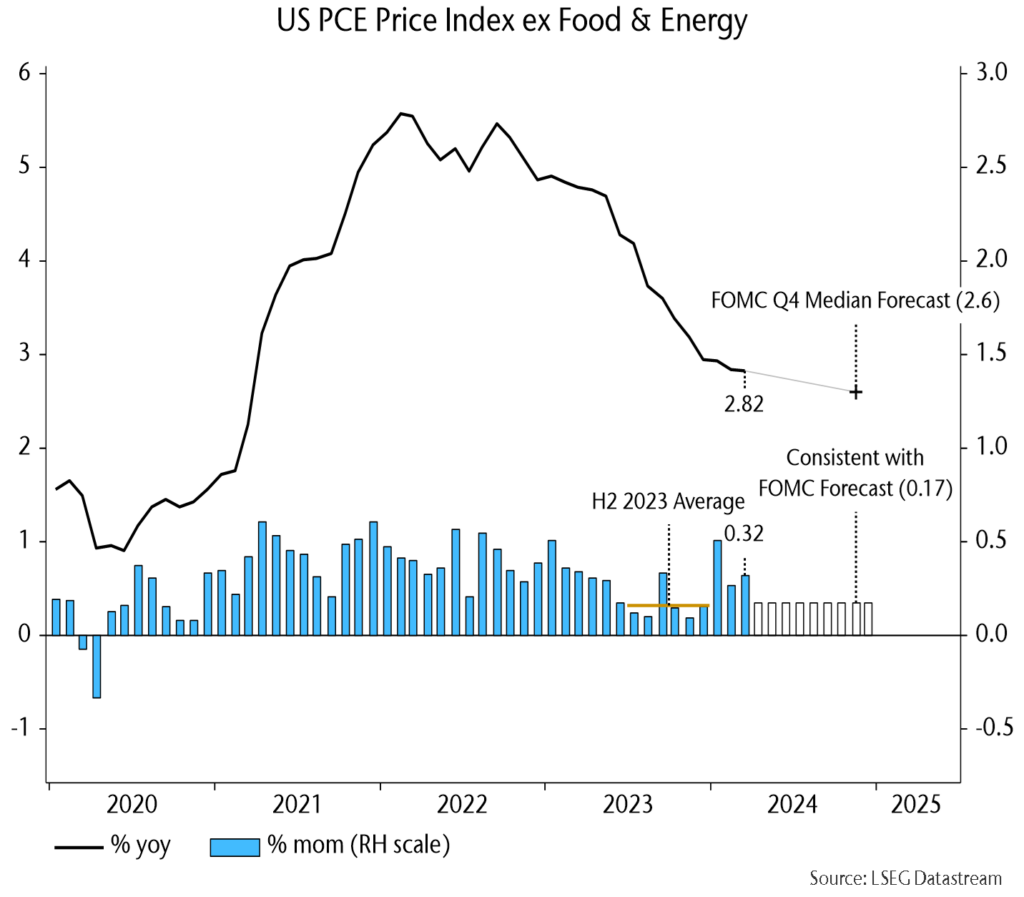
This still looks feasible despite disappointing Q1 numbers: monthly growth averaged 0.16% during H2 2023.
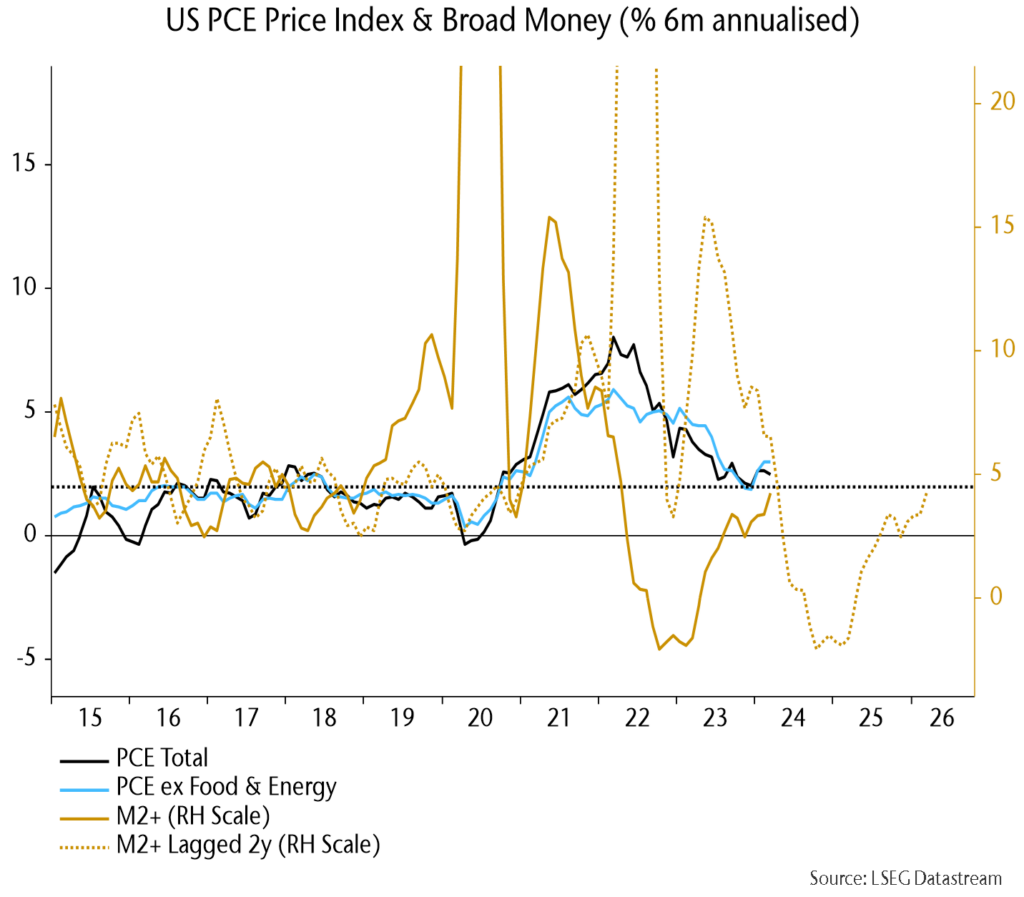
The “monetarist” rule of thumb of a two-year lag from money trends suggests a strong disinflationary impulse in H2:
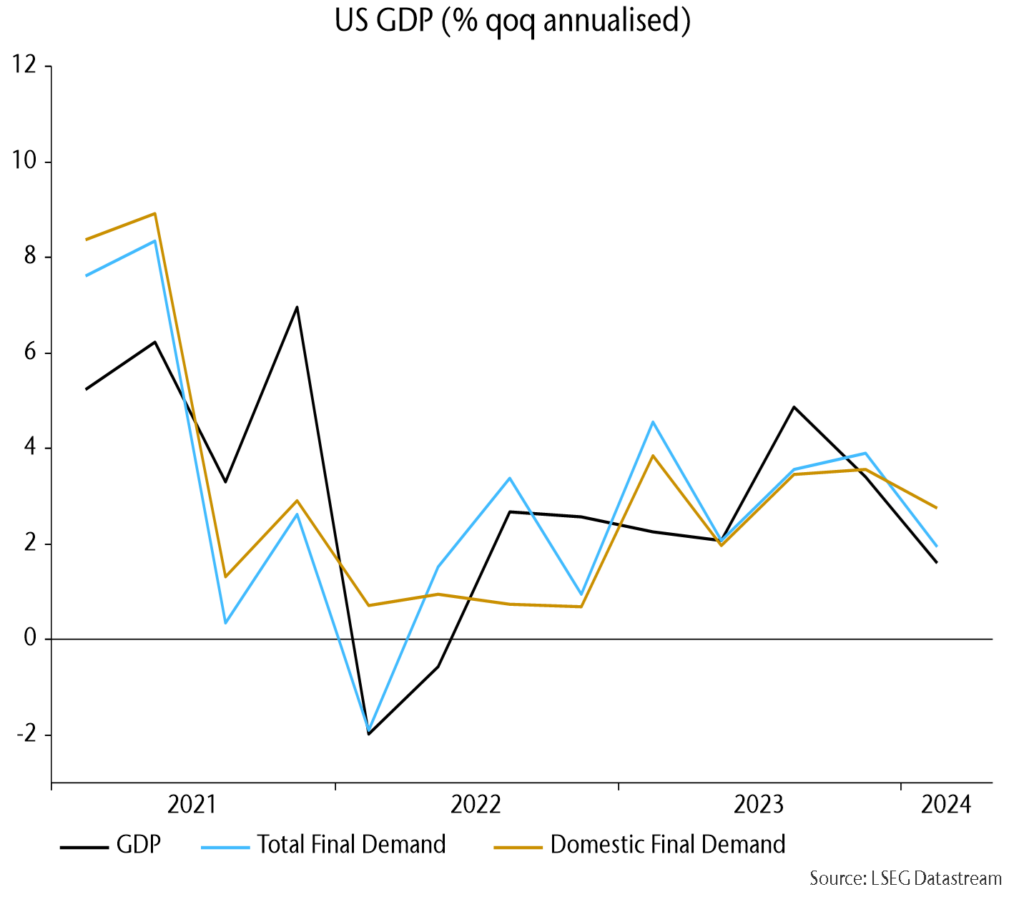
US Q1 GDP growth disappointed although bulls focused on solid domestic final demand:
Another labour market data set questions the reliability of recent strong payrolls numbers:
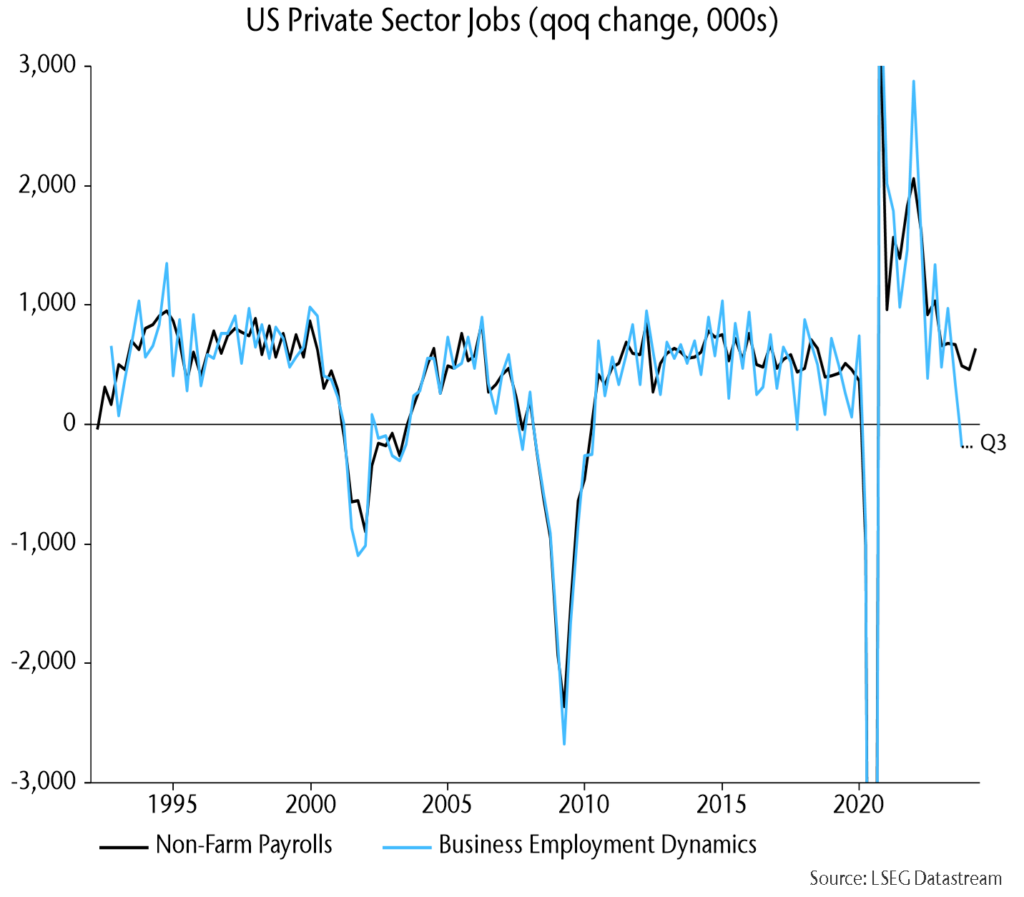
The BED data set is based on unemployment insurance records submitted by 9.1 mn private establishments vs. a sample size of 670k for the monthly payrolls survey.
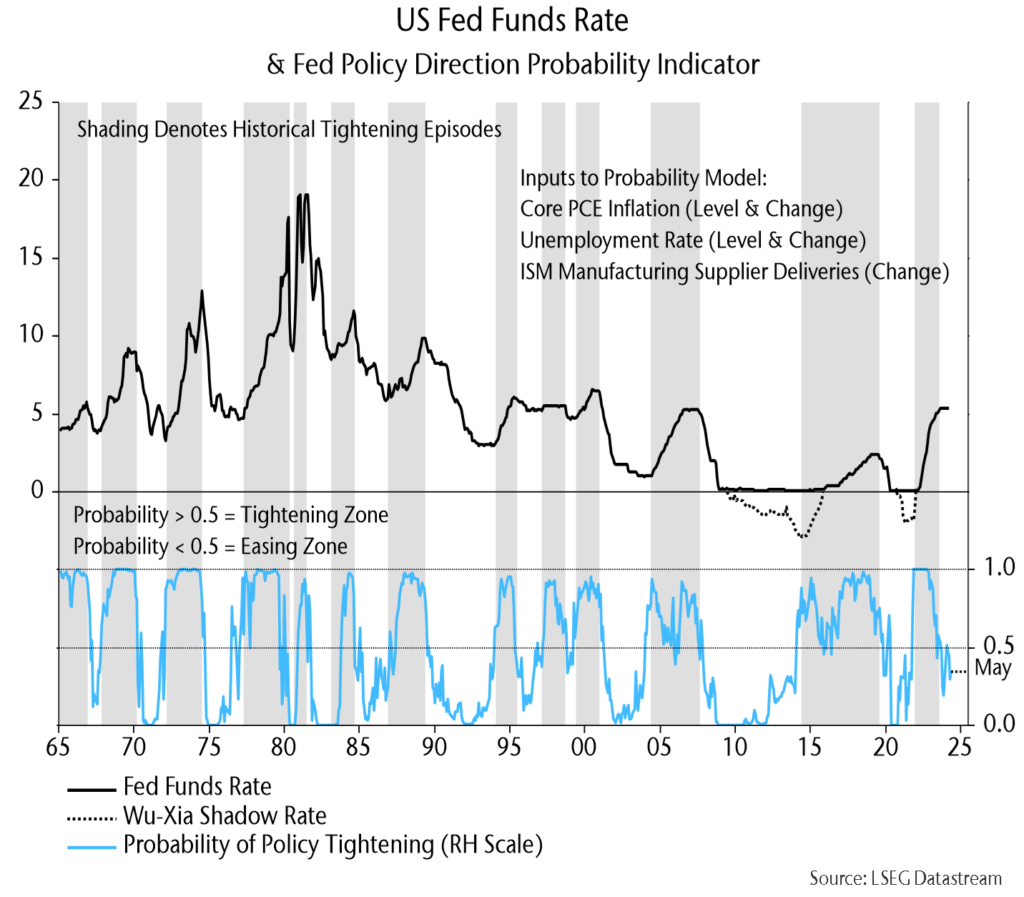
A simple reaction function model suggests that the Fed will retain an easing bias this week:
In other news …
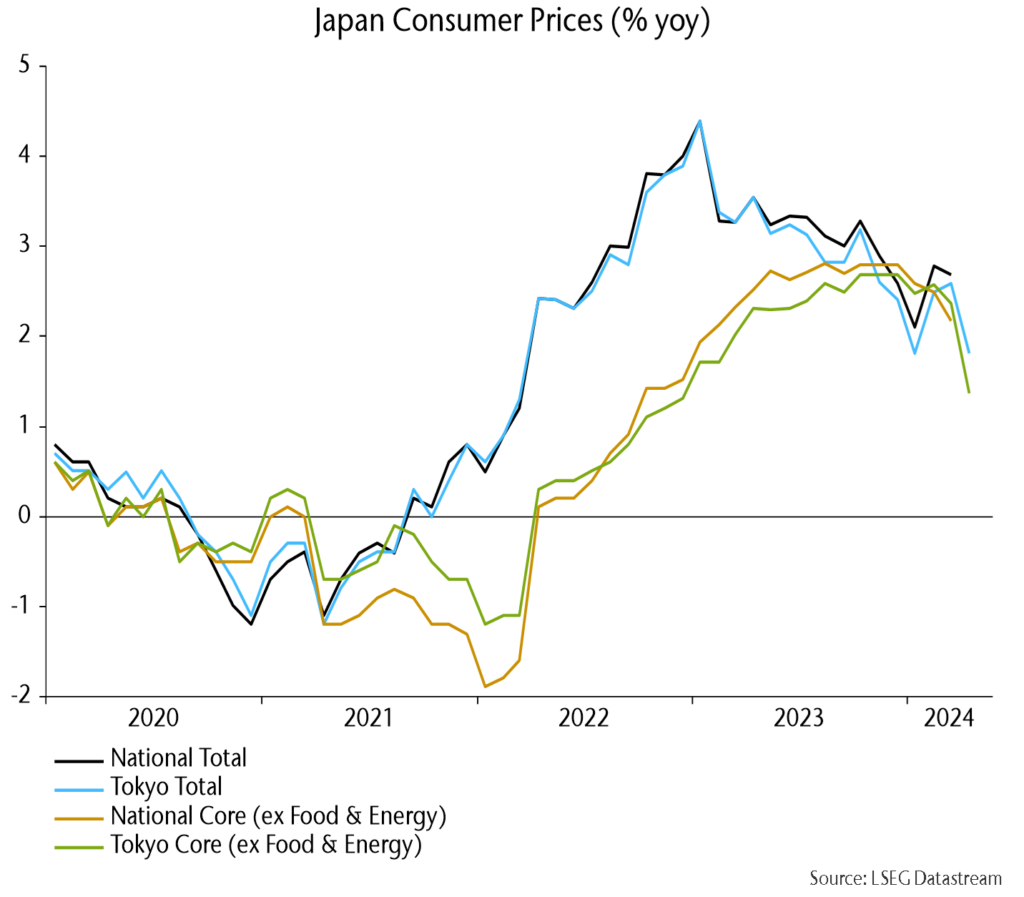
Tokyo CPI numbers – released before national data – surprised favourably, although mainly for a Tokyo-specific reason (blanket exemption of high school tuition fees):
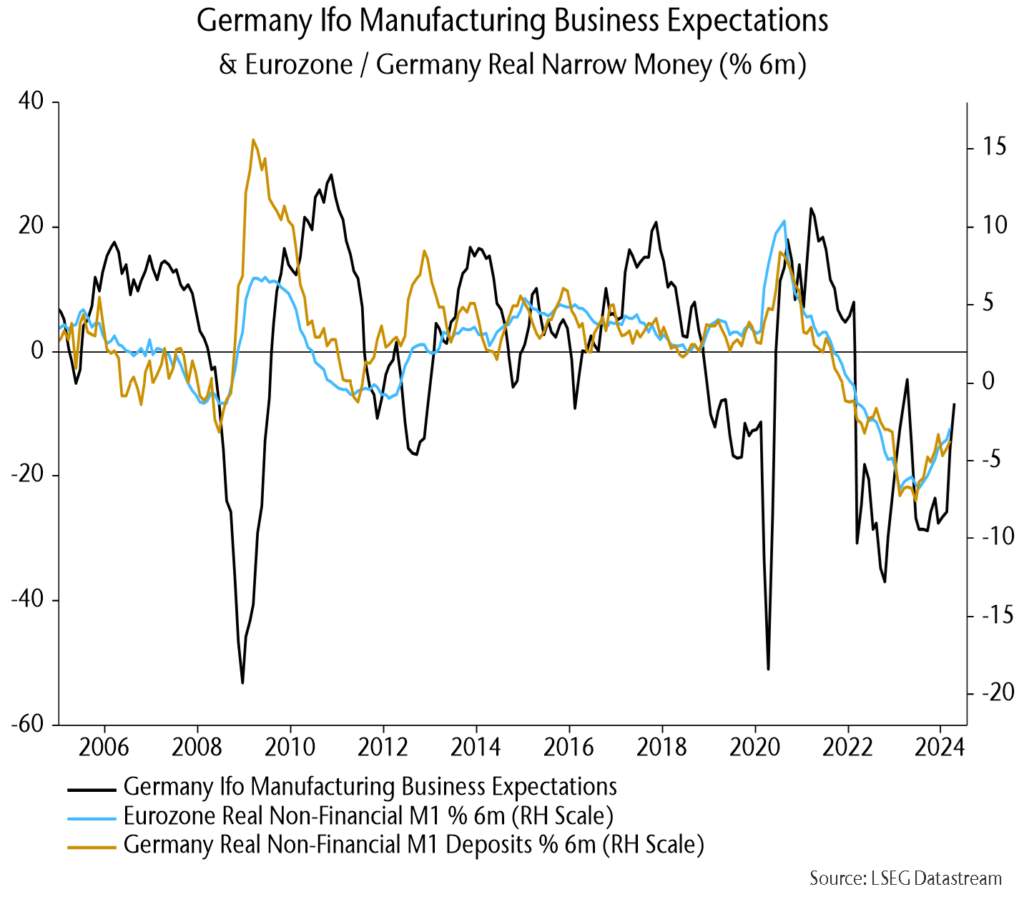
The German Ifo survey rose further but remains weak, as does German / Eurozone real money momentum:
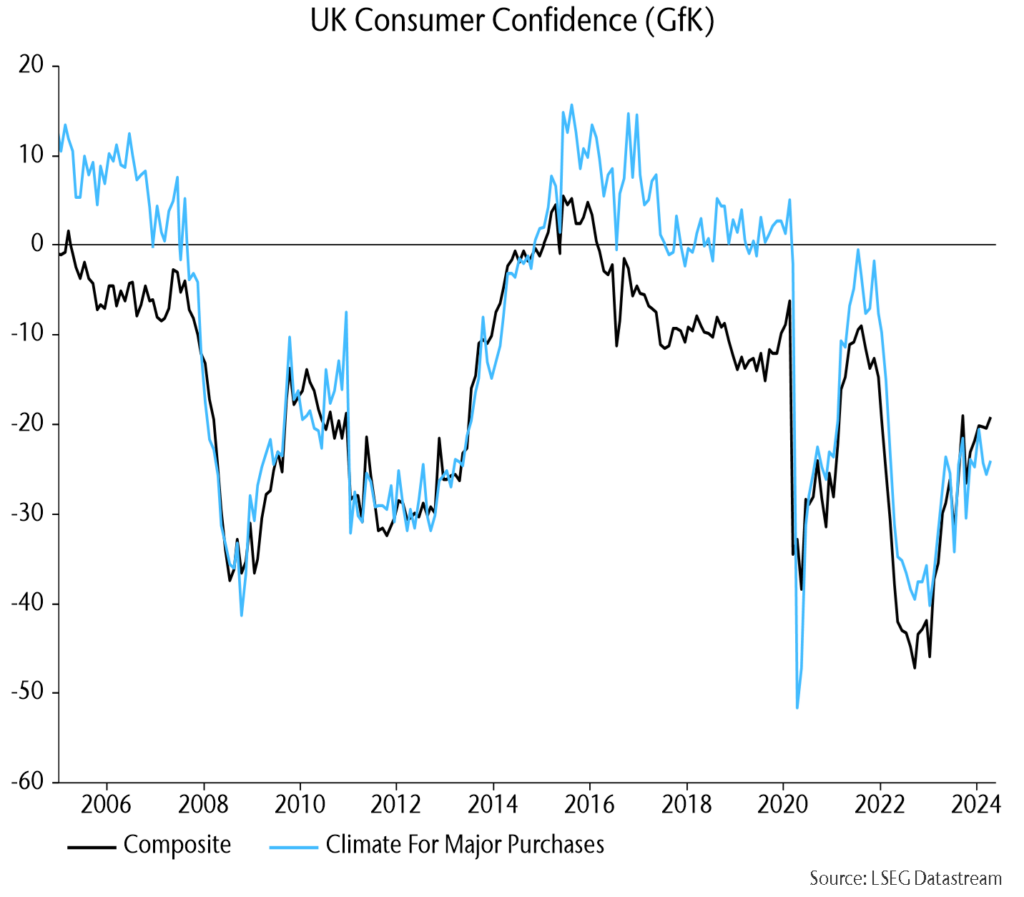
Recovering UK real wage growth hasn’t boosted consumer buying plans yet:
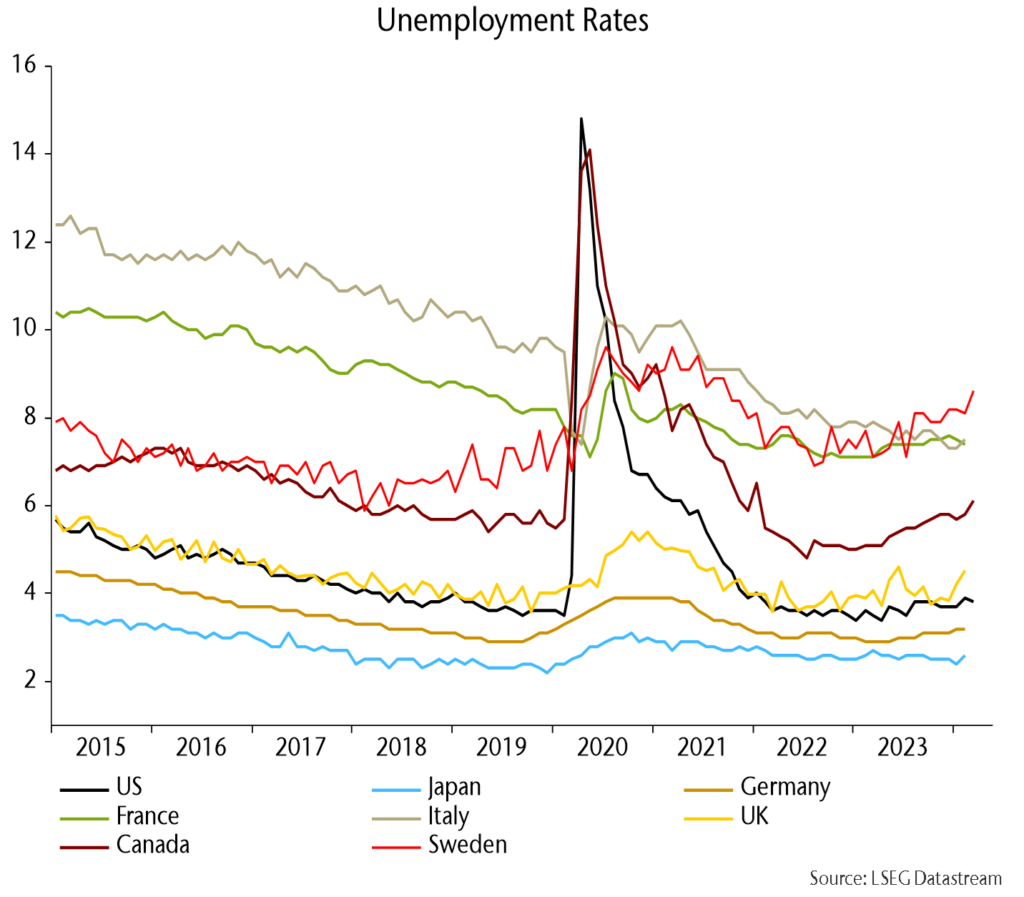
The Swedish unemployment rate (caveat: volatile) hit a new high, echoing recent sharp moves in Canada / the UK:
MSCI China is now ahead of DM ex. US and EM ex. China indices YTD: