L’argent, le moteur des marchés
US broad money update: low household cash ratio
16 janvier 2026 par Simon Ward
A measure of US broad money M3 derived from data in the Fed’s quarterly financial accounts grew at a 5.5% annualised rate in the two quarters to end-September. This exactly equals the average over the non-inflationary five years to end-2019 – see chart 1.
Chart 1
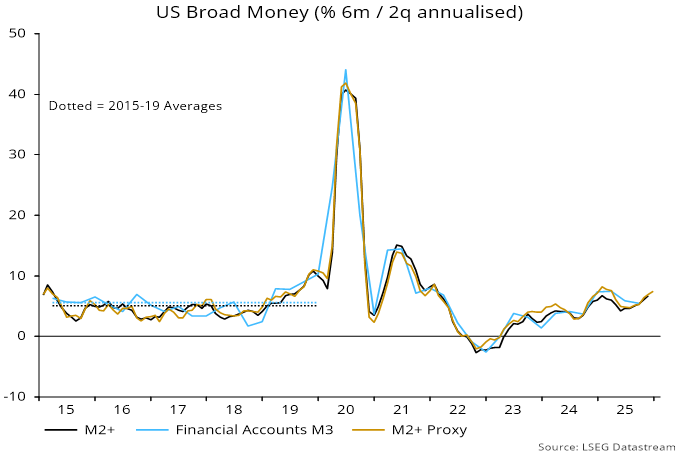
The growth rate is also close to a 5.4% six-month annualised increase in the monthly M2+ measure calculated here. M2+ adds large time deposits and institutional money funds to official M2. M3 additionally includes repos.
M2+ growth rose to 6.7% in November, with available information suggesting a further increase in December. This could signal a future rise in inflation, though probably not before H2 2027. However, a similar pick-up a year ago reversed in H1 2025.
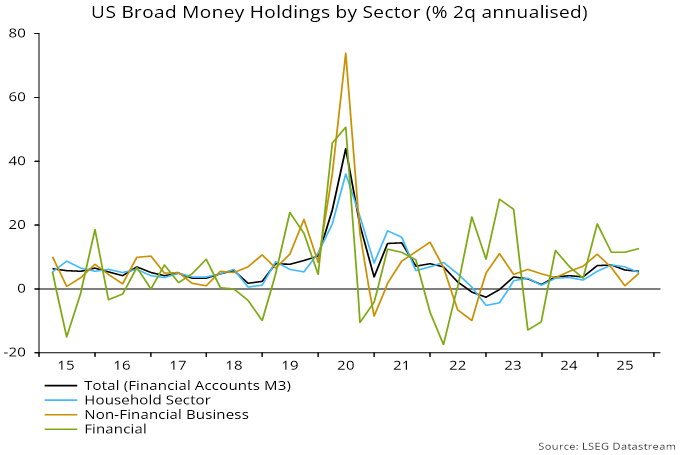
An advantage of the financial accounts measure is that a sectoral breakdown is available. M3 holdings of the household and non-financial business sectors rose at similar rates in the two quarters to September (5.2% and 5.0% annualised respectively), with stronger growth (12.7%) in financial sector money (i.e. held by insurance companies, pension funds and GSEs) – chart 2.
Chart 2
While household broad money continues to grow respectably, it has lagged far behind financial wealth. Money accounted for 14.0% of total financial assets at end-September, the lowest share since Q2 2019 – chart 3.
Chart 3
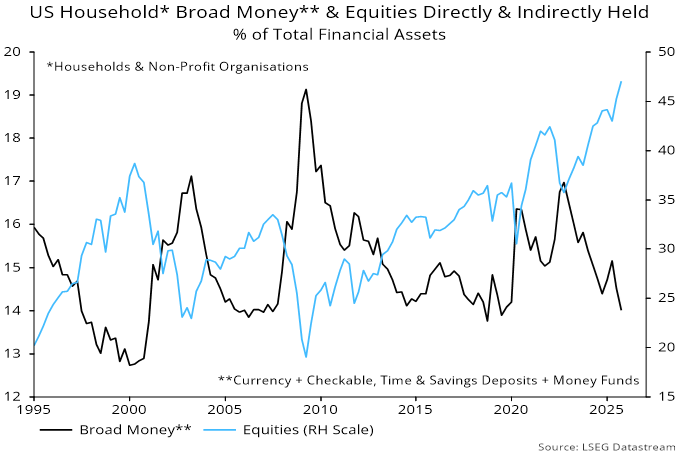
The equity share of financial wealth, meanwhile, reached another post-WW2 record of 47.1%.
The fall in the broad money share since 2022 has been driven by time and savings deposits, with the combined weighting of currency, checkable deposits and money funds stable – chart 4.
Chart 4
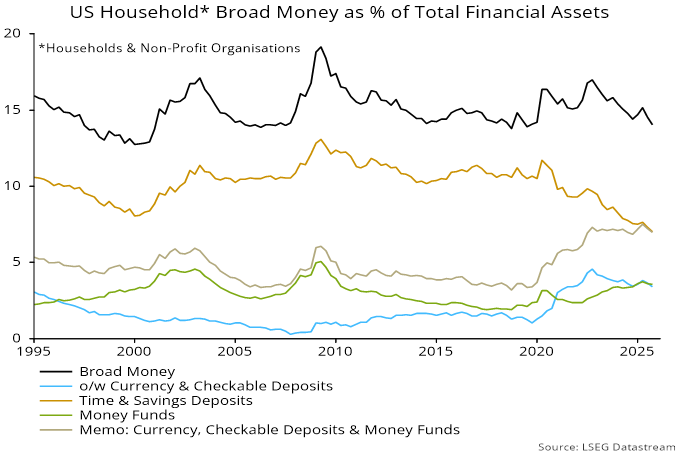
A chart recently doing the rounds shows only the latter measure (i.e. excluding time and savings deposits) to support a claim that household cash levels are high. Such selective use of data is regrettable.
(Note that the share of time and savings deposits has also been reduced by the reclassification of some savings deposits as demand – i.e. checkable – deposits.)
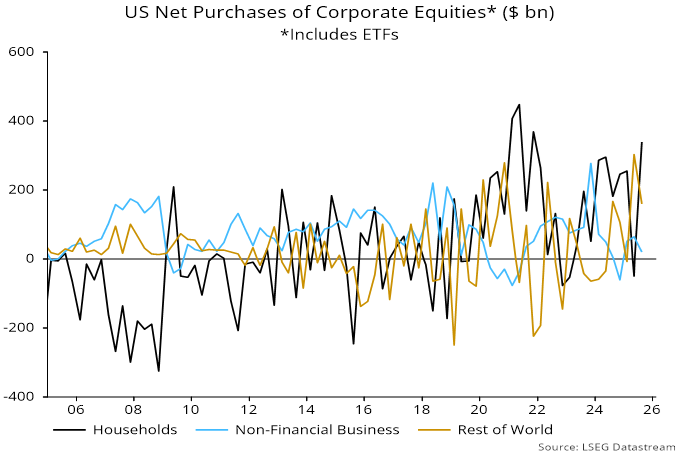
The rise in the equity share mostly reflects price appreciation but households have also been buying into strength.
The rally from the October 2022 low was initially driven by corporate demand but this fell off after H1 2024, with household and foreign purchases taking up the slack – chart 5.
Chart 5
The broad money share reached a similar level before the GFC bear market and corrections in 2015 and 2018, as well as the 2020 covid sell-off.
The share fell below the current level in the late 1990s but equity exposure was then significantly lower, peaking at 38.7%. Put differently, the higher beta of the balance sheet now makes a similar cash undershoot less likely.