L’argent, le moteur des marchés
UK housing crash?
25 mars 2026 par Simon Ward
The Gulf War III mortgage rate shock may be the trigger for the long-term housing cycle to enter its “bust” phase.
The driving variable of the cycle is demand for new and existing homes. This is reflected in turnover and has secondary impacts on new construction and prices. Prices usually lag volume gauges of the cycle.
The UK cycle can be traced back in various indicators to the early 18th century (at least) – see chart 1. Official statistics on turnover – property transactions – start in 1959. Turnover is closely correlated with the number of approved or actual loans for house purchase, data for which begin in the interwar period. To go back further, it is necessary to rely on completions data, a regional (Middlesex) series on registrations of property deeds and an indirect gauge, imports of timber, for the earliest years.
Chart 1
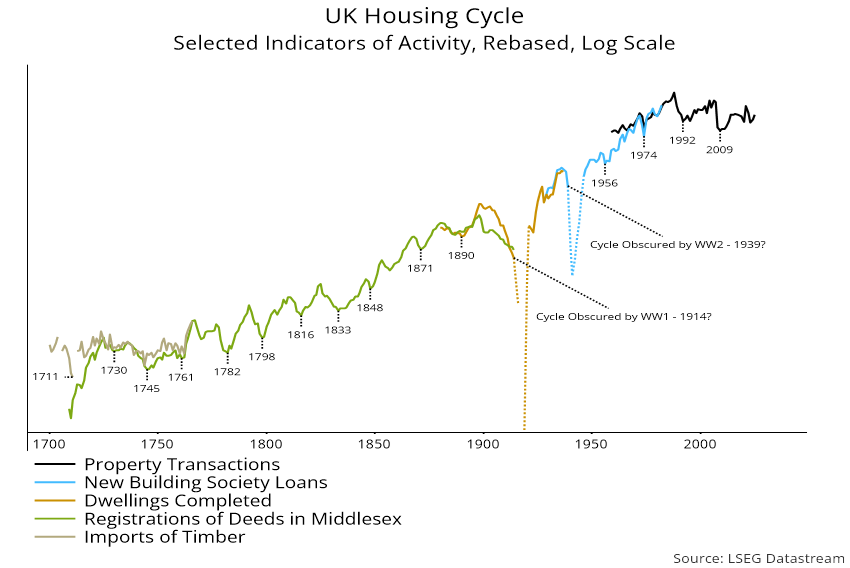
The dates in the chart are suggested timings of housing cycle lows. Based on these dates, there were 16 complete cycles, measured from low to low, over the 298 years between 1711 and 2009, implying an average cycle length of 18.6 years.
The two cycle downswings in the first half of the 20th century were magnified and extended by the World Wars – it is reasonable to assume that the lows would otherwise have occurred several years earlier.
The three completed cycles since WW2 were of similar length – 18, 18 and 17 years respectively. If the current cycle were to conform to the 18.6-year long-term average, another low would be reached in 2027-2028.
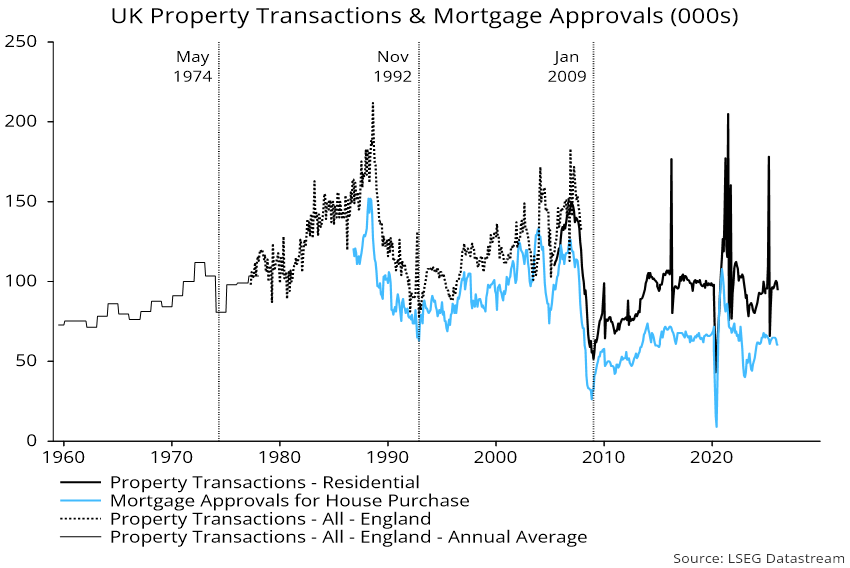
Chart 2 shows higher-frequency data on property transactions and mortgage approvals. The peak of the current cycle, in 2021, occurred earlier than in the prior two, as pandemic-related policy stimulus pulled forward demand. Activity corrected sharply in 2022-23 as interest rates rose but staged a partial recovery in 2024-25. This appears to have ended, with mortgage approvals easing to a 23-month low in January.
Chart 2
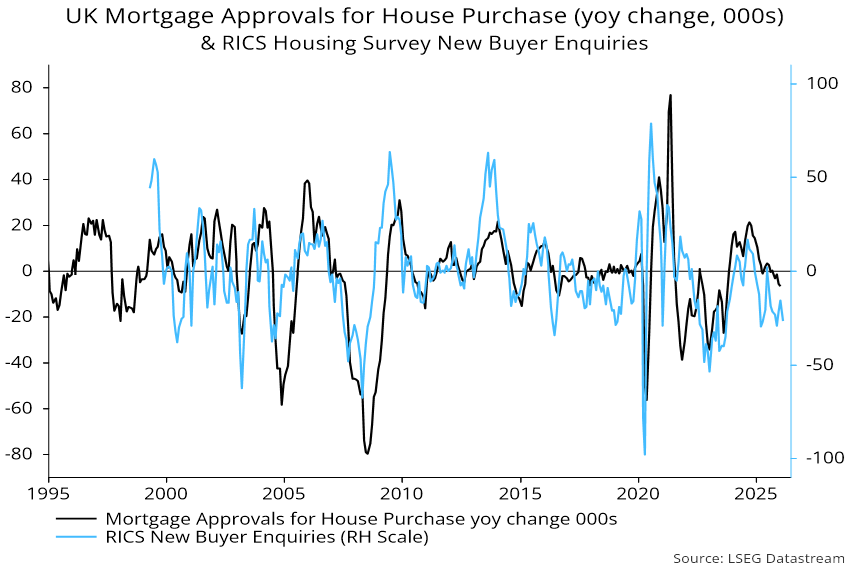
The new buyer enquiries component of the RICS housing survey is correlated with the annual rate of change of mortgage approvals – chart 3. Buyer demand is likely to weaken in response to the mortgage rate shock, suggesting a further / faster decline in approvals.
Chart 3
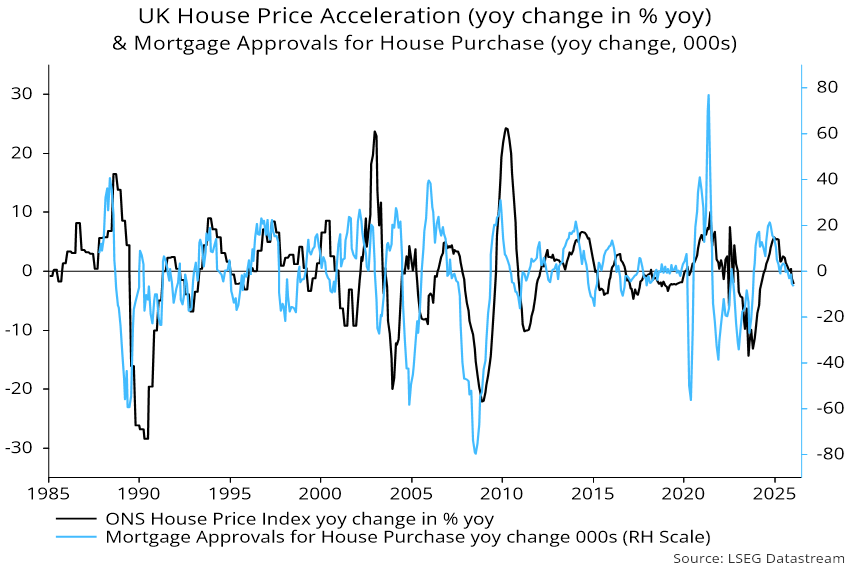
The rate of change of approvals, in turn, leads the rate of change of annual house price inflation – chart 4. Falling approvals suggest that annual price momentum – 1.4% in January, according to the ONS index – will slow further, probably turning negative.
Chart 4
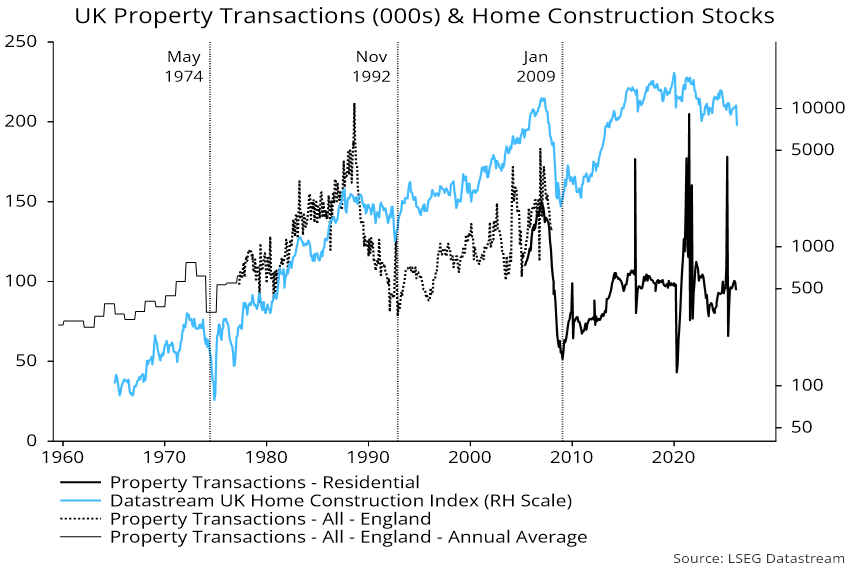
Housebuilding stocks are behaving consistently with the onset of the bust phase of the cycle, recently breaking below their 2022 trough to reach the lowest level since 2013 – chart 5.
Chart 5