L’argent, le moteur des marchés
Semis and the stockbuilding cycle
23 avril 2026 par Simon Ward
The baseline view here has been that the global stockbuilding cycle would enter a downswing in 2026 into a low in H1 2027.
The stockbuilding cycle is a repeating fluctuation in the demand for production inputs and goods for final sale caused by inventories periodically over- and undershooting the level desired by manufacturers and distributors.
The approach here is to monitor the cycle using measures of the rate of change of G7 stockbuilding from national accounts data and business surveys.
The national accounts measure places the last cycle low in Q1 2023, implying that the current cycle is well-advanced – see chart 1.
Chart 1
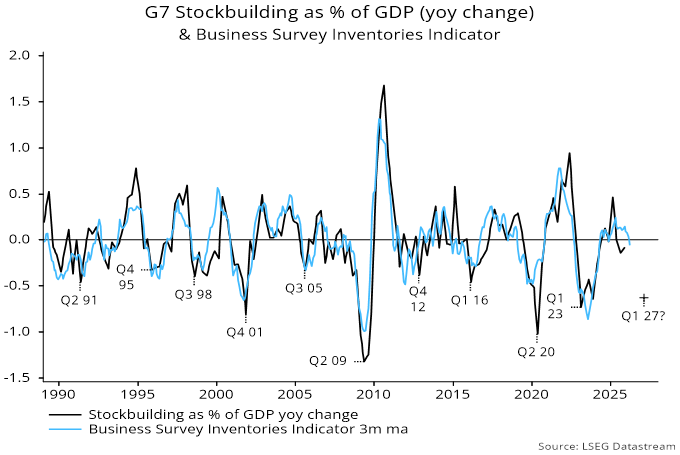
The business survey measure is more timely and recently crossed below zero, consistent with the cycle moving into a downswing.
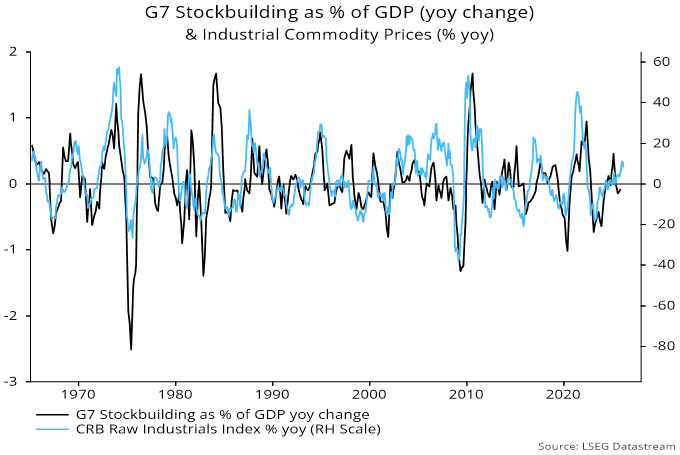
The original research on the cycle – by Joseph Kitchin, published in 1923 – used data on commodity prices, bank clearings and interest rates. Kitchin attributed the cycle to “psychological causes”, making no explicit link with inventory behaviour.
The cycle is evident in commodity prices because changes in demand for production inputs affect their price as well as volumes – chart 2.
Chart 2
Tech investors often dismiss the cycle as an “old economy” phenomenon but electronic components are a key production input subject to the same inventory-related demand swings as traditional industrial commodities.
There is no single price index capturing the changing nature of electronic components. However, export prices of key supplier economies are a rough proxy. Chart 3 shows that the annual rate of change of an average of Taiwanese and Korean export prices in US dollars tracks the national accounts-based measure of G7 stockbuilding changes.
Chart 3
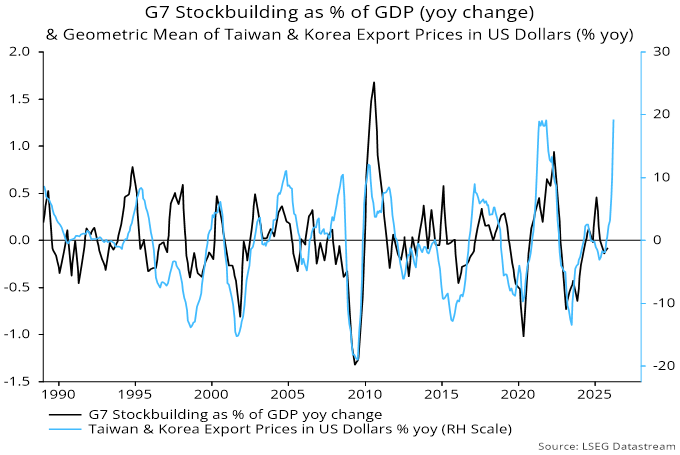
Chart 4 overlays the annual rate of change of an average of 12-month forward earnings estimates, showing a similarly significant correlation.
Chart 4
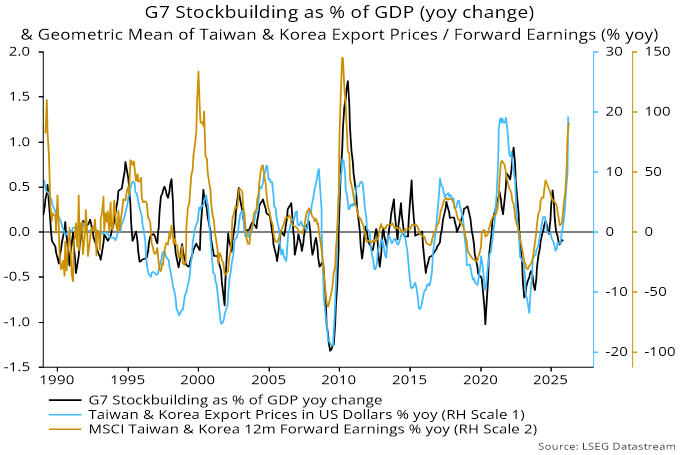
Based on the cycle assessment here, the implication is that momentum of component prices and earnings should be at or close to a peak.
Why could this prove wrong? One possibility is that the current stockbuilding cycle will extend. This cycle is judged to be the last of a set of five constituting the current housing cycle (which began in 2009). Final cycles tend to be longer than the 3.5-year average, with one recent example (1986-91) reaching 4.5 years. The next low, therefore, could be delayed until H2 2027, in turn suggesting a later start to the downswing.
Another counter-argument is that strong demand for components is being driven by an ongoing upswing in the business investment cycle – narrowly focused on AI-related spending in the current cycle – as well as peak stockbuilding. This cycle last bottomed in 2020 and has ranged between 7 and 11 years historically, so the upswing could – in theory – continue for several more years. The thinking here is that the current cycle is more likely to be short, reflecting a long prior cycle (11 years) and a drag from the expected stockbuilding downswing.