Commentaires
Semiconductor lollapalooza stumbles
17 juin 2026

Last month, we wrote to investors about how the outperformance of EM equities was the product of a very narrow rally driven by a boom in South Korean and Taiwan tech companies. We noted that despite parabolic moves in semiconductor stocks, valuations have actually become cheaper due to a massive acceleration in earnings growth underpinned by rising US hyperscaler investment seeking to power frontier AI models.
In the weeks since, tech stocks continued to surge in feverish trading led by leveraged retail investors in South Korea. Jefferies Global Head of Equity Strategies, Chris Wood, flagged in early April that margin lending in South Korea had doubled from W15.8 trillion at the end of 2024 to an incredible W32.7 trillion this year.
Korea margin loan balance (Kospi + Kosdaq)
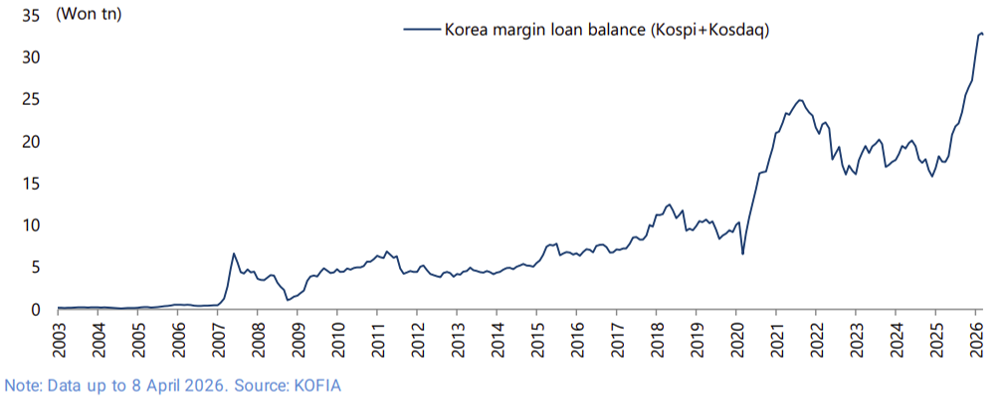
Source: Jefferies Global Equity, April 2026.
Investors also rushed to gain exposure through passive vehicles including leveraged ETFs.
CSOP SK Hynix daily 2X leveraged product
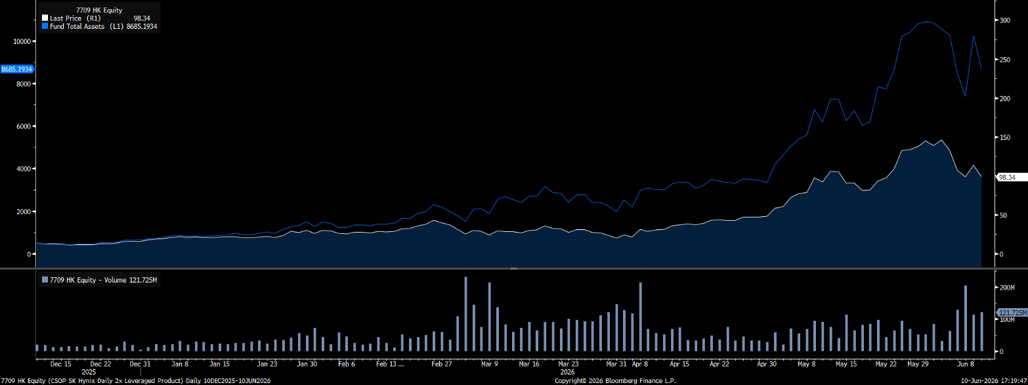
Source: Bloomberg
Among GEM managers, overweight positioning has been steadily rising since the beginning of 2025.
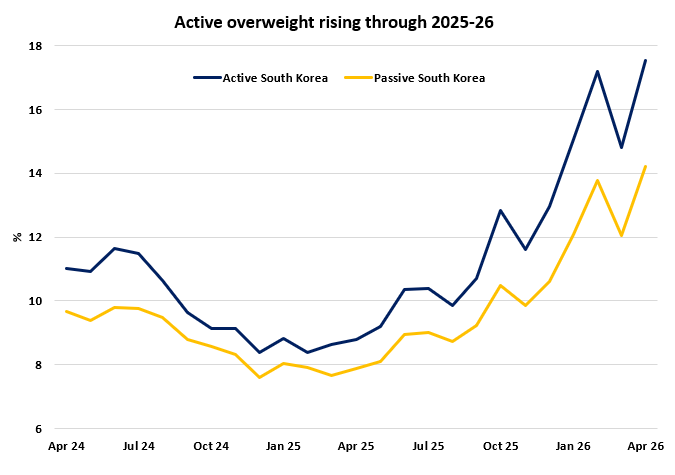
Source: NS Partners & EPFR (date to end-April 2026).
The only game in town
The acceleration in fundamentals for stocks in the AI supply chain has been so dramatic that it has swamped the broader EM investment universe. The economic drag created by the US–Iran conflict has hit markets with higher sensitivity to rising energy prices. As these markets weather the economic turbulence, AI looks increasingly like the only game in town. In response, many investors have sold down areas hit by these tailwinds to fund larger weightings in AI-exposed names.
This shift in allocation resembles Charlie Munger’s “Lollapalooza Effect,” where extreme, disproportionate outcomes arise when multiple cognitive biases and incentives converge and reinforce each other simultaneously. In this case, a shift by investors, attracted by a sharp acceleration in fundamentals, has been magnified by systematic strategies, passives and leverage chasing the momentum. As a result, the IT sector now accounts for over 40% of the benchmark.
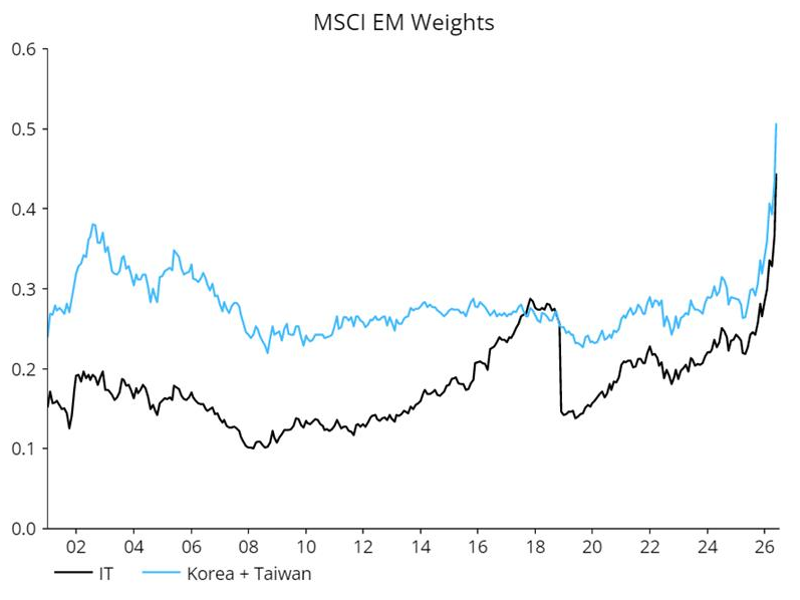
Source: NS Partners & LSEG Datastream.
Deteriorating monetary backdrop another source of fragility
Our Chief Economist, Simon Ward, has been writing about a global monetary squeeze which began in the months leading up to Gulf War III. This was exacerbated by the war sending commodity prices and CPI momentum higher, leading to a slowdown in real money growth.
Deterioration in real money growth due to high CPI momentum
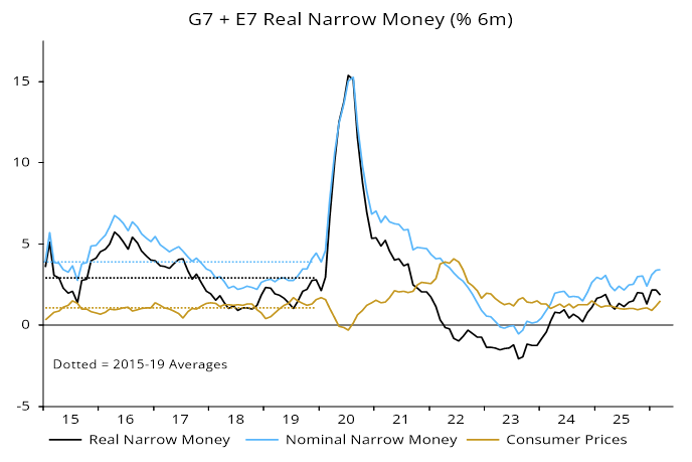
Source: Money Moves Markets, May 2026.
Nominal money expansion to counteract the liquidity squeeze is unlikely in the near term, with most major central banks now making more hawkish noises in response to price pressures. This means less liquidity support for markets, especially in pockets which have run hard such as semiconductors.
Broken story or a reset in overbought technicals?
In early June, crowded positioning and an itch to take profits collided with rising macro uncertainty arising from the release of strong US payroll data which topped market forecasts, igniting fears the US Federal Reserve would be forced into tightening monetary policy. It is also possible that forthcoming blockbuster IPOs of SpaceX, OpenAI and Anthropic placing a strain on market liquidity further unsettled investors sitting on large gains. This culminated in a sharp selloff on the 5th of June, with winning trades in the tech sector suffering the most.
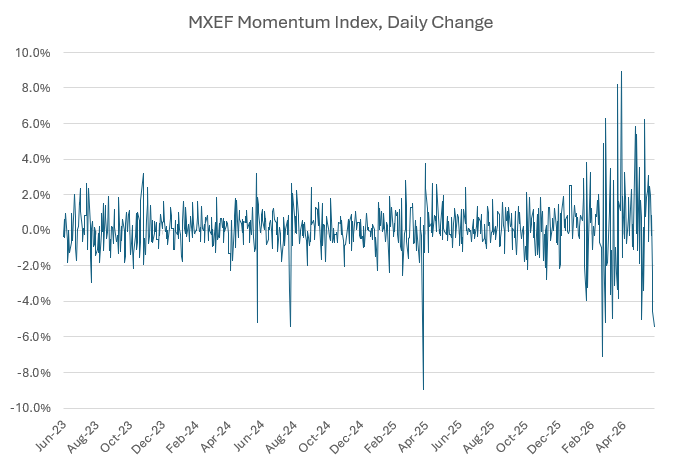
Source: Bloomberg data
Behavioural discipline
As noted in last month’s commentary, Rallying EM equities reflect an AI-powered earnings surge, we had been trimming AI exposure into strength on a view that parabolic stock moves would inevitably run into a pullback. We have also been re-allocating within our IT exposure (a modest c.3% overweight as at the end of May), from companies where stock performance risks becoming detached from reality and into niches benefiting from the same demand drivers but where investor enthusiasm has not been so frenzied.
Over the past few years, we have worked to sweat our risk budget within the AI-supply chain, tweaking the portfolio as data and conviction changes by rotating through a number of segments outlined below.
AI exposure across layers
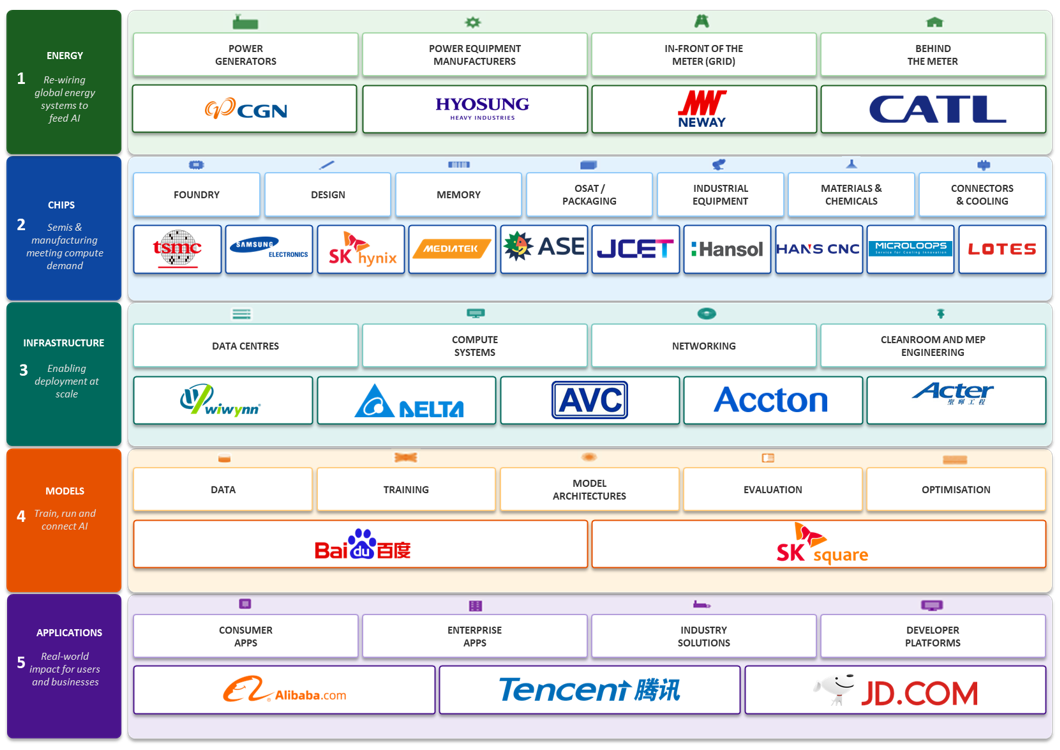
Source: NS Partners, June 2026.
The aim of this activity is to maximise risk-adjusted returns by maintaining a healthy exposure to AI supply chain companies, but in an allocation that is cheaper, less crowded, more positively skewed and with more independent catalysts than a static allocation to the original winners.