Commentaires
Quality by first principles in EM
17 décembre 2025

Outlook
Emerging market equities have outperformed developed markets for the first time in five years, and by the most since 2017. The backdrop for the asset class is the most positive we have seen for the last decade or more. We expect the monetary backdrop to remain disinflationary for the first half of 2026, with treasury yields and the US dollar expected to continue declining.
Money growth in China is supportive, strong in India, and weak in Brazil, Mexico and South Africa. EM earnings growth is forecast to be 20.5% in 2026, nearly double this year at 10.4% according to Jefferies. On a more cautious note, global money trends suggest an economic slowdown into the end of Q4 and through Q1 2026 making us cautious on cyclical exposure.
Quality investing by first principles
In investing, there is a fine line between discipline and rigidity, or between conviction and stubbornness. Any resilient investment process must be nimble and adaptable enough to weather different market regimes. Investors relying too heavily on static profitability or valuation metrics in their investment process risk getting caught out when structural change takes place.
Screening for returns on equity, low leverage and earnings growth will give you only a very limited snapshot of investment value. Our aim is to paint a far richer picture of the businesses we are analysing.
We are trying to think about value creation in the stock market from first principles. Economic value added (EVA) stock analysis is one of the key tools we use for this. For those who missed it, we wrote about the core elements of EVA investing in a previous monthly, with highlights from that piece below.
Our approach to stock picking – focus on economic value added (EVA)
Made famous by Stern Stewart & Co., the approach homes in on the spread between the rate of return on a company’s invested capital and its cost of capital; economic value added, or EVA for short.
Why? We know that over the medium to long term, EVA is directly tied to the intrinsic value of any company and the fuel that fires up a company’s stock price.
Stock prices reflect how successfully a company has invested capital in the past and how successful it is likely to be at investing new capital in the future. EVA is the best methodology to measure the value that management has added to, or subtracted from, the capital it has employed over time.
How can management create value?
Bennett Stewart in his book The Quest for Value boils it down to three drivers:
- The rate of return earned on the existing base of capital improves; that is, more operating profits are generated without tying up more funds in the business.
- Additional capital is invested in projects that return more than the cost of obtaining new capital.
- Capital is liquidated from, or further investment is curtailed in, substandard operations where inadequate returns are being earned.
We are looking for companies that can be expected to generate high or improving returns on the capital employed in their businesses. These are companies run by management teams laser-focused on making investments that earn more than the cost of capital, and undertaking all positive net present value projects, while rejecting or withdrawing from all negative ones.
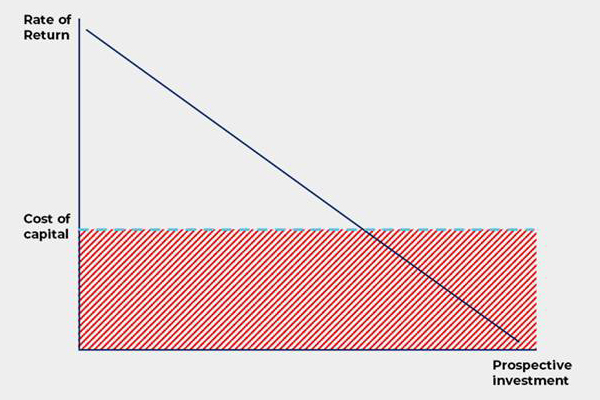
Source: Bennett Stewart (1991), The Quest for Value
Understand what drives returns
Value creation is not enough for long run success. We need to know whether it can be sustained. Our process is focused on identifying the drivers of these returns and assessing:
- whether there are historic changes or potential catalysts for improved value creation that are yet to be reflected in market prices; and
- the sustainability of those returns – are there enduring competitive moats that will protect excellent returns on invested capital?
Our approach identifies highly productive and capital-efficient companies pursuing value creation in a variety of ways. It also focuses on whether that value creation is sustained via competitive moats.
Moats can take a number of forms, from differentiation via proprietary tech, brands or prime locations, to high switching costs, network effects, cost leadership, economies of scale or minimum efficient scale.
EVA helps to cut through the noise and home into whether a business is creating real economic value, and whether the trend of that value creation is strengthening or weakening. Crucially for emerging markets with weaker governance and opaque accounting, headline earnings can mask poor capital efficiency or inflated asset values. EVA cuts through these distortions by focusing on true economic profitability, drilling into the underlying economic strength of a business.
By emphasising value creation rather than headline earnings, EVA highlights when incremental investments fail to cover their capital charge – often an early warning sign of eroding competitive advantage. Further, this approach naturally draws attention to cyclical or structural changes impacting margin compression, rising capital intensity or declining asset productivity, which traditional metrics might obscure.
Below is a rough sketch of how EVA can provide a more robust check of company economics than an approach focused on accounting profitability.
Example: EM Real Estate Development Co.
Accounting view (P/E)
Reported net income: $100m
Shares outstanding: 50m
EPS: $2
Current price: $20
P/E ratio: 10x
On the surface, ABC Realty looks attractively valued at 10x earnings, suggesting a cheap stock relative to peers trading at 12–15x.
Economic value added view
NOPAT (Net operating profit after tax): $120m
Invested capital: $1.5bn
Weighted average cost of capital (WACC): 12%
Capital charge: $180m (1.5bn × 12%)
EVA = $120m – $180m = –$60m
Despite positive accounting profits, the company is destroying economic value, earning less than its cost of capital. This signals that growth funded by debt and equity is not creating shareholder wealth, even though the P/E ratio looks attractive.
In this case, the EVA approach provides a better assessment of whether a company’s moat remains intact and whether its strategic positioning continues to justify its valuation.
Below is a brief example of what we love to see from an EVA perspective.
Stock example – Vivara: market leader in Brazil’s jewellery industry, vertically integrated and expanding aggressively
Vivara is the dominant retail jewellery brand in Brazil, controlling more than 20% of the market.
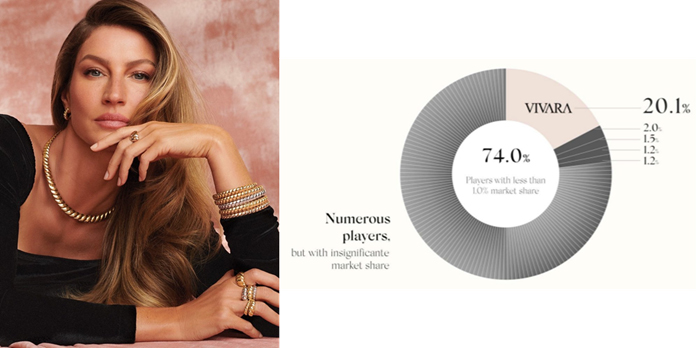
Source: Vivara Investor Relations 2025
The business is improving its returns on capital through new store openings, sweating assets and maintaining cost control through scale as the only domestic player which manufacturers its own products.
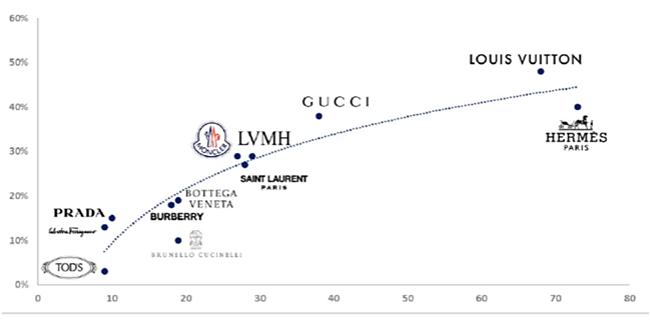
Sweating the assets harder than peers
Retail space productivity (EUR 000s for sale/m2) correlates with EBIT margin (%) – Global players
Retail space productivity (R$ 000/sqm) correlates with EBIT margin (%) – Local players
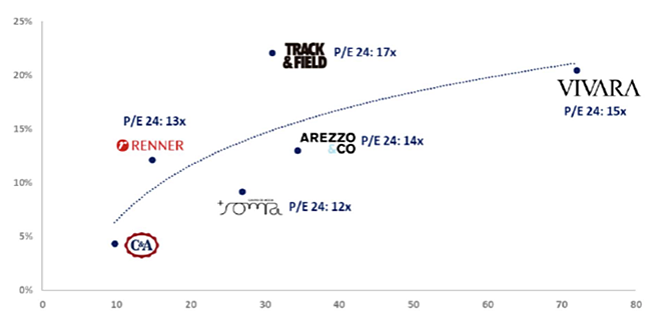
Source: BTG Pactual 2024
Value creation highlights:
- Opening 50–70 stores per year, focus on aspirational Life brand, forecast 40% of sales by 2026.
- 2-year sales CAGR of c.18% and EBITDA CAGR c.19%. Same-store sales growth consistently positive.
- E-commerce 23% of total sales, headroom for further growth.
- Plans to enter new markets Mexico and Panama, leveraging scalable business model.
Return drivers and competitive advantage:
- Vertical integration: Vivara controls the entire value chain from design to production and distribution, enabling cost efficiency and rapid response to market trends.
- Brand strength and market position: Strong brand recognition and customer loyalty, 75% retention rate and a broad product range catering to multiple segments.
- Scale and retail network: Extensive retail network with 40% penetration in premium malls and significant opportunities for further expansion.
Our kind of business – this all translates into an attractive EVA profile
Vivaras ROIC charts
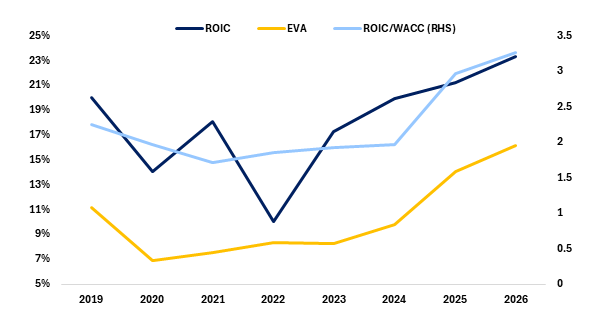
Source: NS Partners and Bloomberg
As emerging markets show renewed strength, our approach remains rooted in first principles: seeking resilient, capital-efficient companies positioned for long-term value creation that should drive stock prices.