L’argent, le moteur des marchés
Market weakness consistent with monetary / cycle analysis
20 novembre 2026 par Simon Ward
Why have markets gone “risk-off”? Two explanations are offered here.
First, six-month growth of global real narrow money has been below that of industrial output since April, with the shortfall widening in September – see chart 1. A post in June suggested that the “excess” money backdrop had switched to being a headwind for equities.
Chart 1
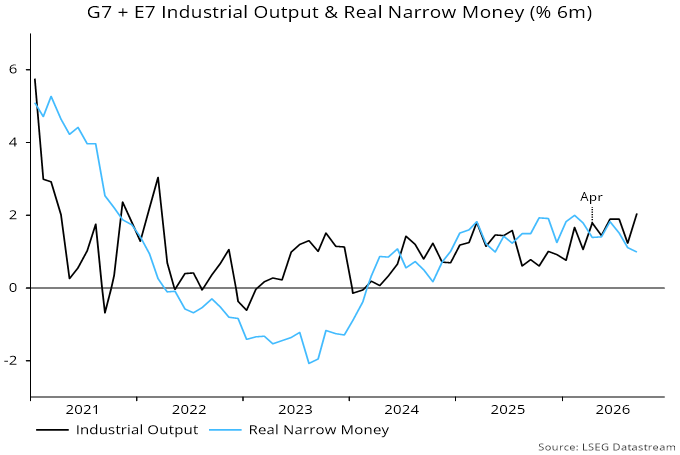
Historically, global equities outperformed US dollar cash by 12.0% pa on average when the real money / output growth gap was positive, underperforming by 5.5% when it was negative (based on data for 1970-2025 and allowing for a reporting lag).
A simple switching model based on this finding moved into cash at end-June, since when the MSCI World index has underperformed by 5.3% (as of yesterday’s close).
Secondly, the global stockbuilding cycle is judged to have reached a final peak in Q3 2026, with a downswing likely to extend into mid-2027, at least – see post from September. Markets typically experience a significant risk-off episode in the run-up to a cycle trough, often culminating in a “crisis” – chart 2.
Chart 2
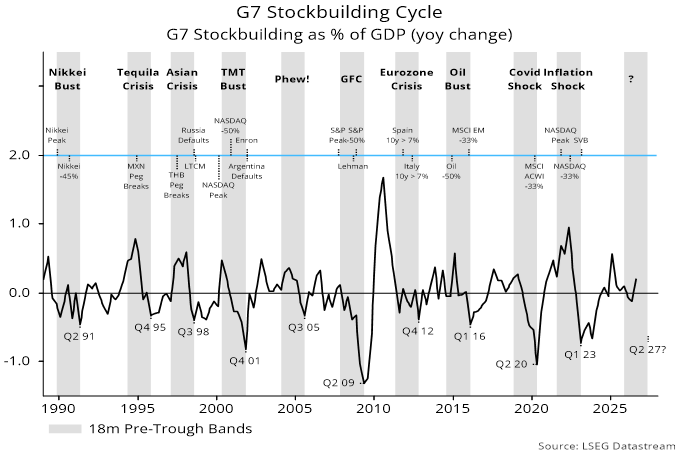
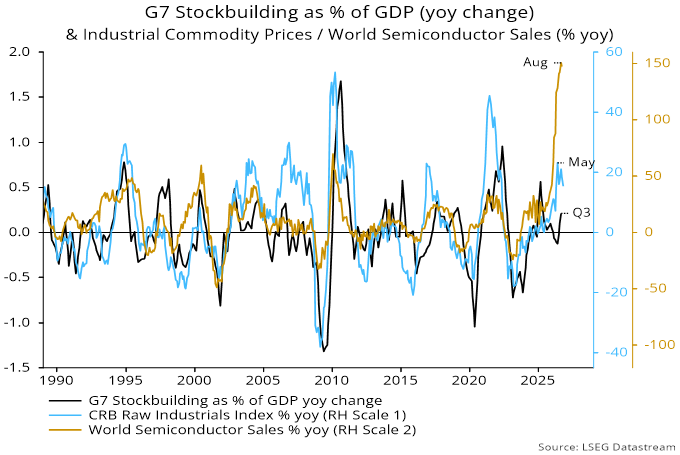
The cycle describes demand for production inputs – both raw materials and semi-manufactures, including electronic components – so exhibits a roughly contemporaneous correlation with their prices. The annual rate of change of industrial commodity prices has fallen since May, consistent with an incipient cycle downswing, while annual growth in global semiconductor sales may have peaked in August – chart 3.
Chart 3
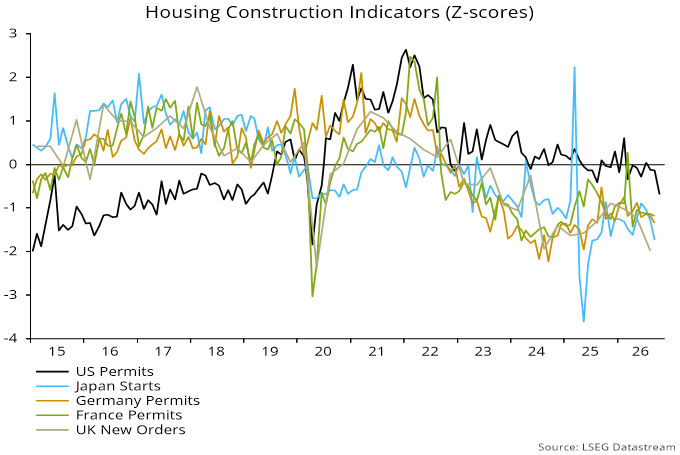
Equity market drawdowns in the run-up to stockbuilding cycle lows were usually significantly larger when the business investment and / or housing cycles were also weakening. The housing cycle is judged here to be in its late downswing phase, with a low possible between June 2027 and August 2028 – see the September post. Recent indicators are consistent with downside acceleration – chart 4.
Chart 4
October monetary data next week will allow an updated assessment of global “excess” money conditions.