L’argent, le moteur des marchés
Market moves consistent with mid / late stockbuilding cycle
13 mars 2025 par Simon Ward
Recent outperformance of non-US equity markets may be a signal of the end of the bull market rather than a harbinger of broadening strength.
Previous analysis comparing returns in the current stockbuilding cycle with history suggested weaker prospects for risk assets, a reversal of US equity market / cyclical sector outperformance, a decline in the US dollar, stronger industrial commodity prices and a correction in precious metals. Several of these themes are playing out and appear to have potential to extend.
The stockbuilding cycle averages 3.5 years in length and last bottomed in Q1 2023, suggesting another low in H2 2026. The previous view here was that the current cycle would be longer than normal, to balance a shorter previous cycle (2.75 years) and to harmonise with the business investment cycle, which isn’t scheduled to bottom before 2027.
There is, however, anecdotal evidence of firms / importers stockpiling inputs / finished goods to avoid tariffs, raising the possibility of an earlier cycle peak and start to the downswing.
The cycle indicators followed here do not currently support this alternative scenario. The annual change in G7 stockbuilding, expressed as a percentage of GDP, is usually significantly positive at cycle peaks but stalled just above zero in Q4. A more timely indicator based on business surveys was little changed through February – see chart 1.
Chart 1
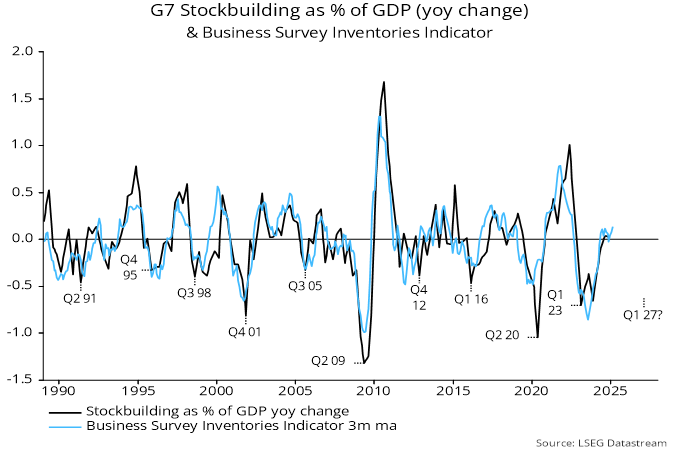
The previous view – that a cycle peak is still several quarters away and a downswing will be delayed until 2026 – will, therefore, be maintained. This assessment is consistent with a recent rise in global six-month real narrow money growth, suggesting a recovery in economic momentum in late 2025 following Q2 / Q3 weakness – see previous post.
Risk assets typically rally strongly in the first half of a stockbuilding cycle, partially retracing gains in the run-up to the next trough. Table 1, reproduced from the earlier post, compares movements in the current cycle through end-2024 with averages at the same stage of the previous eight cycles, along with changes over the remainder of those cycles.
Table 1
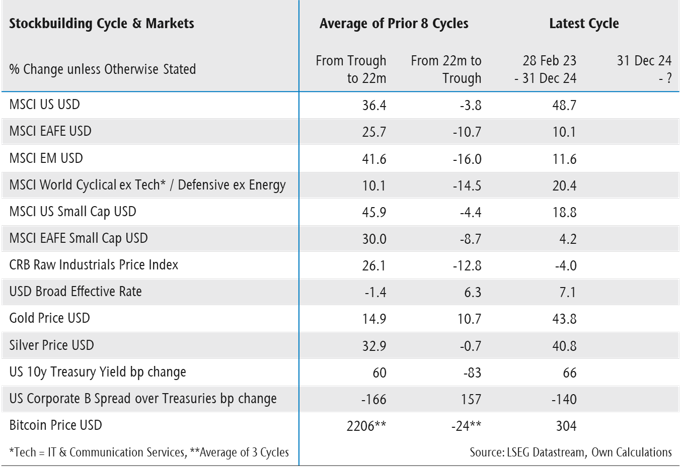
US equities, cyclical sectors, the US dollar and precious metals had outperformed relative to history, suggesting a stronger likelihood that they would lose ground between end-2024 and the next trough. Areas that had lagged and appeared to have catch-up potential included EAFE / EM equities, small caps and industrial commodities.
Table 2 updates the comparison through 11 March. The US market correction and rallies in Europe / China have narrowed the US / EAFE and US / EM performance gaps but they remain wide relative to history. Other moves in the “right” direction with apparent potential to extend include weakness in cyclical sectors, a decline in the US dollar and a rise in industrial commodity prices.
Table 2
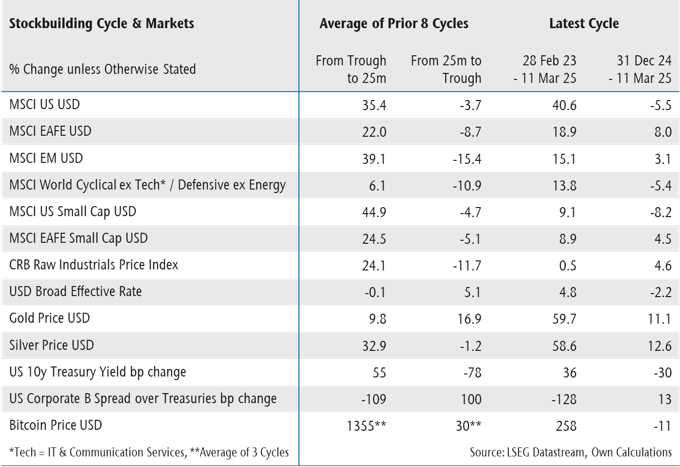
By contrast, there has been no correction of the “anomaly” of small cap underperformance, while unusual strength in precious metals has extended further.
The larger message is that, even assuming a delayed peak, the stockbuilding cycle has entered the mid to late stage that has been unfavourable for risk assets historically.