L’argent, le moteur des marchés
Global monetary update: insufficient recovery
05 juin 2024 par Simon Ward
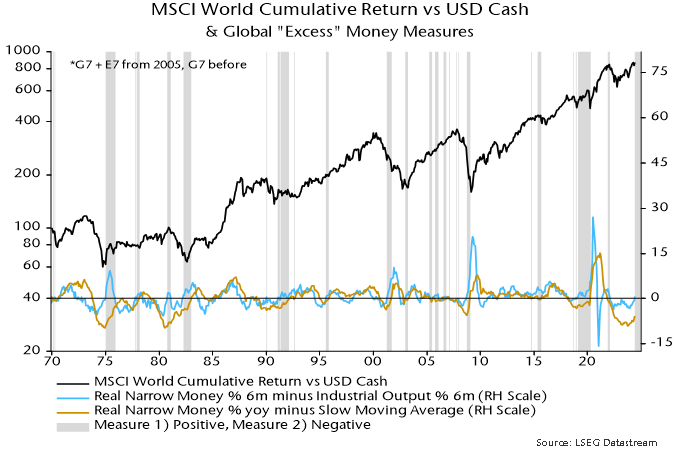
Global (i.e., G7 plus E7) six-month real narrow money momentum returned to positive territory in March, consolidating in April. It has also crossed above six-month industrial output momentum, turning one measure of global “excess” money positive – see chart 1.
Chart 1

Should investors, therefore, adopt a positive view of economic and market prospects? The judgement here is no – or at least, not yet.
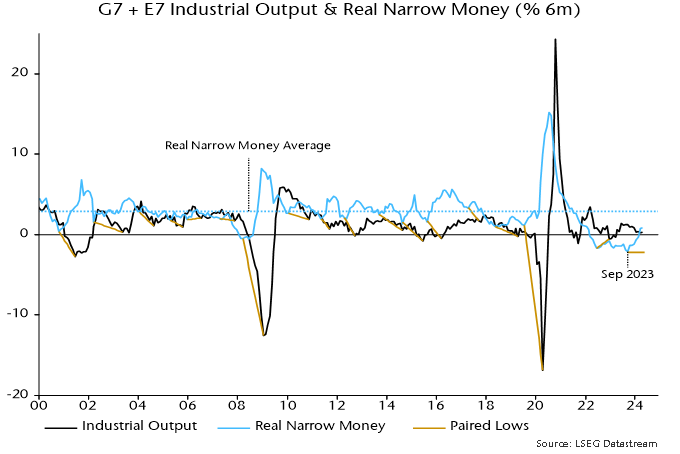
Six-month real narrow money momentum bottomed in September 2023 and lows have preceded those in industrial output momentum by between four and 14 months so far this century. This suggests that a recent decline in output momentum will bottom out by December.
The lag may be at the top end of the range on this occasion, for three reasons.
First, lags tend to be longer when real money momentum reaches extremes, and the September reading was the weakest since 1980.
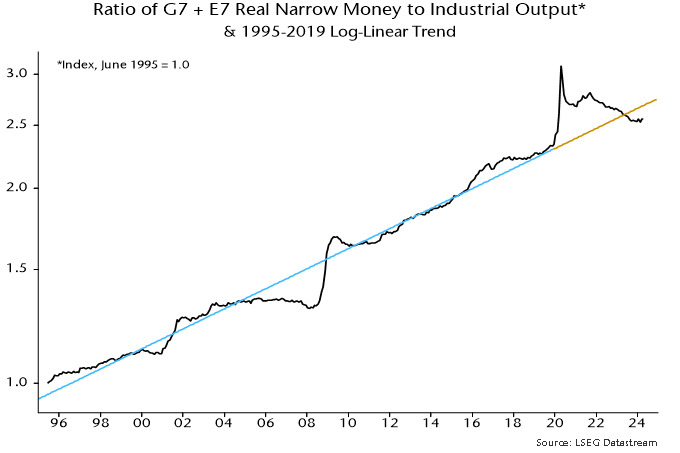
Secondly, the real money stock is below its long-run trend relationship with industrial output – chart 2. A prior overshoot cushioned the impact of a negative rate of change in 2022-23; the reverse effect could apply in 2024-25.
Chart 2

Thirdly, prior recoveries in real money momentum from negative to positive were followed by a recovery in output momentum always in the context of a positively-sloped yield curve (10-year government bond yield minus three-month money rate) – chart 3. The curve is still inverted.
Chart 3

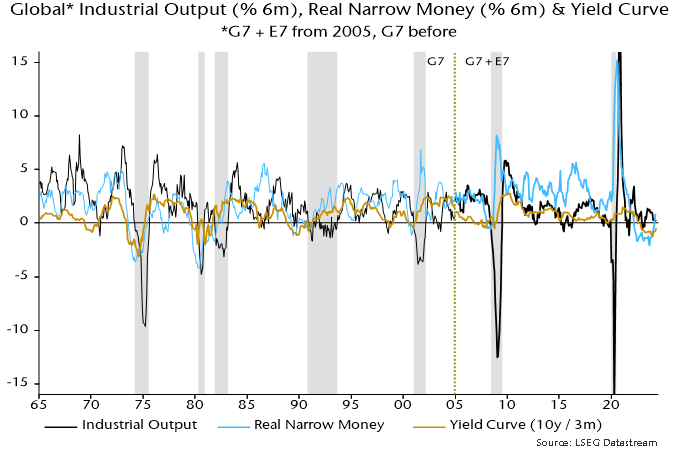
The recovery in real narrow money momentum is a hopeful signal for H1 2025 but there remains a risk of surprisingly negative economic data over the next six months. A pessimistic bias will be maintained until real money momentum returns to its long-run average and the yield curve disinverts.
The cross-over of real money momentum above industrial output momentum is similarly judged to be a necessary but not sufficient condition to adopt a positive view of market prospects.
Global equities have outperformed cash on average historically only when a positive real money / industrial output momentum gap partly reflected above-average real money expansion (measured as a 12-month rate of change). The latter condition is unlikely to fall into place before late 2024 at the earliest.
The current combination was associated with mixed equity market performance with some notably bad periods, e.g. mid-2001 and late 2008 / early 2009 – chart 4.
Chart 4