
L’argent, le moteur des marchés
Cycle update: expected 2027 weakness crystallising
17 septembre 2026 par Simon Ward
The long-standing view here has been that the 3- to 5-year stockbuilding cycle would enter a downswing in 2026, reaching a low by end-2027.
The key measure used to track the cycle is the annual change in G7 stockbuilding, expressed as a percentage of GDP. This is supplemented by a more timely indicator derived from business surveys, which displays a strong correlation with the GDP measure – see chart 1.
Chart 1
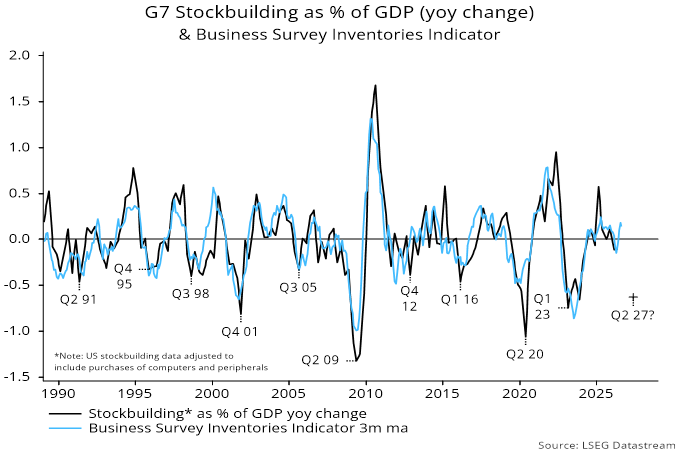
The GDP indicator last bottomed in Q1 2023, implying that the current upswing is mature, already matching the historical average duration of a whole cycle (of 3.5 years).
The GDP measure reached a level consistent with a peak in Q1 2025 but stockbuilding behaviour around that time was distorted by front-running of US tariffs. A correction over subsequent quarters has run its course, with the business survey indicator signalling a strong rebound in Q3 2026. This is supported by other evidence, e.g. the Atlanta Fed US GDP nowcast currently estimates that stockbuilding will contribute 2.0 pp to annualised Q3 growth.
The judgement here, therefore, is that the cycle is reaching a final peak in Q3 ahead of a multi-quarter downswing.
The cycle describes demand for production inputs – both raw materials and semi-manufactures, including electronic components – so is strongly correlated with their prices. A further rise in year-on-year growth of industrial commodity prices and global semiconductor sales in Q3 is consistent with the cycle reaching a peak – chart 2.
Chart 2
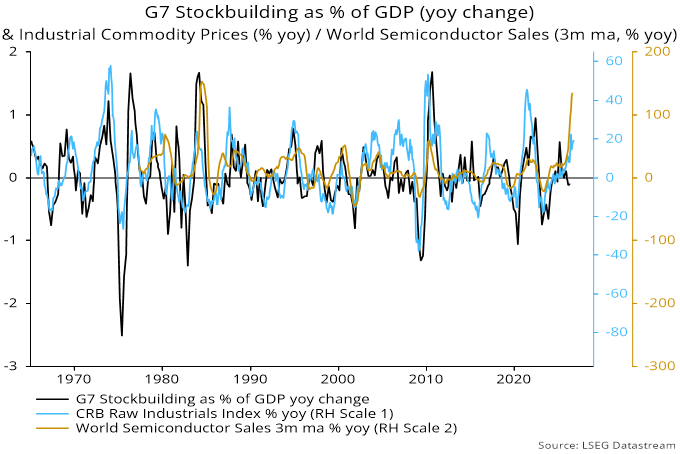
The suggestion is that the cycle about to shift from providing a tailwind to global economic momentum and pricing power to acting as a progressive headwind, with a maximum negative impact in mid-to-late 2027.
The risk of economic weakness next year is magnified by signs that a downswing in the long-term housing cycle is on track to accelerate into a 2027-28 low. The cycle has averaged 18 years historically, with the last trough reached in 2009.
The behaviour of homebuilding stocks may provide a clue to the timing of the next low. Chart 3 shows that an average of stock prices of US and UK homebuilders reached a peak 47 and 37 months respectively before lows in the last two housing cycles, in 1991 and 2009, while UK prices peaked 33 months before a previous trough in 1975.
Chart 3
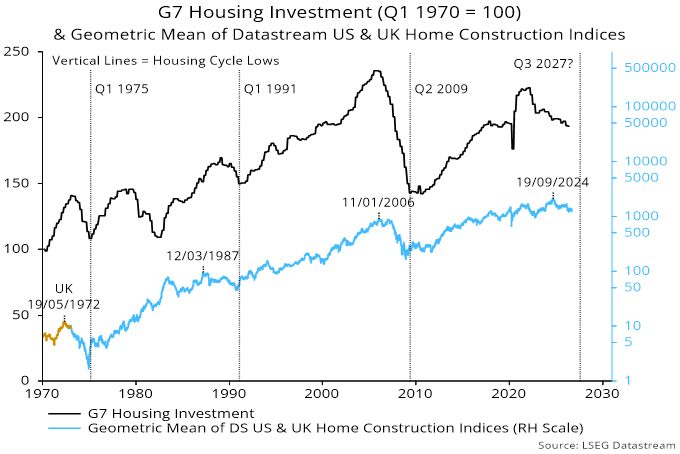
The most recent peak in the average occurred in September 2024, suggesting a cycle trough between June 2027 and August 2028.
UK homebuilding stocks broke below a 2025 low in March and have yet to regain this level. US stocks currently remain above the corresponding low; an equivalent breakdown would suggest an acceleration of the cycle downswing – chart 4.
Chart 4
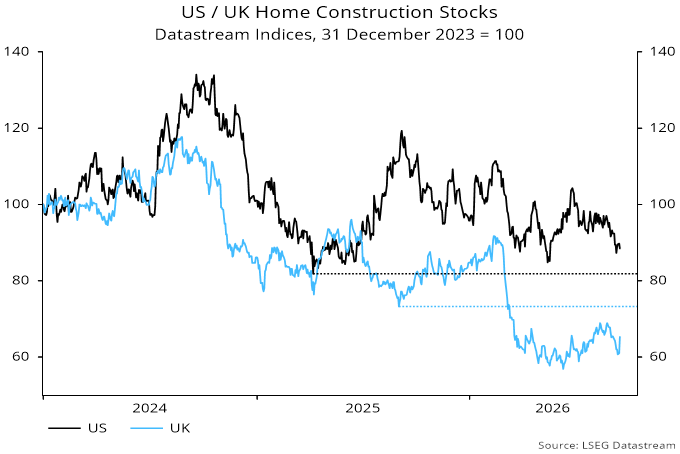
Joint weakness of the stockbuilding and housing cycles in 2027 would likely overpower and / or shorten the current business investment cycle upswing.