L’argent, le moteur des marchés
A “monetarist” perspective on UK medium-term inflation prospects
11 juin 2025 par Simon Ward
The directional signal from UK money growth is that annual core inflation – excluding policy distortions – will fall through end-2025. The level suggestion is that core will undershoot 2%. This suggestion is supported by recent exchange rate appreciation.
Turning points in annual broad money growth – as measured by non-financial M4 – have led turning points in core CPI or RPI inflation by a mean 26 months over the last c.70 years. Chart 1 highlights related troughs (gold dashed lines). (See a previous post for an equivalent chart highlighting peaks.)
Chart 1
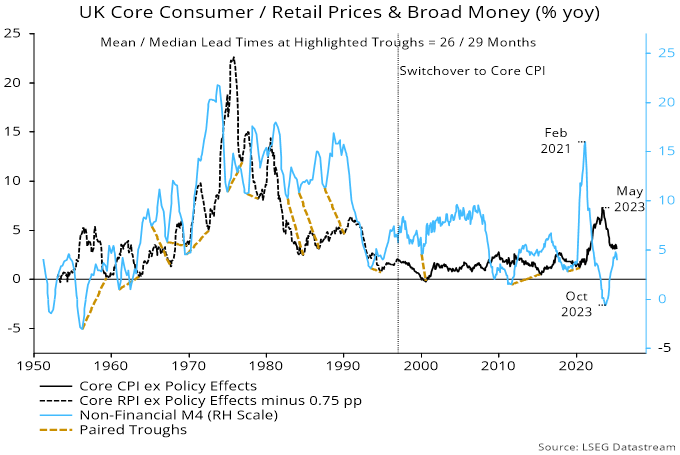
The May 2023 core inflation peak occurred 27 months after a money growth peak.
Annual broad money momentum troughed at a 67-year low in October 2023. The mean 26-month lead suggests a core inflation low in December 2025. The median lag at troughs, however, was 29 months, so an inflation low may well occur later.
Core inflation fell sharply in H2 2023 and H1 2024 but has stalled since September. The expectation here is that May numbers released next week will show a decline, possibly to below 3%. (The core measure adjusts for the imposition of VAT on school fees and above-normal increases in water / sewerage charges and vehicle excise duty.)
Annual broad money growth averaged 4.2% in the 10 years to end-2019. Core inflation averaged 1.8% in the 10 years to February 2022 (i.e. allowing for a 26-month lag in the relationship).
Annual money growth moved slightly above 4.2% in late 2024 / early 2025 but dropped back to 3.9% in April. So the levels relationship of the 2010s suggests that core inflation will fall below 2%, with no significant rebound before 2027.
Historical variations in the lag between money growth and inflation – and in the levels relationship – often reflected the influence of the exchange rate.
For example, an inflation decline into 2000 occurred earlier than suggested by monetary trends because of a strong disinflationary impact from a prior surge in the exchange rate: the effective rate rose by 26% in the two years to April 1998 – chart 2. This impact was fading by early 2000, contributing to an unusually short interval between lows in money growth and inflation (six months).
Chart 2
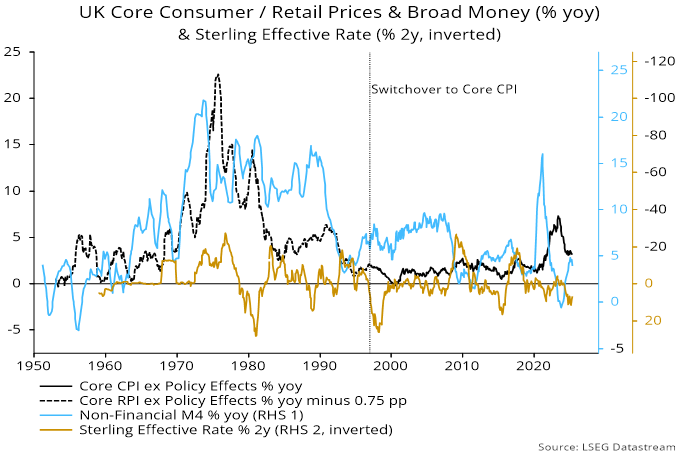
Exchange rate considerations are aligned with the monetary message currently, with a 7% rise in the effective rate in the two years to May suggesting that import prices will remain under downward pressure into 2026.