L’argent, le moteur des marchés
1969-70 replay?
23 novembre 2023 par Simon Ward
The current constellation of economic cycles resembles the late 1960s, according to the framework employed here. The similarities in terms of US interest rates and labour market trends are striking and suggest major reversals next year.
The longest cycle in the framework is the Kondratyev price / inflation cycle. Kondratyev’s research in the 1920s found evidence of “long waves” lasting about 50 years in global prices and interest rates. Chart 1 shows suggested Kondratyev peaks and troughs in US / UK wholesale price data from the late seventeenth century through WW2.
Chart 1
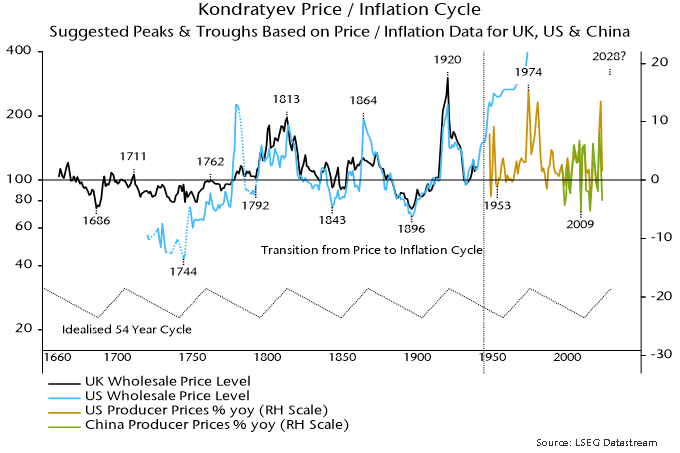
The breakdown of the gold standard in the 1930s untethered monetary expansion, resulting in the price level embarking on a secular rise. The cycle, however, remained visible in rate of change (i.e. inflation) data, with a 1974 peak occurring 54 years after the prior price level peak.
2009 fits the characteristics of a Kondratyev trough and occurred 323 years after the first identified low in 1686. There were five intervening lows, implying an average cycle length (measured from low to low) of 54 years.
Was the 2021-22 inflation spike the culmination of another Kondratyev upswing? A 2022 peak would imply an interval of 48 years from the prior high. The minimum peak-to-peak gap historically was 51 years. The suggestion is that another inflationary upsurge lies ahead, although not until the second half of the decade – current monetary weakness signals a downswing into 2025.
The 54-year cycle periodicity of the Kondratyev cycle harmonises with the average 18-year length of the housing cycle. One Kondratyev cycle, measured from peak to peak, contains three housing cycles, measured from low to low. The first housing cycle of the triad is disinflationary, the second deflationary and the third inflationary.
Chart 2 shows how the housing, business investment and stockbuilding cycles “nest” within the Kondratyev cycle, giving suggested dates for troughs of former three cycles in the previous (1920-74) and current (1974-2028?) Kondratyev cycles.
Chart 2
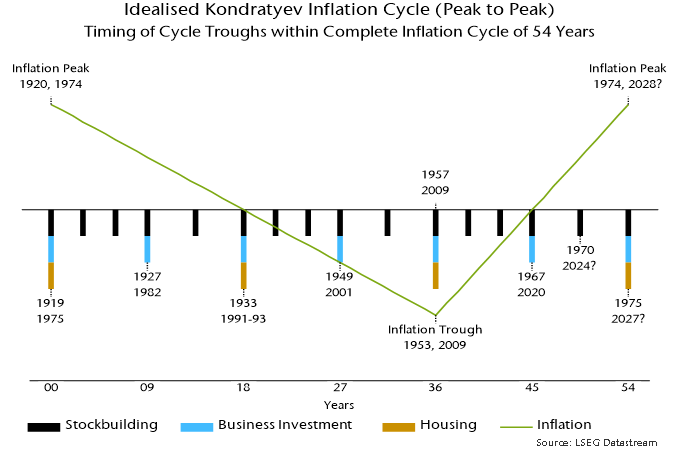
The template implies that cyclical conditions in 2023-24 mostly closely resemble 1969-70. The stockbuilding cycle was in a downswing within the final (inflationary) housing cycle since the prior Kondratyev peak.
Charts 3 and 4 compare the US Fed funds and unemployment rates with their behaviour 54 years ago. The similarities are striking. The Fed funds rate rose by a cumulative 540 bp over 1967-69, peaking in August. The increase in the current cycle has been 530 bp, with the most recent – final? – hike occurring in July.
Chart 3
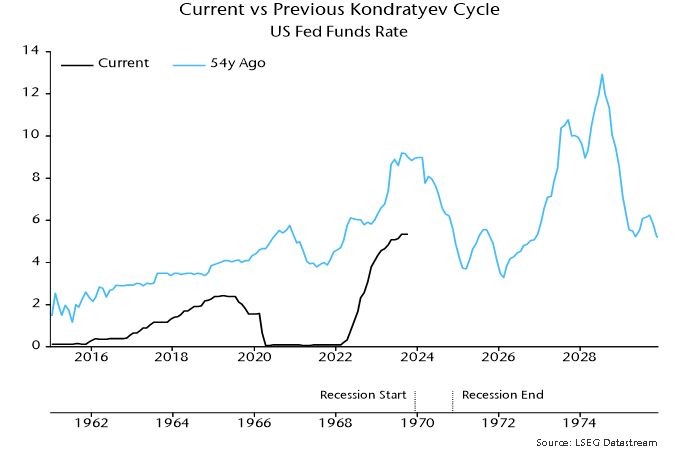
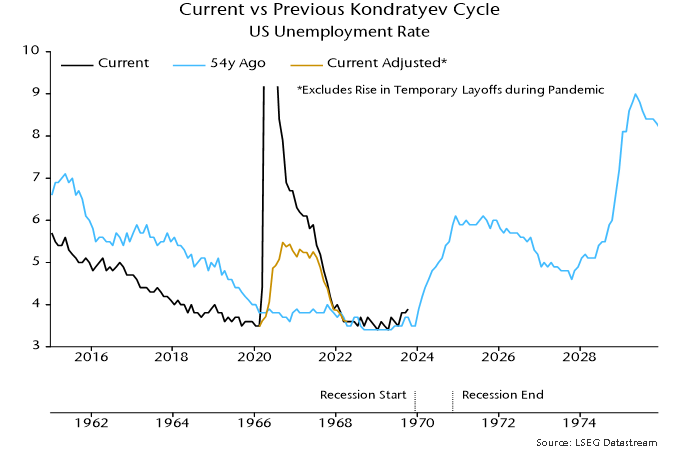
Chart 4
Monetary trends weakened sharply in 1969, causing Milton Friedman to warn of a recession, which started in December. The Fed began cutting rates in March 1970, unwinding the entire 1967-69 rise by February 1971.
The unemployment rate bottomed in the late 1960s at the same level as recently – 3.4% – and had edged up to 3.7% by October 1969 compared with 3.9% this October. It surged after the economy entered recession, peaking at 6.1% in December 1970.
The suggested takeaway is that cycle considerations support the current message from monetary trends – that recession risk remains high and a major Fed policy reversal is likely in 2024.