Strategic Exchange
To hedge, or not to hedge, that is the question
June 25, 2024 by Peter Muldowney

Institutional investors often grapple with the decision to hedge against currency fluctuations for non-domestic investments. A common concern is that currency exposure will increase the volatility of non-domestic equity returns.
This article explores when hedging is beneficial and when Canadian investors can gain from being unhedged.
Are domestic or global equities more volatile?
There is an assumption that investing outside of Canada, with exposure to various currencies and markets, can result in more volatile returns for global equities compared to Canadian equities. However, over shorter timeframes (rolling three-year returns), global equities have generally been less volatile than Canadian equities, although there have been exceptions.
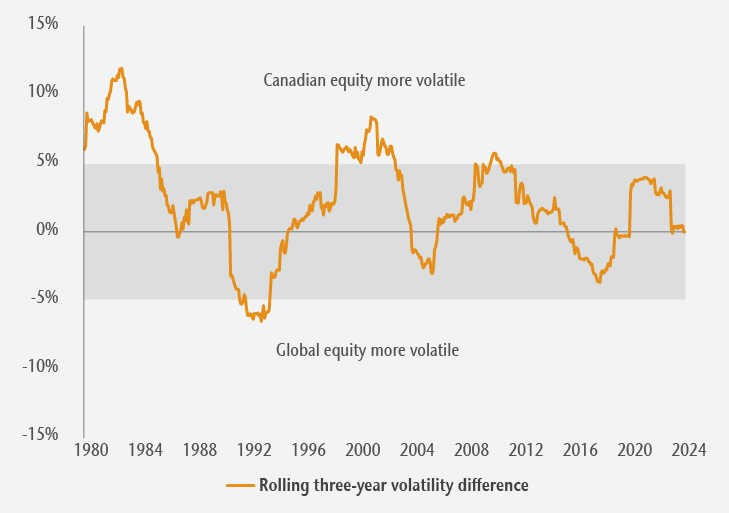
Figure 1: Canadian vs. global equity relative volatility

Source: Bloomberg and MSCI.
Figure 1 illustrates the relative volatility of returns for Canadian equities (S&P/TSX Composite Index) compared to global equities (MSCI World Index unhedged). When the orange line is above 0%, Canadian equities were more volatile; below 0%, global equities were more volatile. The chart highlights that, over short-term periods, Canadian equities have often been more volatile.
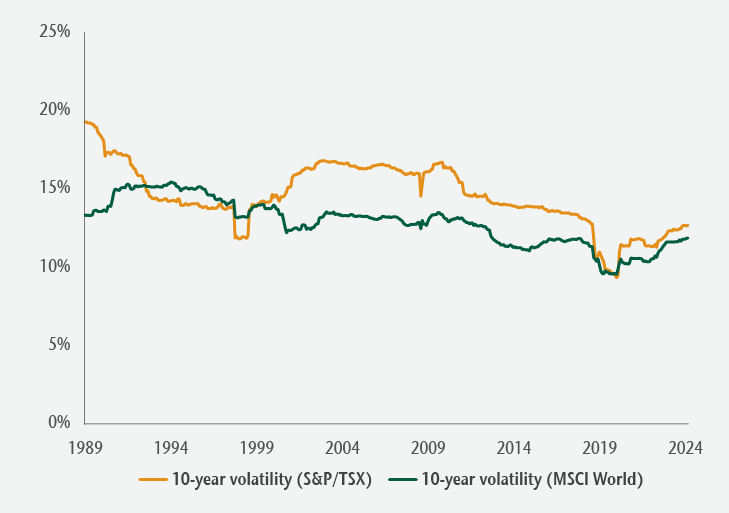
Over longer periods (10-year rolling returns) and since the late 1990s especially, global equities have almost consistently been less volatile than Canadian equities (Figure 2), benefitting from a larger and more diversified universe of investment opportunities.
Figure 2: Canadian vs. global equity absolute return volatility

Source: Bloomberg and MSCI.
Does hedging reduce global equity volatility?
Contrary to the belief that hedging is necessary to reduce volatility, historical data indicates that this is not always true.
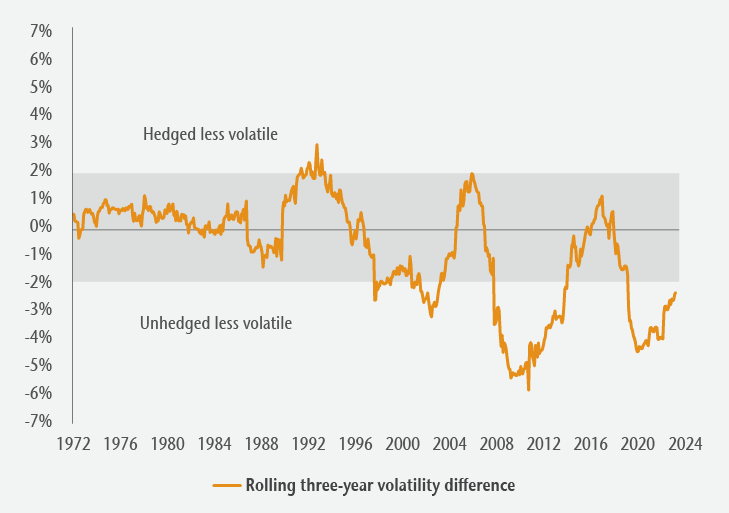
Figure 3 shows the relative volatility of hedged and unhedged global equity returns over rolling three-year periods. When the orange line is above 0%, hedged returns were less volatile; below 0%, unhedged returns were less volatile. Unhedged global equity returns have generally been less volatile, particularly since the mid-1990s, as currency movements tend to counterbalance equity returns for lower overall return volatility.
Figure 3: Hedged vs. unhedged global equities

Source: Bloomberg and MSCI.
What is the optimal currency hedge ratio?
The hedge ratio, the value of the hedge position relative to the total position value, varies by investor. If a portfolio holds $10 million in global equities and $3 million of the currency exposure is hedged, then the hedge ratio is 30%. While research often points to a 50% hedge ratio as optimal, individual decisions depend on specific currency exposure and risk perspectives. Figure 4 shows two investors with different hedging ratios, but the same net currency exposure.
Figure 4: Same net currency exposure, different hedge ratios
| Currency exposure (a) | Hedge ratio (b) | Net currency exposure (a-b) | |
|---|---|---|---|
| Investor 1 | 60% | 50% | 30% |
| Investor 2 | 30% | 0% | 30% |
Source: Bloomberg and MSCI.
From a risk management perspective, a 50% hedge ratio is sometimes used to manage “regret risk,” the potential disappointment of adopting an unhedged or fully hedged approach that later proves suboptimal.
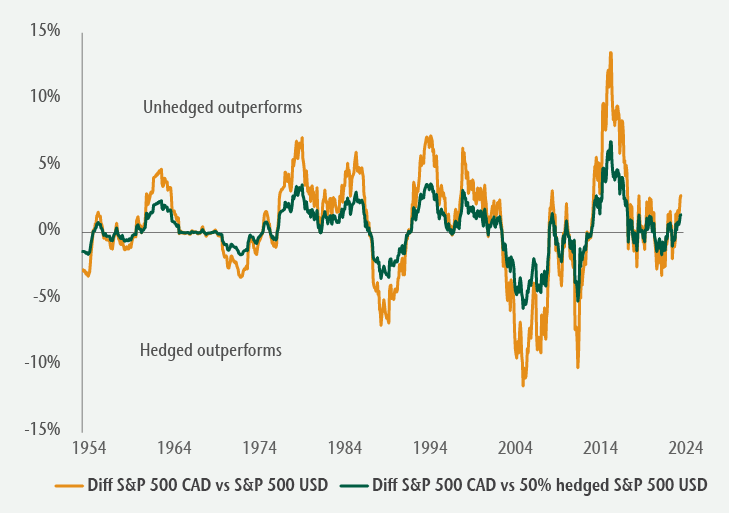
Figure 5 compares the rolling three-year performance differences between unhedged and fully hedged US equity returns (orange line) to those of unhedged and 50% hedged US equity returns (green line). When the lines are above 0%, the unhedged strategy outperformed, while the fully hedged and 50% hedge strategies outperformed when the lines fall below 0%.
Figure 5: US equity rolling 3-year relative performance

Source: Bloomberg and MSCI.
By design, the return difference for the 50% “regret risk” hedging approach (green line) was less volatile over the period. For some investors, experiencing smaller differences due to currency fluctuations may be preferred.
How should currency be managed in private markets?
There continues to be significant growth in allocations to global private markets, such as direct real estate and infrastructure assets in open-end funds. These less-liquid assets still require careful consideration of currency exposure that can affect their short-term value. Private market investors generally expect income and diversification through absolute returns, which can be materially impacts by currency fluctuation.
Hedging can manage these risks, but an assessment of each investment’s specific factors is necessary. This includes understanding the asset’s underlying revenues and expenses, potential natural hedges, hedging costs and the duration of the hedge. Matching the currency of net exposure with associated financing is also important.
For Canadian investors, relying on the private market investment manager to handle currency hedging is generally the simplest and most efficient way to manage currency risk.


