L’argent, le moteur des marchés
Will services avoid the double dip?
10 septembre 2024 par Simon Ward
The “double dip” downturn in global manufacturing continued last month.
Global manufacturing PMI new orders fell steeply from a peak in May 2021 to a trough in December 2022 (first dip), with a subsequent recovery ending in May 2024. The second dip was confirmed by a sharp fall to below 50 in July, with the index unchanged in August – see chart 1.
Chart 1

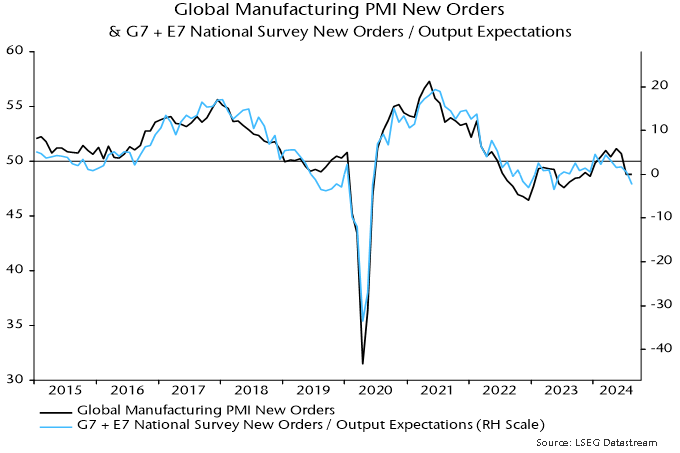
As the chart shows, an alternative global indicator based on national surveys weakened further last month.
The alternative indicator implies a shorter interim recovery between the two dips than the PMI, starting from May 2023 and ending in January 2024. These timings align better with turning points in global six-month real narrow money momentum (low in June 2022, high in December 2022) – chart 2.
Chart 2

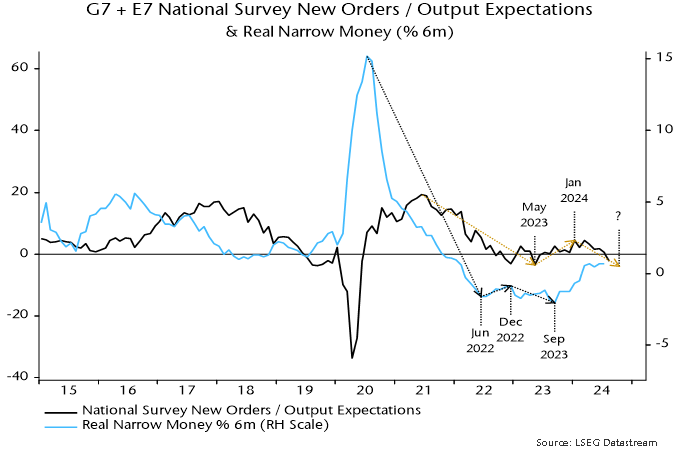
The September 2023 low in real money momentum suggests that the double dip will bottom out by end-2024.
A key issue is whether manufacturing weakness will now transfer to services.
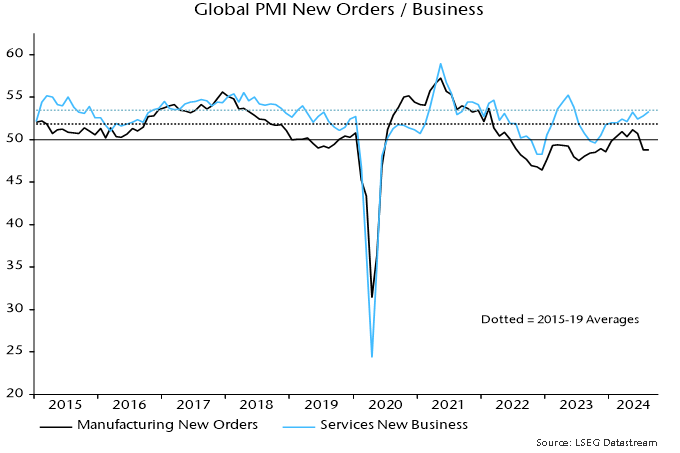
Services indicators remain mixed. The global services PMI new business index regained its May high last month and is close to the pre-pandemic average – chart 3.
Chart 3

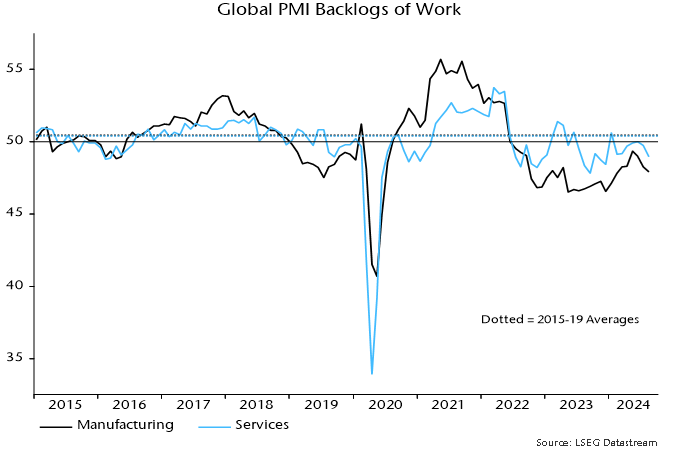
Order backlogs, however, fell further and are well below the corresponding average, as they are in manufacturing – chart 4. The decline suggests that current output is running above the (increased) level of incoming demand.
Chart 4

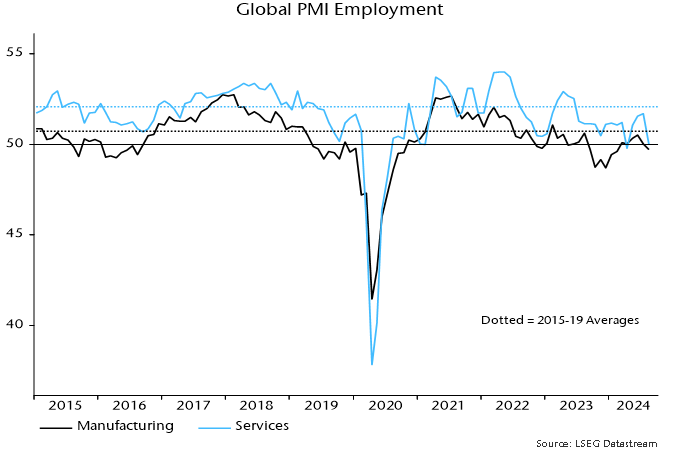
Accordingly, services firms are curbing hiring, with the sector employment index falling sharply in August and almost as weak as in manufacturing – chart 5.
Chart 5

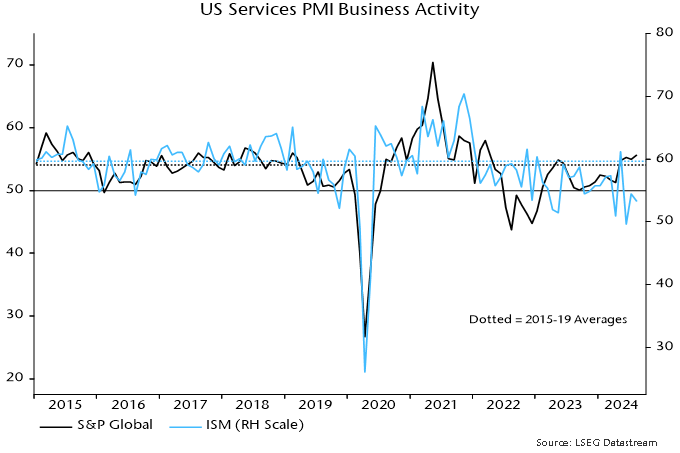
Rises in the global services PMI activity and new business indices last month partly reflected further strength in US components. The corresponding measures in the US ISM services survey are weaker, however, especially relative to pre-pandemic averages – chart 6.
Chart 6

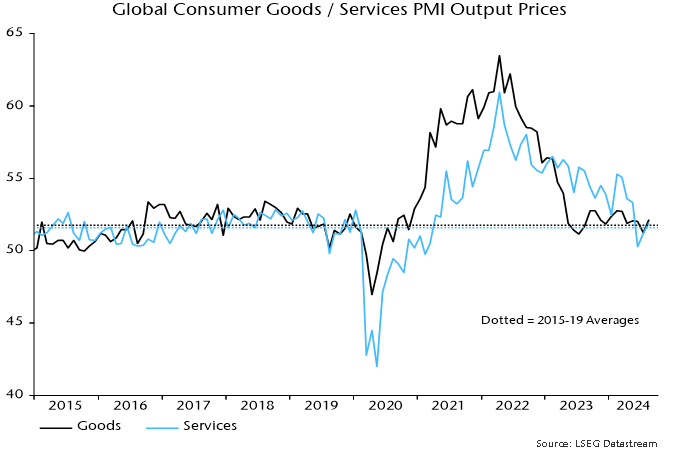
The PMI surveys continue to support the expectation here of rapid easing of services price pressures and likely inflation undershoots by H1 2025. Output price indices for consumer goods and services remain close to their 2015-19 averages, a period when G7 annual core CPI inflation averaged 1.6% – chart 7.
Chart 7