L’argent, le moteur des marchés
Why has US money growth recovered?
01 février 2024 par Simon Ward
The six-month rate of change of US broad money has recovered from negative territory in early 2023 to 3.9% annualised in December – close to an average of 4.2% over 2010-19, when economic performance was generally favourable.
Does this signal that the economy has adjusted to higher interest rates and monetary conditions are no longer particularly restrictive, in turn suggesting less need for Fed easing?
The analysis below of the “credit counterparts” to monetary expansion indicates that the recent revival has been driven by exceptionally large-scale purchases of Treasury bills by money market funds.
Such buying will fall back but its recent importance highlights a larger point. If the fiscal deficit remains at its current level (or rises further), and the Treasury continues to choose to fund a large proportion of the deficit by expanding the Treasury bill issue, the contribution of deficit financing to monetary growth is likely to be significant, even assuming no return to QE. In this scenario, a higher average level of interest rates may be necessary to constrain money growth to a pace – of perhaps 4-5% pa – compatible with trend economic expansion and on-target inflation.
On the suggestion that the recovery in money growth obviates the need for policy easing, a key point is that the effects of prior monetary restriction are still feeding through and may not be fully apparent for another year or more. Rate cuts are likely to be warranted to cushion near-term economic weakness and avert an inflation undershoot.
The numbers quoted above for US broad money expansion refer to the “M2+” measure calculated here, which adds large time deposits at commercial banks and institutional money funds to the official M2 measure. The inclusion of these items is important as they capture a significant proportion of money holdings of non-financial businesses and non-bank financial institutions. As previously discussed, US business money holdings have been rising rapidly in recent quarters, resulting in six-month momentum of M2+ diverging positively from that of M2 since late 2022, i.e. M2 is understating broad money growth at present.
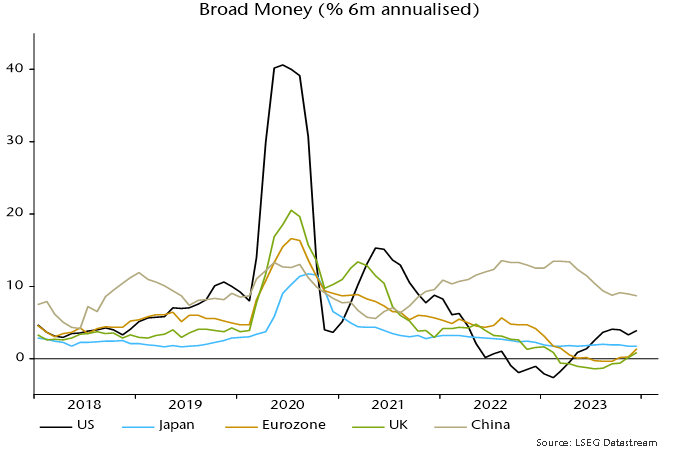
Six-month broad money momentum has recovered by much more and to a higher level in the US than in the Eurozone and UK – see chart 1.
Chart 1


The credit counterparts analysis links changes in broad money to movements in other items on the monetary sector’s balance sheet, the US monetary sector being defined as the Fed, commercial banks and other depository institutions, and money funds. The following simple formulation is used for the analysis here:
Change in broad money = monetary financing of federal deficit + change in commercial banks’ loans and leases + other counterparts (residual)
Monetary financing of federal deficit = net purchases of Treasury securities by Fed, commercial banks and money funds – change in Treasury general account balance at Fed
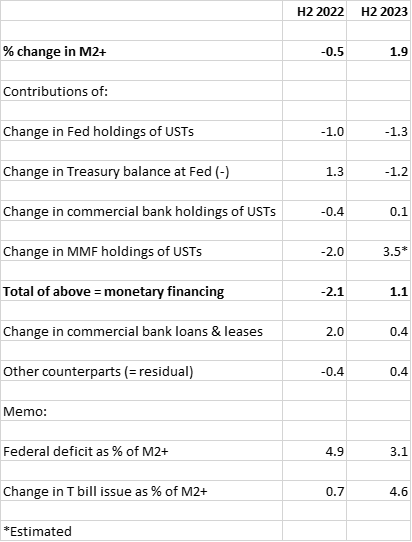
The table shows the contribution of these items to the six-month change in M2+, not annualised, in December 2022 and December 2023.


The positive swing in six-month momentum between the two periods was driven by monetary deficit financing and, in particular, a huge change in money funds’ transactions in Treasuries, from selling in H2 2022 to exceptionally large-scale buying in H2 2023.
What caused this turnaround? Following the suspension of the debt ceiling in June 2023, the Treasury issued a net $1.21 trillion of Treasury bills in H2 2023, up from $170 billion in H2 2022 and the second-highest half-year amount ever (after H1 2020).
Money funds and commercial banks are natural buyers of Treasury bills because of the maturity structure of their liabilities. The market mechanism that induced them to increase demand was a rise in Treasury bill yields relative to other short-term rates, including the emergence of a premium over the Fed’s overnight reverse repo rate.
Money funds moved $1.1 trillion out of the Fed facility during H2 2023, buying an estimated $900 billion of Treasury securities and placing the remainder (and an additional amount) in the private repo market (with those funds probably also used to buy Treasuries, suggesting further indirect monetary financing).
Money funds’ Treasury buying is likely to slow dramatically in H1 2024, for two reasons. First, expansion of the Treasury bill issue will be scaled back to $200 billion (from $1.21 trillion in H2 2023), according to refunding plans. Secondly, money funds’ balance in the Fed facility was down to $800 billion at end-2023 (from $2.3 trillion a year earlier), with a further decline in early 2024. The rate of Treasury bill purchases will plausibly slow as the balance approaches exhaustion.
It would, however, be misleading to suggest that purchases of Treasuries by money funds and banks face a constraint in terms of the availability of investible resources. The first-round effect of the fiscal deficit is to swell the broad money stock, i.e. it creates the liquidity necessary to absorb associated debt issuance. If new Treasuries are sold to non-banks, the monetary boost is reversed. If, alternatively, money-holders choose to retain their higher balances, banks and money funds have additional funds with which to buy Treasuries. The money creation due to the deficit then remains unsterilised.
How large a boost could this private form of monetary financing give to broad money growth over the medium term? The federal deficit was $1.78 trillion in calendar 2023, equivalent to 6.5% of GDP and 6.8% of the M2+ stock at end-2022. Suppose that 1) the deficit remains stable as a proportion of the money stock, 2) it is half-financed via Treasury bills and 3) money funds and banks take up half of the issued bills. Assuming no QE / QT and a stable Treasury balance at the Fed, monetary deficit financing would contribute 1.7 pp to annual M2+ growth.
For comparison, Treasury buying by money funds and banks contributed 0.6 pp to average annual growth of M2+ over 2010-19.
Suggested conclusions are: 1) prior monetary weakness will be the dominant influence on economic developments over the next few quarters; 2) the recovery in broad money growth is likely to stall in H1 2024; and 3) a persistent large fiscal deficit could cause funding indigestion and force a renewed increase in reliance on bill financing (or, in the extreme, a resumption of QE), in turn posing an upside risk to medium-term money growth and inflation.


