L’argent, le moteur des marchés
UK inflation: it’s getting complicated
13 février 2025 par Simon Ward
The Bank of England expects rises in regulated prices and taxes to push headline CPI inflation up to 3.5% by June but the forecast likely underestimates disinflationary pressure from monetary weakness.
The near-term inflation outlook globally is subject to cross-currents. Earlier monetary weakness is bearing down on underlying pressures but the position of the stockbuilding cycle suggests a rise in commodity prices: the cycle appears to be mid-upswing and industrial commodity prices typically climb into the peak – see chart 1.
Chart 1
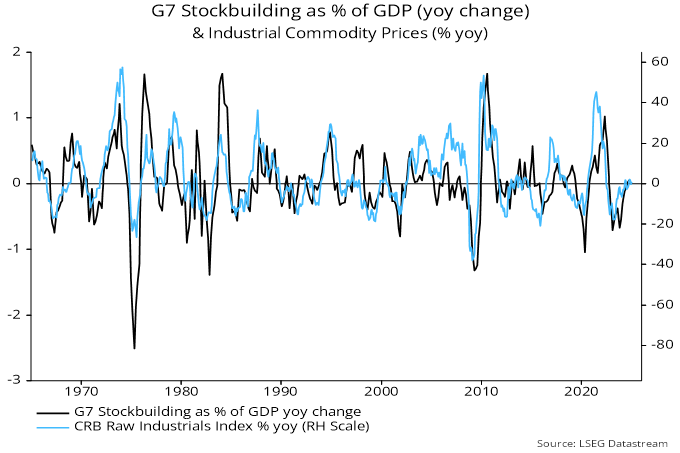
Higher tariffs, meanwhile, will have a one-off direct impact on measured prices and indirect effects via increased costs and supply disruption.
The UK near-term inflation profile is being additionally boosted by the imposition of VAT on school fees and large rises in some regulated prices. The Bank of England estimates that changes in the energy price cap will lift annual CPI inflation by 0.6 pp between December 2024 and June 2025, with the VAT effect and rises in regulated prices – including an average 26% increase in water bills – adding a further 0.45 pp.
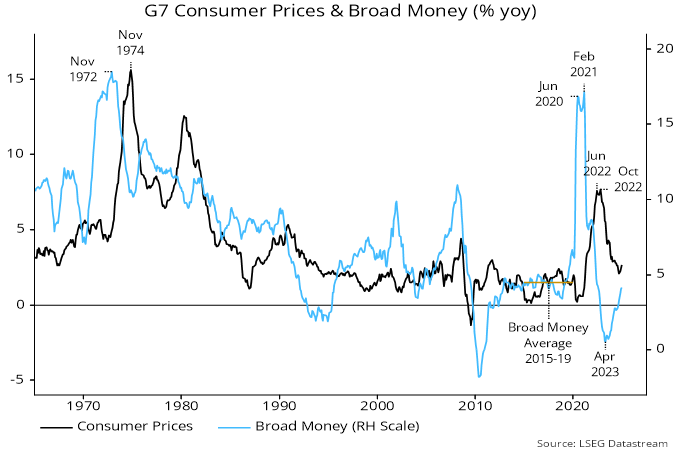
Central banks, including the MPC, worry that a near-term inflation bump due one-off influences will dislodge expectations and become embedded. Monetarists argue that ample money growth is required for such “second-round” effects to emerge. G7 annual broad money growth continues to recover but is currently still below its pre-pandemic (i.e. 2015-19) average, which was associated with below-target headline and core inflation averages – chart 2. The same is true in the UK.
Chart 2
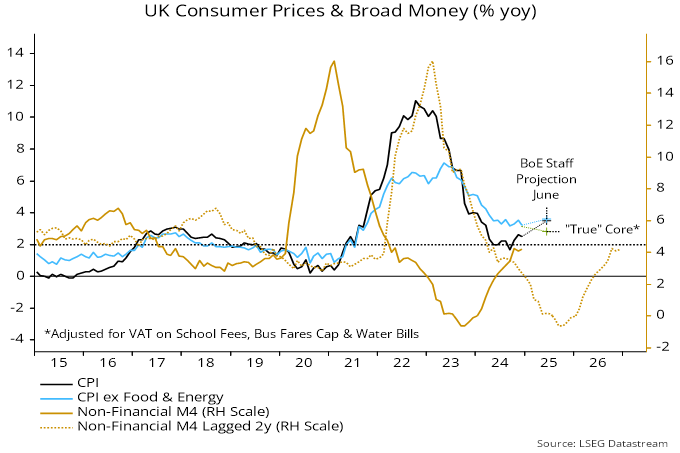
Coming UK inflation numbers will require careful interpretation. The conventional core rate – excluding energy, food, alcohol and tobacco – will overstate underlying pressures because of the above policy effects. A “true” core measure should, at a minimum, exclude the impact of the VAT change and rises in bus fares and water bills.
The Bank of England staff forecast implies a rise in the conventional core rate from 3.2% in December 2024 to 3.6% by June 2025. Calculations here suggest that this would be consistent with the above “true” core measure slowing from 3.2% to 2.8% over the same period – chart 3.
Chart 3
The monetarist rule of thumb of a roughly two-year lag between monetary and price developments suggests strong downward pressure on underlying inflation in 2025. “True” core inflation may fall by significantly more than the Bank expects.
Charts 4 and 5 show a long-term history of annual broad money growth and an adjusted core inflation measure (based on RPI rather than CPI in earlier years). The charts respectively highlight paired peaks and troughs in the series. The mean and median lags at all the highlighted turning points were 26 and 28 months, i.e. slightly longer than posited by the rule of thumb. With broad money growth bottoming in October 2023, the suggestion is that a downtrend in underlying inflation could extend into early 2026.
Chart 4
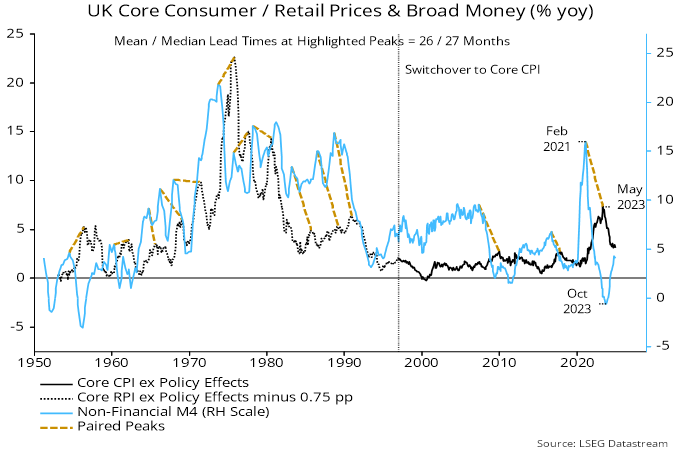
Chart 5
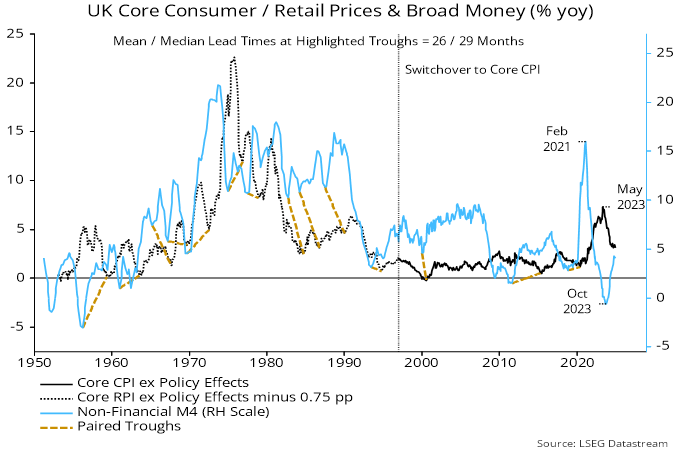
The historical variability of the money growth / inflation lag in the UK mainly reflects the influence of the exchange rate. The favourable assessment of underlying inflation prospects above is conditional on avoidance of significant sterling depreciation.