L’argent, le moteur des marchés
Slowdown signals
09 décembre 2025 par Simon Ward
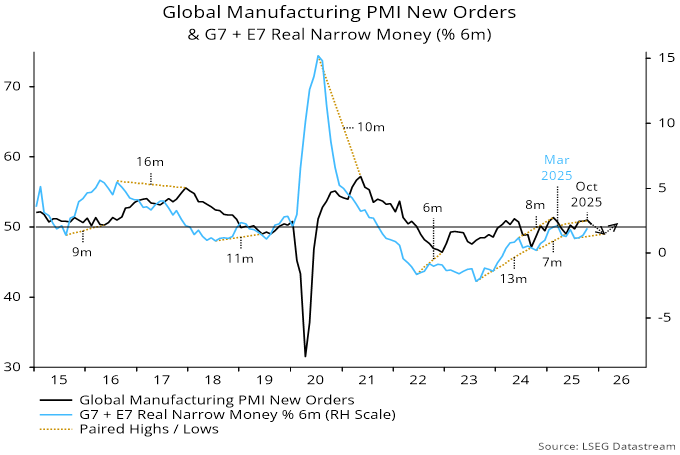
Global manufacturing PMI new orders fell back in November, consistent with the forecast here of an inflection weaker from late 2025, based on a slowdown in six-month real narrow money momentum from a March peak – see chart 1.
Chart 1
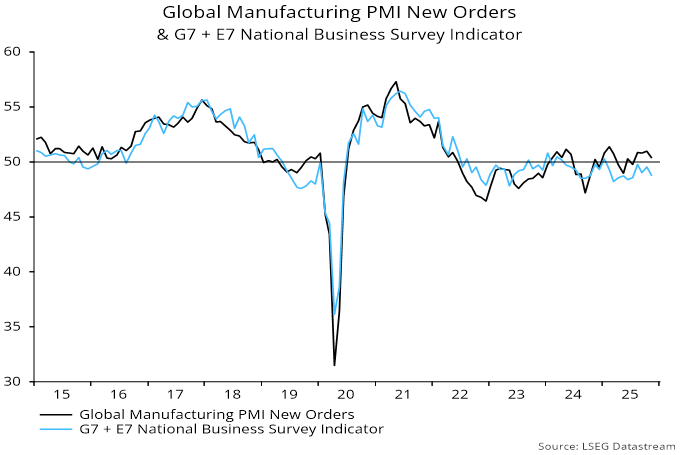
The PMI decline was mirrored by an alternative global survey indicator derived from national polls. The alternative indicator has been undershooting the PMI recently, reflecting relative weakness in the US ISM and Chinese NBS surveys compared with their S&P Global counterparts – chart 2.
Chart 2
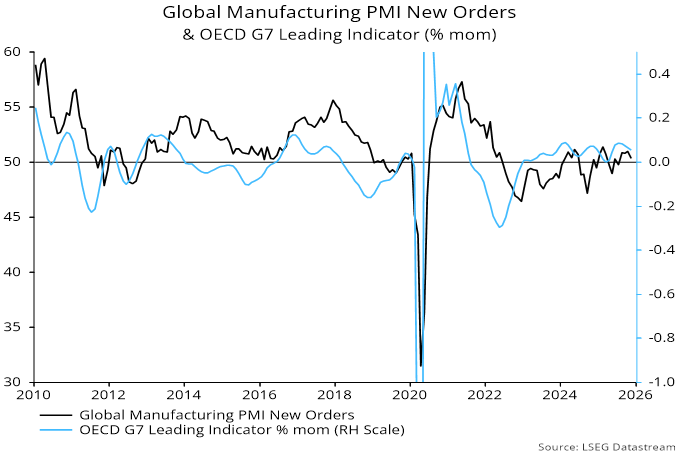
The suggestion of a turning point is supported by the OECD’s G7 composite leading index. The one-month change in the index usually moves ahead of the PMI and peaked in July, easing further in November. The slowdown, however, has been minor and numbers can be revised – chart 3.
Chart 3
A recovery in real money momentum since July suggests a PMI low around end-Q1. Still, approaching downswings in the stockbuilding and housing cycles argue against a sustained rebound.
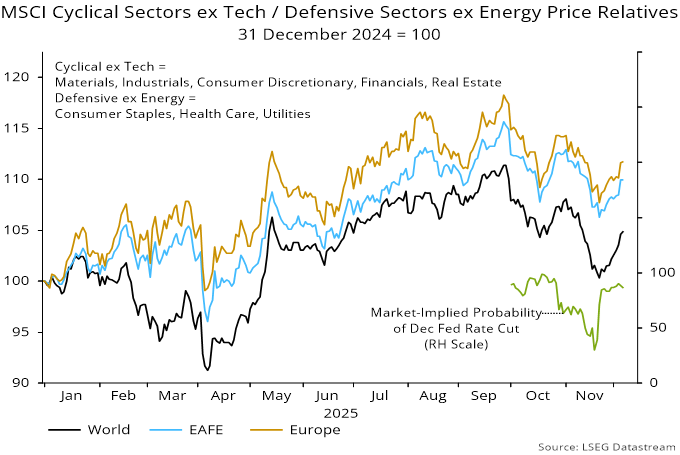
PMI swings are typically mirrored by the price relative of cyclical equity market sectors (excluding IT and communication services) versus defensive sectors (excluding energy). Relatives peaked in September, consistent with the October PMI high, but have rallied with rising Fed rate cut expectations – chart 4. A further PMI decline into late Q1 could be associated with renewed underperformance.
Chart 4