L’argent, le moteur des marchés
Global money growth stall extends as PMIs soften
26 juillet 2024 par Simon Ward
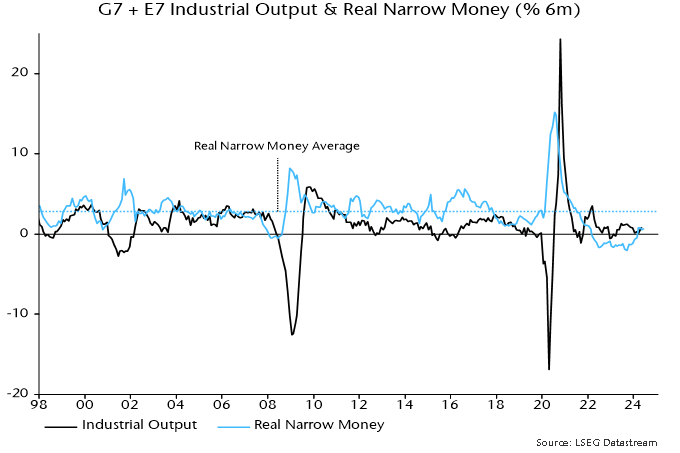
Global six-month real narrow money momentum – a key indicator in the forecasting process followed here – is estimated to have moved sideways for a third month in June, based on monetary data covering 85% of the aggregate.
Real money momentum has recovered from a September 2023 low but remains below both its long-run average and the average in the 10 years preceding the GFC, when short-term interest rates were closer to recent levels – see chart 1.
Chart 1

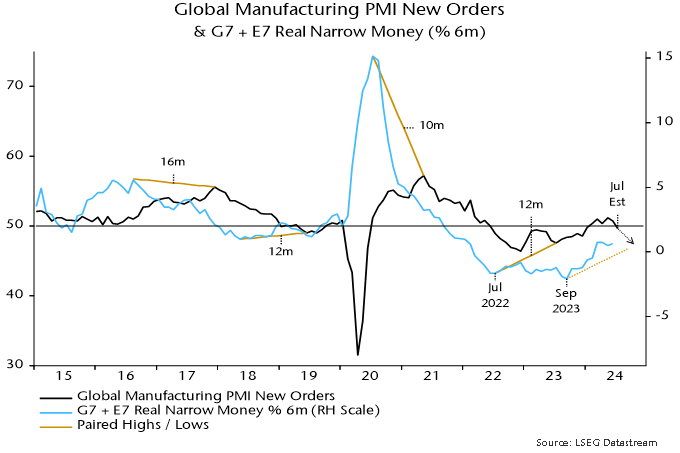
The expectation here has been that the fall into the September 2023 low would be reflected in a weakening of global industrial momentum into late 2024. DM flash PMI results for July support this forecast, implying a fall in global manufacturing PMI new orders from 50.8 in June to below 50, assuming unchanged readings for China / EM.
Chart 2

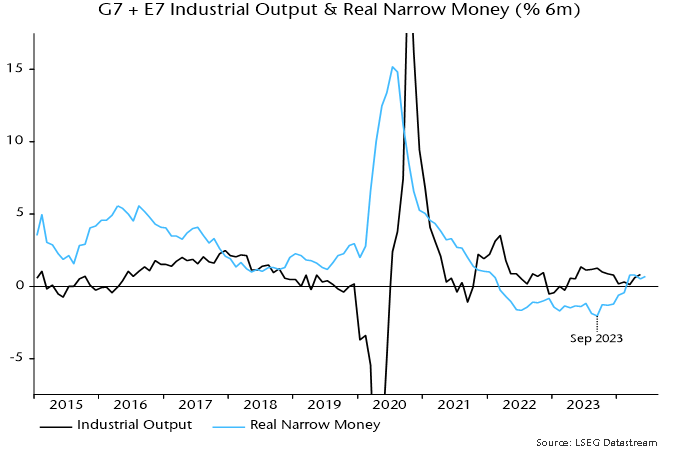
The stalling-out of real money momentum at a weak level suggests that economic expansion will remain sub-par in early 2025.
Global six-month industrial output growth, meanwhile, recovered in April / May, crossing back above real money momentum – chart 3. The implied negative shift in “excess” money conditions may partly explain recent market weakness / rotation.
Chart 3

Global six-month real narrow money momentum was held back in May / June by weakness in China and Japan, discussed in recent notes. A US slowdown is a risk going forward.
A note in February argued that expansionary deficit financing operations – “Treasury QE” – have more than offset the monetary drag from Fed QT. Specifically, the Treasury relied on running down its cash balance at the Fed and issuing Treasury bills to fund the deficit in H2 2022 and 2023. The former represents a direct monetary injection while bill issuance is likely to expand broad money because bills are mostly purchased by money funds and banks. (A recent paper from Hudson Bay Capital makes a similar point, referring to variations in the maturity profile of debt sales as “activist Treasury issuance”.)
The February article and an update in May, however, noted that Treasury financing estimates implied that the six-month running total of Treasury QE would slow sharply in Q2 and turn negative in Q3. With Fed QT continuing, albeit at a slower pace, the joint Treasury / Fed impact on broad money was on course to become significantly contractionary.
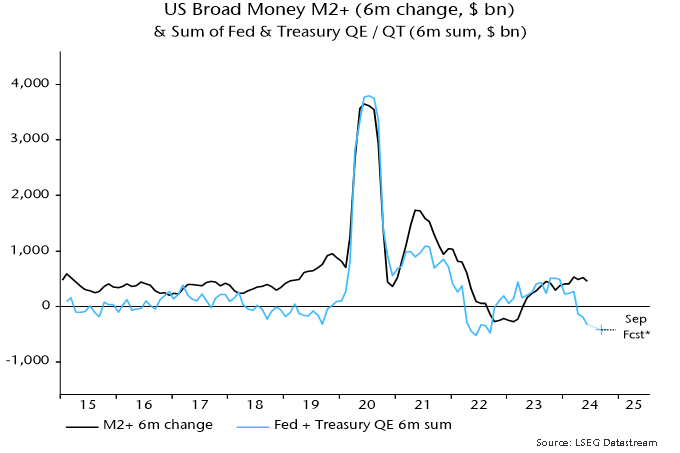
Treasury QE has fallen as expected and the joint contribution has become negative – charts 4 and 5. Six-month broad money momentum has yet to slow significantly, although three-month growth in June was the weakest since November. Money momentum lagged when the joint impact swung from negative to positive in late 2022 / early 2023.
Chart 4

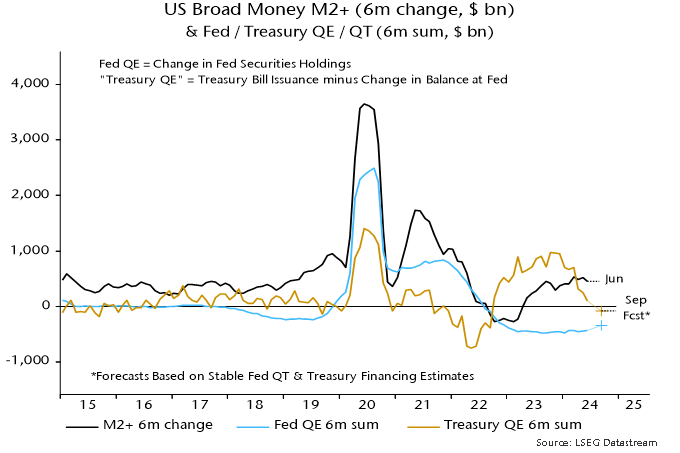
Chart 5

The approach here places greater weight on narrow than broad money for short-term forecasting. A US broad money slowdown, in theory, could be accompanied by stable or stronger narrow money expansion, for example if rising confidence leads to an increase in broad money velocity, with an associated portfolio shift into demand deposits. Such a scenario, however, is less likely the longer the Fed delays significant rate cuts.
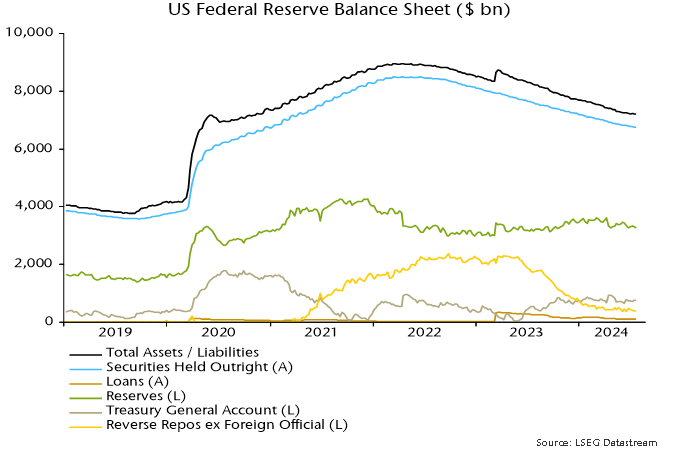
The slowdown in Treasury QE explains a reversal lower in US bank reserves since April – chart 6. The prior rise in reserves, despite ongoing Fed balance sheet contraction, occurred because money funds were moving funds out of the overnight reverse repo facility in order to buy newly-issued Treasury bills, with the Treasury reinjecting the cash via the deficit.
Chart 6

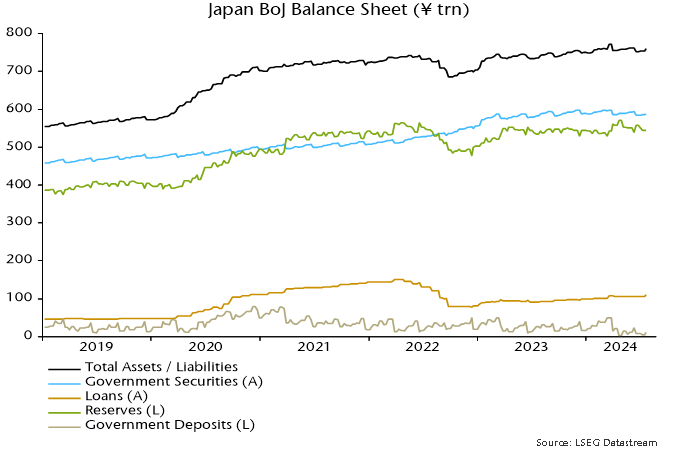
Japanese bank reserves are also on course to fall as the BoJ embarks on QT – chart 7. Market speculation is that the MPC will announce a reduction in gross JGB purchases to ¥3 trn per month at next week’s meeting, from an average ¥5.7 trn in H1. With redemptions averaging ¥6.5 trn over the last year, this suggests monthly QT of ¥3.5 trn ($23 bn), equivalent to 2.6% of broad money M3 at an annualised rate.
Chart 7