L’argent, le moteur des marchés
Contradictory Fed
26 mars 2025 par Simon Ward
The Fed’s economic forecasts are inconsistent with the suggestion of a 50 bp cut in rates by year-end, according to a model of its historical behaviour.
The model assesses the probability of the Fed being in tightening or easing mode in a particular month based on currently reported and lagged values of core PCE inflation, the unemployment rate and the ISM manufacturing delivery delays indicator. Despite the small number of inputs, the model does a satisfactory job of “explaining” the Fed’s past actions – see chart 1.
Chart 1
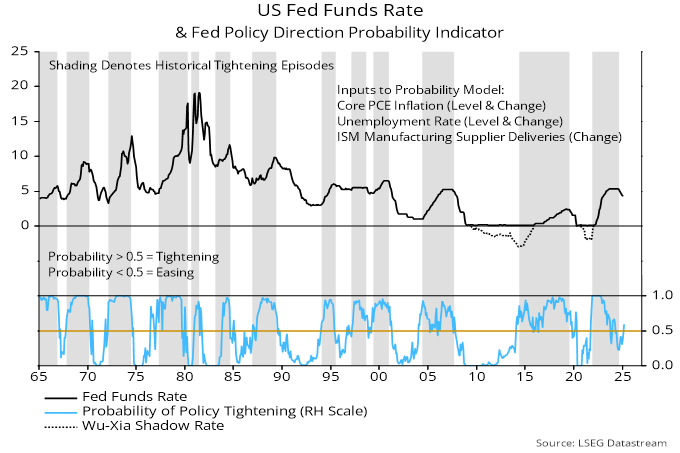
The model predicted that the Fed would hold in March with a slight tightening bias – the probability reading rose to just above the 0.5 neutral level, having previously been in the easing zone.
The FOMC median projections for core PCE inflation and the unemployment rate in Q4 2025 were raised to 2.8% and 4.4% respectively this month, from 2.5% and 4.3% in December. Assuming a smooth progression to these values, the model signals a greater chance of tightening than easing over the remainder of the year – chart 2.
Chart 2
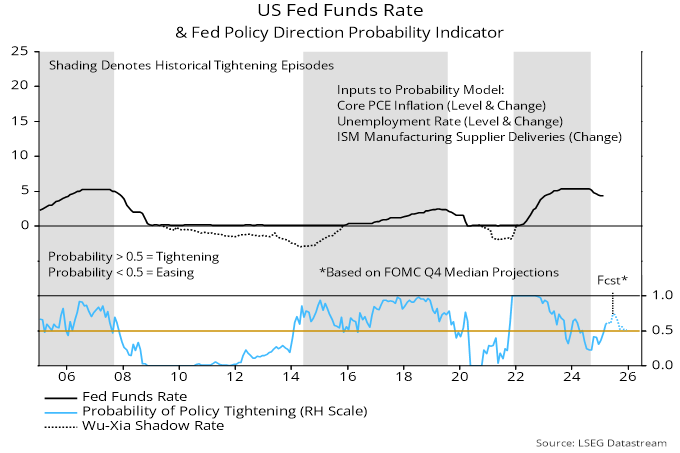
The suggestion is that inflation and / or labour markets news will need to surprise significantly to the downside to warrant the 50 bp cut in rates by year-end implied by the median dot.
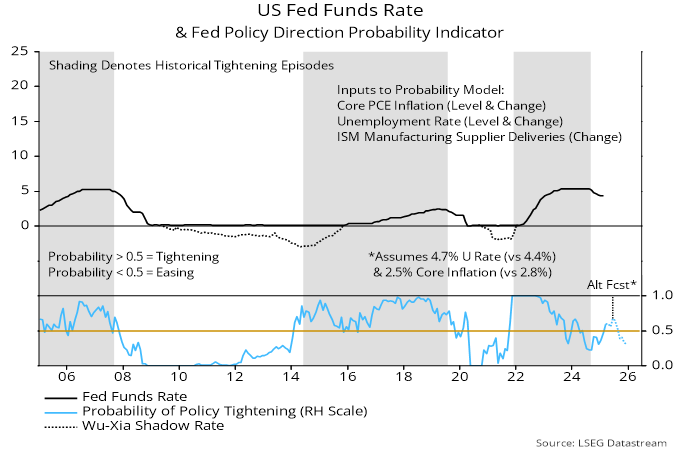
Chart 3 shows the model prediction in an alternative scenario in which the unemployment rate and core inflation move to 4.7% and 2.5% in Q4. The probability reading remains above 0.5 into the summer but falls back into the easing zone at end-Q3.
Chart 3
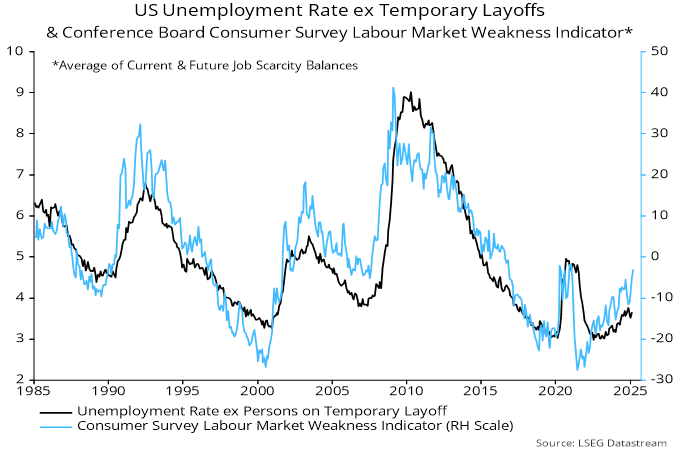
The Fed’s projection of a 4.4% unemployment rate in Q4 implies only a 0.17 pp rise relative to a recent (November) high. An indicator of labour market weakness from the Conference Board consumer survey rose further in March and is almost back to its January 2021 level, when the jobless rate excluding temporarily laid-off workers was more than 1 pp higher than now – chart 4.
Chart 4