L’argent, le moteur des marchés
Are global monetary “buffers” exhausted?
21 octobre 2025 par Simon Ward
The global money growth surge of 2020-21 resulted in a monetary overhang, which limited economic damage when money trends subsequently slumped in 2022-23, as well as providing fuel for a prolonged bull market in risk assets.
So how much is left in the monetary tank?
One approach is to compare the ratio of the money stock to nominal GDP with its longer-term trend. This has two major drawbacks – it ignores the dependence of money demand on wealth as well as income, while the trend is left unexplained.
An alternative approach is based on the “quantity theory of wealth”. This posits that a given percentage change in the (broad) money stock is reflected in an equal percentage change in the geometric mean of nominal GDP and gross wealth.
The conventional quantity theory states that monetary expansion will lead to some combination of increased output and higher prices of goods and services to restore equilibrium.
The modified theory allows for asset prices (and stocks of assets) to bear part of the burden of adjustment. The modified approach fits US long-term historical data without requiring the assumption of an unexplained trend.
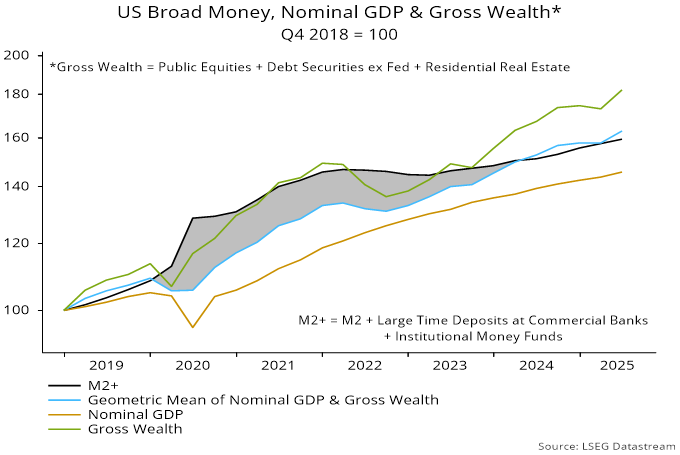
Charts 1-3 below apply this idea to US, Japanese and Eurozone data since the end of 2018, implicitly assuming that money stocks were in equilibrium with nominal income and wealth at that date. The gap (shaded) between the paths of the money stock and the combined income / wealth variable is an estimate of the monetary overhang. The individual paths of nominal GDP and wealth are also shown for comparison.
The rise in the money stock has been reflected in a larger increase in wealth than income in all three cases.
In the US, the suggestion is that the monetary overhang was eliminated in Q1 2024. Broad money and nominal GDP have grown at the same pace since then (a cumulative 6% through Q2 2025), with wealth rising faster (12%), driven by the equities component (19%) – chart 1.
Chart 1
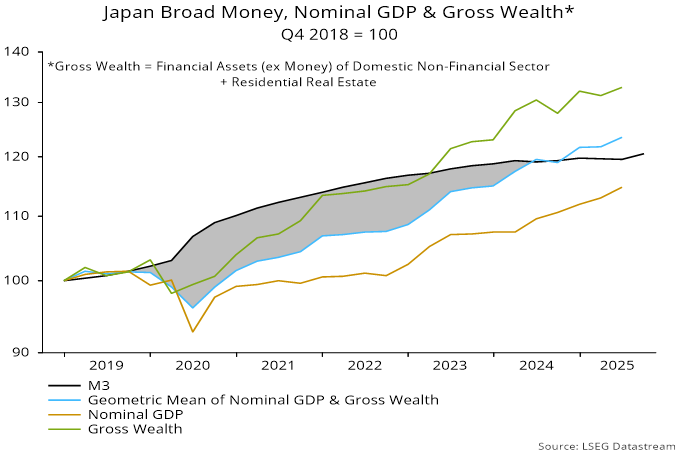
The Japanese overhang is estimated to have been removed one quarter later, in Q2 2024. Broad money has barely grown since then, while nominal GDP has outpaced wealth (5% versus 2% increase through Q2 2025) – chart 2.
Chart 2
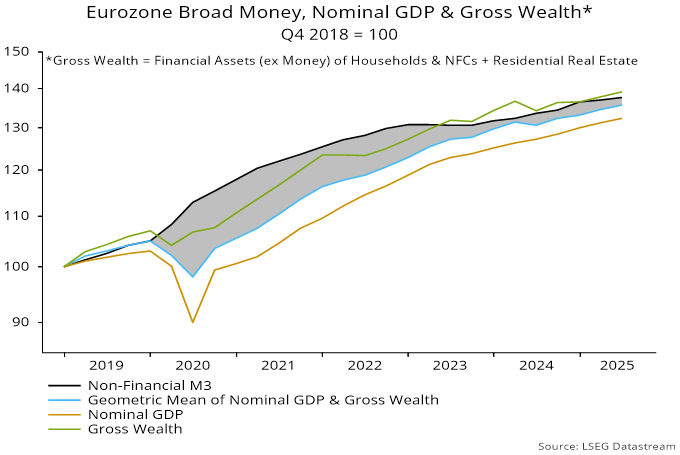
In contrast to the US and Japan, a small monetary overhang is estimated to have persisted in the Eurozone. Nominal GDP and wealth grew similarly in the year to Q2 2025 (4%), slightly outpacing money (3%) – chart 3.
Chart 3
The suggestion is that there is no major misalignment between current money stocks and levels of nominal income and asset prices in the three economies. A stock overhang is no longer acting as a tailwind for economic activity and markets but nor is there a significant monetary deficiency.
The monetary environment, in other words, has normalised, suggesting a re-anchoring of economic / market prospects to money growth and underlying cycles.