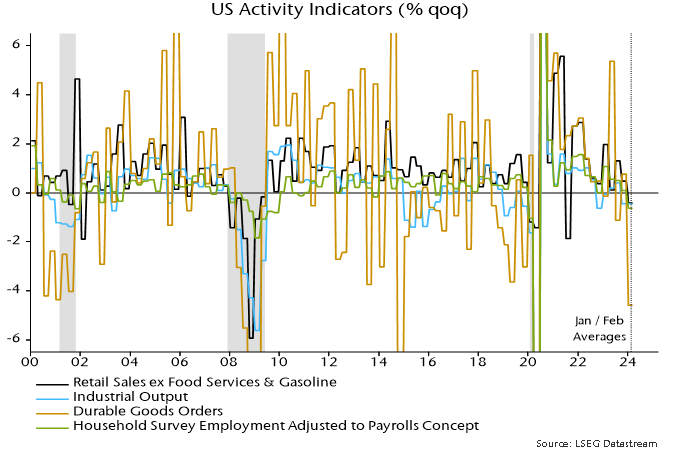
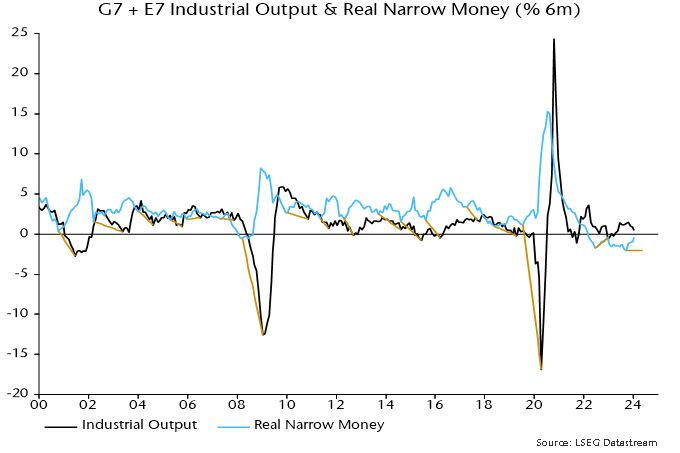
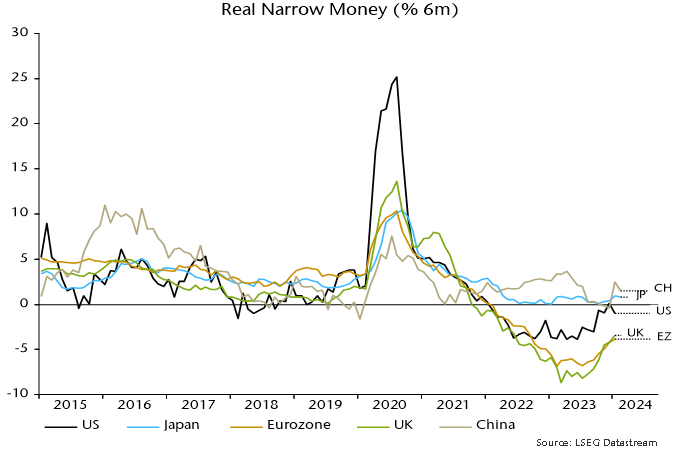
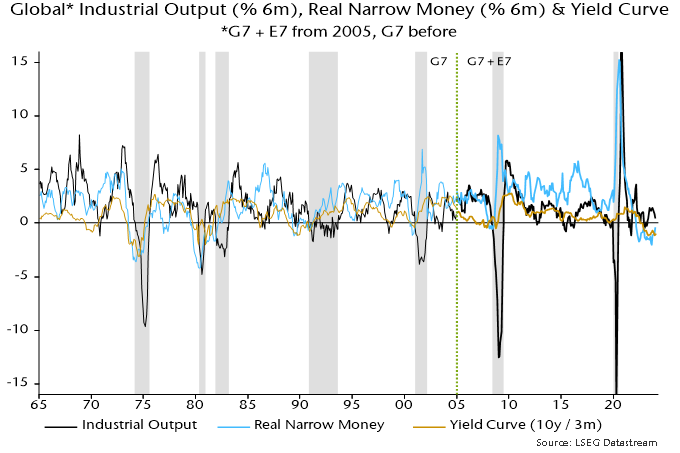
UK real money contraction warned of 2022 economic stagnation and 2023 recession. Weakness has abated but real money measures have yet to resume expansion, casting doubt on hopes of a sustainable economic recovery.

The latest ONS numbers are consistent with a recession having started in Q2 2023. Among key features of the GDP release:

  • Gross value added (GVA) at basic prices peaked in Q1 2023, falling by 0.03% in Q2, 0.16% in Q3 and 0.34% in Q4.
  • The cumulative decline in GVA / GDP of 0.5% between Q2 and Q4 is inconsistent with a description of the economy as “flatlining”.
  • Similarly, claims that the consumer has been holding up are no longer tenable given a 1.0% cumulative contraction in household consumption between Q2 and Q4.
  • GDP / GVA fell by 0.2% and 0.3% respectively in the year to Q4, meeting a stronger recession definition than the two-quarter rule (in contrast to Japanese GDP also released today).
  • Nominal as well as real GDP fell in Q4, with the GDP deflator rising at a 2.0% annualised pace between Q2 and Q4.

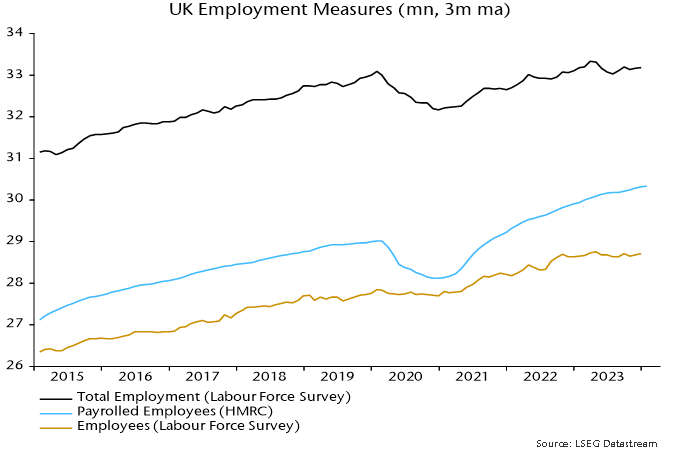
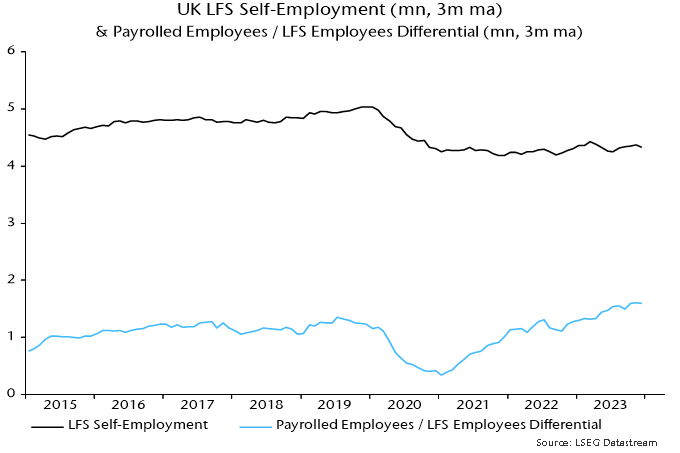
The suggestion of cyclical peak in Q1 2023 is supported by the LFS employment measure, which reached a high in the three-month period centred on March. (The LFS aggregate is 10% larger than the PAYE employment series, reflecting coverage of self-employment.) Aggregate hours worked also peaked then, falling 1.5% through November.

Real money measures began to contract in H2 2021. GDP stagnated from Q2 2022, consistent with the usual lag. The six-month rates of decline of real narrow and broad money reached a peak in March 2023, warning of H2 economic contraction – see chart 1.

Chart 1

Chart 1 showing UK GDP & Real Narrow / Broad Money (% 6m)

Six-month real money momentum has recovered significantly but has yet to turn positive. Slowing inflation has been a key driver, while nominal broad money is no longer contracting. Economic weakness may abate in H1 2024 but current monetary trends appear inconsistent with a meaningful recovery. Early rate cuts are urgently required to limit still-significant downside risk and head off an extended inflation undershoot.

Kingdom of Saudi Arabia, Riyadh, King Abdullah Financial District.

MENA equity markets finished the fourth quarter with returns of 5.9% (for the S&P Pan Arabian Index), rounding out a reasonably strong year with an Index return of 10.2%.

2023 marked the third consecutive year of outperformance for the S&P Pan Arabian index against Emerging Markets (the MSCI EM Index). Over that period, MENA outperformed EM by a remarkable 59.2%. Despite this, an EPFR survey cited by JP Morgan of key EM managers indicates most are staying bearish on the region (as measured by the median exposure relative to the region’s MSCI EM Index weight as of January 8, 2024).

Morgan Stanley’s MENA equity sales desk notes that ~50% of GEM funds have zero exposure to Saudi Arabia, which has a 4.1% weight in the MSCI EM Index. While foreign institutional ownership of Saudi stocks has risen dramatically over recent years (the latest weekly data from the Tadawul shows foreign institutions own 12.5% of the free-float market capitalisation), positioning remains relatively conservative.

Without speculating on the reason(s) why EM managers have taken this view, we continue to believe it demonstrates a knowledge gap from the years when markets like Saudi were all but shut to foreign investors. This presents an opportunity for specialised managers with an early mover advantage in these markets to operate and invest with an edge that is difficult to establish in other well-trodden EMs.

Since the end of the first quarter of 2023, we have become more vocal about our concern on valuation levels in Saudi. During this period, we’ve seen an increase in geopolitical risk, persistently high interest rates, and lower oil prices. None of those factors seem (for the time being) to temper local and regional investor enthusiasm for Saudi stocks, particularly mid-caps and IPOs. We believe it is prudent to avoid being overly exposed to situations where, by our estimates, investor positioning and expectations are excessively high. While we remain constructive on the quality of the Saudi-based businesses we own and the country’s structural growth story, especially in the consumer, healthcare, and education sectors, we enter 2024 with lower exposure to these stocks. The Saudi market is highly dynamic, and we expect there will be opportunities to rebuild our exposure to those stocks throughout year.

We are relatively more bullish on the UAE, focusing primarily on banks and quasi-monopoly businesses like utilities and infrastructure. Benign liquidity conditions and strong economic growth favour UAE banks with a solid deposit franchise and strong lending opportunities in 2024. We have already seen at the beginning of this year that banks are signalling confidence in their outlook by significantly upgrading their dividend payout ratios for the profits from last year. Our UAE banks portfolio is yielding over 6% on average (as of the date of this letter), an attractive level as the interest rate cycle begins to turn.

In other markets, we continue to back Morocco-based companies in the retail and technology sectors and have expanded our portfolio with a new investment in healthcare, a sector set to grow significantly from a universal health scheme that will materially improve access to much-needed medical services. We expect Morocco to perform better in 2024 as inflation pressures ease and the country continues to develop a competitive base for manufacturing and services that we believe will unlock growth this year and beyond. (In a recent Bloomberg article, Morocco, alongside Mexico, Poland, Vietnam, and Indonesia were identified as key “economic connectors” that will benefit from supply chain reshuffling.)

In Qatar and Kuwait, we remain selective, with growth remaining constrained, though we see potential in Qatar’s liquified natural gas value chain and are more optimistic about Kuwait following the appointment of a reformist royal as the new Emir in late 2023.

Egypt remains a wildcard, with an imminent devaluation likely to be the first step in a long journey towards rebuilding policy credibility with investors. That said, we remain open to increasing our ownership in our preferred Egyptian healthcare and technology businesses if opportunities arise later this year.

We wish you a prosperous 2024 and look forward to sharing updates on our strategy with you.

Palace of Culture and Science & city skyline at night, Warsaw, Poland.

The strategy focuses on investing in frontier and emerging market companies that our team expects will benefit from demographic trends, changing consumer behaviour, policy and regulatory reform, and technological advancements.

Below, we explore some of the key factors influencing returns and share observations on the portfolio and the markets.

Internet

The strategy saw strong returns from the internet portfolio in the quarter. We capitalised on share price weakness in Allegro.eu (ALE), Poland’s leading online marketplace, following a partial sell down by its private equity majority shareholders. Allegro boasts over 14.5 million active buyers in Poland and generated ~$13 billion in gross merchandise value in the last twelve months, securing a clear market lead with a ~35% share of online retail. Under new management over the last 18 months, the company has demonstrated an impressive capacity to enhance commercial terms with merchants and suppliers, increase advertising revenue contribution, and instil much-needed cost and capital allocation discipline. Furthermore, the company is growing its market share and improving engagement through a heavier focus on its SMART! program (akin to Amazon’s Prime). These efforts have driven a noticeable increase in the take rate to 11.9% as of Q3 2023 (a top-quartile take rate amongst EM e-commerce peer group) and underpinned a sustainable operating margin profile of nearly 20% in the nine-month period ending September 2023. While we acknowledge that the overhang from its private equity owners will remain for some time, we plan to take advantage of opportunities to add to our Allegro position as those sellers continue to divest their stake in the business.

Continuing with Emerging Europe, the strategy also saw strong returns from BCG Classifieds Group (BCG), the leading online classifieds group in the Baltics with a dominant position in auto, real estate, jobs and services, and generalist marketplaces in Lithuania and Estonia. BCG’s shares reacted positively to a strong set of results in the second half of 2023, with revenue and operating profits growing 20% and 36% year-over-year (y-o-y), respectively. BCG exemplifies the dominant, unassailable position of a leading classifieds business. In Lithuania, it is six times and 21 times larger than its closest competitor in auto and real estate classifieds, respectively. In Estonia, it is 29 times and 16 times larger than its closest competitor in those categories. This dominance only grows with time, as buyers and sellers find that the largest opportunity to transact (i.e., marketplace liquidity) is with the clear market leader. Management has effectively reinforced the company’s leadership position whilst making prudent capital allocation decisions, including share buybacks and reducing capital throughout the year.

Healthcare

The healthcare portfolio delivered strong returns in the quarter, led by Medikaloka Hermina (HEAL), the Indonesian healthcare provider. HEAL’s share price reacted positively to a strong third-quarter earnings report that showed 22% and 72% y-o-y growth in revenue and EBTIDA, respectively. The profit margin expansion at HEAL reinforced our belief in the company’s potential for profitable growth from its 47 hospitals, whilst scaling up the network to take advantage of the vast opportunity that Indonesia’s 250 million population provides. That said, we took advantage of the strong share price reaction and reduced our exposure to HEAL on account of valuations.

We also saw positive contributions from Integrated Diagnostics Holdings (IDHC) in Egypt due to insider buying, and AGP Pharma (AGP) in Pakistan owing to the country’s improving macroeconomic outlook. We acted on the positive share-price movement at both companies, reducing exposure in Egypt, and exiting Pakistan.

Additionally, we invested in a Thai healthcare provider focused on medical tourism (~70% of revenue). Thailand, ranked as the eighth most popular tourist destination globally, has developed a formidable medical tourism infrastructure over the last 20 years. The company we invested in has established a reputable brand among relatively affluent patients from the Gulf countries, Cambodia, Laos, and parts of the subcontinent.

Financial services

The strategy experienced weak performance from the financials portfolio in the quarter, affected by Indonesian microfinance and UAE banks and financial services. In Indonesia, persistent asset quality pressures continue as low-income households face considerable challenges with disposable income and their ability to make good on loans. Although we anticipated election-related spending to trickle down to this segment, it appears unlikely to significantly change the outlook for these households. There may be more clarity after the Indonesian presidential elections, expected to conclude in June 2024. Accordingly, we decided to scale back our exposure to this theme until more policy clarity emerges after the elections. In the UAE, we remain bullish about the financial services opportunity set and have been adding to our exposure there throughout the quarter.

Consumer portfolio

The strategy’s Asian consumer staples portfolio performed poorly in the quarter. Weakening consumer purchasing power is adversely affecting demand across a range of consumer categories, including health supplements in Indonesia, beer in Vietnam, paints in Thailand, and tiles and sanitary ware in the Philippines. The region’s consumers are generally cautious, and we expect this to continue until inflationary pressures subside. We have been reducing our exposure to consumer stocks in the region but remain invested in our highest-conviction consumer companies, as their valuations appear very attractive to us.

Outlook

As we move into 2024, our team feels confident in the portfolio, buoyed by a powerful combination of expectations of strong earnings growth and attractive valuations. While the environment remains challenging for many economies we invest in, emerging green shoots make us more optimistic about the future. We look forward to updating you on the strategy as the year progresses.

Image of wind turbines on prairies

Connor, Clark & Lunn Infrastructure (CC&L Infrastructure) is pleased to announce that it has entered into an agreement to acquire a majority stake in the Sharp Hills wind farm (Sharp Hills, or the Project) from EDP Renewables Canada Ltd. (EDPR Canada), a subsidiary of EDP Renewables for an estimated Enterprise Value of approximately C$0.6 billion for an 80% stake and inclusive of investment tax credits. With the addition of this investment, CC&L Infrastructure will own more than 600 megawatts (MW) of wind generation assets and the Firm’s total portfolio of renewable energy projects will exceed 1.8 gigawatts (GW) of clean energy capacity across Canada, the United States, and Chile.

Located in southeastern Alberta, Sharp Hills is one of the largest onshore wind farms in Canada with approximately 300 MW of capacity, representing clean energy generation equivalent to the amount of power used by more than 160,000 Alberta homes. The newly built project recently entered into operations, with remaining construction expected to be completed by Q2 2024. The construction of this facility marked a significant investment in the province, contributing to the local economy through job creation and funding to the community. Sharp Hills is fully contracted through a 15-year power purchase agreement with a high-quality counterparty.

“The Sharp Hills wind farm is an attractive addition to our increasingly diverse portfolio of infrastructure assets. We look forward to working further with our partner, EDPR, in the safe and successful operation of this facility for years to come,” said Matt O’Brien, President of CC&L Infrastructure. “CC&L Infrastructure has a long history and significant expertise as an owner of more than 80 clean energy projects. We are excited to continue expanding our asset base and are actively pursuing further investment opportunities created by the increasing demand for renewable power and the broader energy transition that is underway.”

“We’re excited to partner again with CC&L Infrastructure, this time in Alberta,” added Sandhya Ganapathy, CEO of EDP Renewables North America. “The Sharp Hills project underscores our continuing commitment to invest in Alberta and contribute to its grid resiliency and energy security. We look forward to continued efforts focused on Canada’s energy transition.”

This is CC&L Infrastructure’s second transaction with developer EDPR, having previously acquired a 560 MW portfolio of wind and solar assets in the United States. EDPR will retain a minority equity interest in Sharp Hills and continue to operate and manage the Project. National Bank Financial Inc. advised CC&L Infrastructure as financial advisor and Torys LLP as legal counsel while CIBC Capital Markets served as the financial advisor to EDPR Canada. The transaction is subject to customary closing conditions expected to be satisfied in the coming weeks.

About Connor, Clark & Lunn Infrastructure

CC&L Infrastructure invests in middle-market infrastructure assets with attractive risk-return characteristics, long lives and the potential to generate stable cash flows. To date, CC&L Infrastructure has accumulated over $5 billion in assets under management diversified across a variety of geographies, sectors, and asset types, with over 90 underlying facilities across over 30 individual investments. CC&L Infrastructure is a part of Connor, Clark & Lunn Financial Group Ltd., a multi-boutique asset management firm whose affiliates collectively manage over CAD$118 billion in assets.

For more information, please visit www.cclinfrastructure.com and follow us on LinkedIn.

About EDP Renewables North America

EDP Renewables (Euronext: EDPR) is a global leader in renewable energy development which has built a significant position in the energy landscape, establishing a presence in four global hubs – Europe, North America, South America, and Asia Pacific. With headquarters in Madrid and leading regional offices in Porto, Houston, São Paulo and Singapore, EDPR has a sound development portfolio of top-level assets and market-leading operating capacity in renewable energies. Its business mainly encompasses onshore wind, distributed and large-scale solar, offshore wind (through a 50/50 joint venture – Ocean Winds) and complementary technologies to renewables, such as hybridization, storage and green hydrogen. EDPR is a division of EDP (Euronext: EDP), a leader in the energy transition with a focus on decarbonization. EDP – EDPR’s main shareholder – has been listed on the Dow Jones Index for 16 consecutive years, recently being named the most sustainable electricity company on the Index.

For more information, please visit www.edpr.com/north-america and follow us on LinkedIn.

Contact

Kaitlin Blainey
Director
Connor, Clark & Lunn Infrastructure
(416) 216-8047
[email protected]

Tom Weirich
Lead – Marketing & Stakeholder Relations
EDP Renewables North America (EDPR NA)
(281) 825-2771
[email protected]

"Vote" election campaign button badges on the American flag.

Elections and stocks: A surprising non-story

In a recent weekly update, we discussed how 2024 is an important election year worldwide. As it relates to US elections and stock returns, the data shows limited impact. Although markets can be volatile in election years, the political party in the White House has historically had minimal effect on returns. Since 1936, the 10-year annualized return of US stocks (as measured by the S&P 500 Index) at the start of an election year is 11.2% for a Democratic win and 10.5% for a Republican win. Sector performance, however, can be affected by short-term policy planning headlines.

Election rhetoric and the real story of healthcare stocks

For example, the healthcare sector often underperforms during a US election year due to the attention on drug and medical cost control. The global impact is significant, as the US is a major driver of healthcare economics. For 2024, the effect on healthcare may be less pronounced. The Biden administration’s measures for drug price control as part of the 2022 Inflation Reduction Act have already been implemented, but with only 10 high-profile drugs priced by the government under the reform, the economic impact has been muted. The pace of implementation could slow further under a Republican administration, potentially leading to positive earnings surprises.

Our Global portfolio includes a pure-play drug manufacturer, ANI Pharmaceuticals (ANIP:US), which owns a large facility in Minnesota where it produces a wide range of specialty and generic drugs and has a rapidly growing immune therapy franchise. None of its drugs have been targeted by US authorities for price negotiations.

From tariffs to technology

Recent protectionism, particularly new tariffs in sectors like semi equipment initiated during the Trump administration, may extend to medical devices and biotechnology. Don’t be alarmed if more are implemented. It’s our job to identify the tailwinds. Medical devices and biotechnology companies are likely to be the next tariff targets, especially those involving China. Over the past decade, Chinese productivity and quality have risen sharply in the fields of biotechnology, drug and device development.

Two proposed bills: the Biosecure Act and the Prohibiting Foreign Access to American Genetic Information Act of 2024 enjoy bipartisan support, with a 60% China tariff on healthcare goods proposed by Republicans in the event of their victory. This could create positive competitive tailwinds for North American and European contract drug manufacturers.

Evotec’s leap forward

Global Alpha owns Evotec SE (EVT:GR), a rapidly growing biological drug manufacturing contractor with technologies for low-cost and fast scaling of drug production. Evotec also has potential for numerous drug development partnerships and is developing a new stem cell medical device system for diabetes treatment.

Medical devices as the market’s quiet titans

The medical device industry, known for its high barriers to entry and advanced technology, appears well-positioned for profitable growth. It tends to be less scrutinized by policymakers and therefore less affected by elections. In the last three decades, the industry has outpaced the S&P 500 by almost 15 percentage points, with stellar performance in the early 1990s, mid-2000s and late 2010s. Yet value creation has become more difficult in the past five years, especially for large, diversified companies. The top-30 largest medical device companies have underperformed the S&P 500 over one-, three- and five-year periods.

Our focus is on smaller, nimble names like Globus Medical Inc. (GMED:US), now an orthopedic powerhouse after acquiring its competitor, NuVasive. This acquisition has broadened its portfolio and enhanced its geographic reach. Globus’s expanded sales force will also support its fast-growing robotics business, a relatively new area. These robots improve the efficiency and output of orthopedic surgeons during back surgeries. Globus has also recently initiated a trauma product line that has successfully penetrated the market, further benefiting from its increased sales force. The orthopedic market is very large, valued at USD$72.3 billion and growing at a 5.3% rate.

Seeing clearly: The vision market’s rapid growth

Medical devices target a broad range of very large markets. For example, the global vision care market is projected to reach USD$192.85 billion by 2026, with a CAGR of 5.6%.

Global Alpha owns Menicon Co. Ltd. (7780:JT), Japan’s first and largest contact lens manufacturer, which now has a presence in over 80 countries. The company offers a comprehensive product lineup including disposables (daily, 2 weeks, 1 month, >3 months, silicone hydrogel), other soft contact lenses and RGP (Rigid Gas Permeable) lenses.

In China alone, myopia affects 146 million people. The condition is especially prevalent among children, creating a strong demand for corrective devices. Orthokeratology, a technique using contact lenses to reshape the cornea for long-lasting effects, had a global market value of $2.5 billion in 2023 and is expected to grow at a CAGR of 6.1% beyond 2026. Market penetration in China is only 2.0%. Menicon ranks as the second-leading company in this space.

The true power of legislative winds

To sum up, it seems ineffective to predict the direction of the US stock market based on political party forecasting. However, it is important to monitor the progression of legislation from announcement through to funding and implementation. This is because bills go through phases of hype, disillusionment and reality, similar to many other events that can influence the economy.


Recent US equity market buoyancy is likely to be related to a rebound in broad money momentum during H2 2023. The previous post argued that this was driven by monetary financing of the federal deficit – specifically, large-scale issuance of Treasury bills that were bought mainly by money funds and banks.

A more contentious interpretation is that the Treasury has been operating a form of QE that has overridden the monetary effects of the Fed’s QT.

The federal deficit can be financed by running down the Treasury’s cash balance at the Fed or issuing bills / coupon debt. The first option injects money directly. Issuing bills is also likely to expand broad money, since money funds and banks usually absorb the bulk of new supply. Coupon issuance usually has the smallest monetary impact because coupon debt is purchased mainly by non-banks.

So a summary measure of the monetary influence of financing operations is the difference between Treasury bill issuance and the change in the Treasury balance at the Fed – henceforth “Treasury QE”.

Chart 1 shows six-month running totals of Fed QE / QT and the suggested Treasury monetary impact along with the six-month change in broad money. The sum of the Fed and Treasury series “explains” most of the variation in money momentum in recent years – chart 2.

Chart 1

Chart 1 showing US Broad Money M2+ (6m change, $ bn) & Fed / Treasury QE / QT (6m sum, $ bn) Fed QE = Change in Fed Securities Holdings “Treasury QE” = Treasury Bill Issuance minus Change in Balance at Fed

Chart 2

Chart 2 showing US Broad Money M2+ (6m change, $ bn) & Sum of Fed & Treasury QE / QT (6m sum, $ bn)

“Treasury QE” was a major contributor to the 2020 monetary surge and became significant again in late 2022 / early 2023, mainly reflecting a run-down of the Treasury’s cash balance. Following suspension of the debt ceiling in June 2023, the Treasury rebuilt the balance but the monetary impact was more than offset by bumper bill issuance – see the previous post for details.

The Treasury’s recently released financing plans imply a swing from expansion to contraction during H1 2024. The cash balance at the Fed is targeted to fall from $769 billion at end-2023 to $750 billion at end-Q1, remaining at this level at end-Q2. The stock of bills, meanwhile, is projected to rise by $442 billion in Q1 but fall by $245 billion in Q2. “Treasury QE” would remain strong at $461 billion in Q1 – far ahead of expected Fed QT of about $240 billion – but a dramatic shift would occur in Q2, with “QT” of $245 billion.

If Fed QT were to continue at its current pace, the suggestion is that the six-month change in broad money would return to negative territory by mid-year, unless other monetary counterparts were to show offsetting strength – chart 2.

Note that the above argument is distinct from the notion that ongoing Fed QT risks pushing reserve balances and / or deposits at the overnight reverse repo (ON RRP) facility below the level required for money market stability. The possibility of a broad money shortage due to a withdrawal of Treasury monetary support would remain even if the minimum reserves / ON RRP level proves to be lower than feared. The two risks, however, could interact.

A possible conclusion is that markets face a monetary air pocket in Q2 unless the Fed halts QT at its March meeting. A cynic might speculate that the Treasury’s financing plans are designed to increase pressure for an early Fed cessation, which might be followed by a H2 resumption of bill financing to swell monetary support ahead of the November election.

Woman in suit looks out at Shanghai skyline at sunset from window in building.

Contrary to the market’s expectations of a robust post-pandemic economic recovery, China’s rebound has been underwhelming. Although its 2023 GDP growth surpassed the official “around 5%” target, key indicators point to a struggling economy in the post-COVID era. This situation reveals three primary challenges: debt, deflation and demographics (collectively termed the 3Ds), reminiscent of Japan in the 1990s. China is arguably in a stronger position, with potential for higher growth, lower asset-price inflation and more effective currency management. Nevertheless, addressing these problems is complex. While debt and deflation could be mitigated through proactive government policies and a shift to a consumption-driven economy, demographic trends are less malleable.

The one-child policy legacy

For the second year in a row, China’s population decreased by 2.08 million people in 2023 after losing 850,000 in 2022. The longstanding one-child policy, only lifted in 2016, has had a lasting impact. Government initiatives to encourage marriage and parenthood have been insufficient. Educational and employment gains have empowered women to have more control over reproductive choices, contributing to a lower fertility rate. This demographic shift threatens China’s economic prosperity by reducing the labour force and consumer spending.

Balancing the productivity and social welfare equation

Globally, countries like Sweden, Japan, South Korea and Russia have tried various strategies to tackle similar demographic dilemmas, including financial incentives, and housing and childcare assistance, yet a sustainable solution remains elusive. For instance, Japan anticipates a shortfall of 11 million workers by 2040. However, this does not render these countries, including China, less attractive for investment. To adapt, China must improve its existing workforce’s productivity.

In 2022, household consumption in China constituted 37% of its GDP, lower than in Japan (55%) and the US (68%). This may be primarily due to the lack of a strong social safety net, leading to a high savings rate for healthcare, education and retirement. Enhancing these supports could unlock significant consumer spending. China’s government is transitioning the economy towards consumption, but pension, healthcare and unemployment reforms face political and fiscal hurdles. We believe improving social welfare is also essential for China’s economy.

Sector opportunities

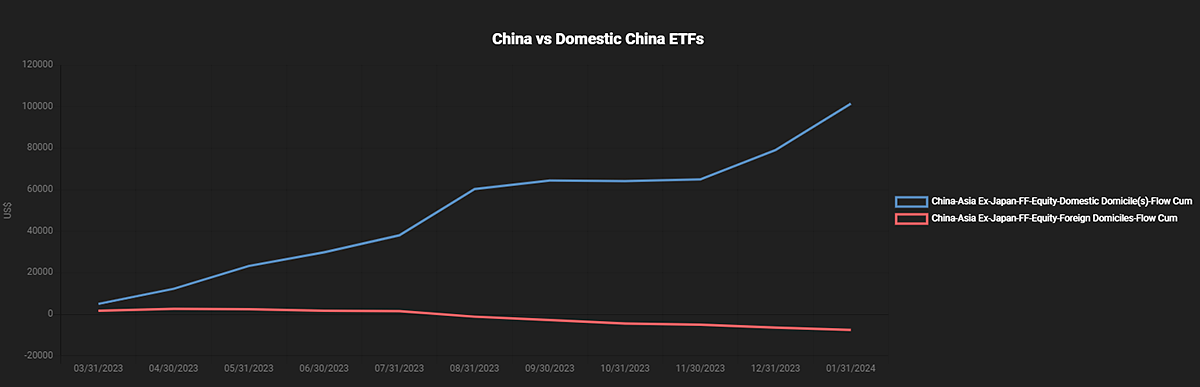
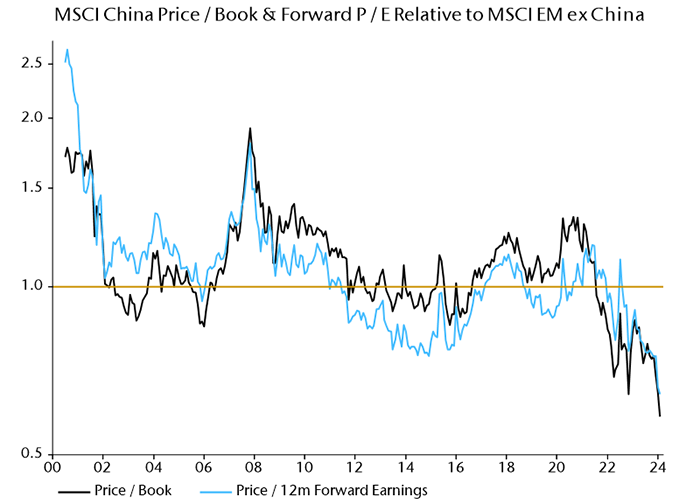
Meanwhile, China’s equity market appears historically undervalued and relative to its emerging markets peers. After losing more than US$6 trillion in market capitalization since early 2021, it risks becoming a value trap if fundamental issues aren’t resolved. At the same time, certain sectors, like electric vehicles, renewable energy, robotics, healthcare, services and tourism, may enjoy strong tailwinds.

Fu Shou Yuan: A case study in market potential

An example is Fu Shou Yuan (1448 HK), a leading private provider of deathcare services that we hold in our Emerging Markets Small Cap Fund. Operating in 46 cities across 19 provinces, the company targets the premium market in a highly fragmented and regulated industry forecasted to grow at a 9% CAGR and reach US$56 billion by 2026, according to Goldman Sachs. Fu Shou Yuan’s extensive land bank, expertise and reputation position it to continue consolidating the market through tuck-in acquisitions and public-private partnerships.

China’s future amid the 3Ds

In the short term, investors in China are anticipating more impactful stimulus measures. We believe that for it to achieve sustainable growth, the country must simultaneously deal with its core structural issues and revive flagging consumer confidence.

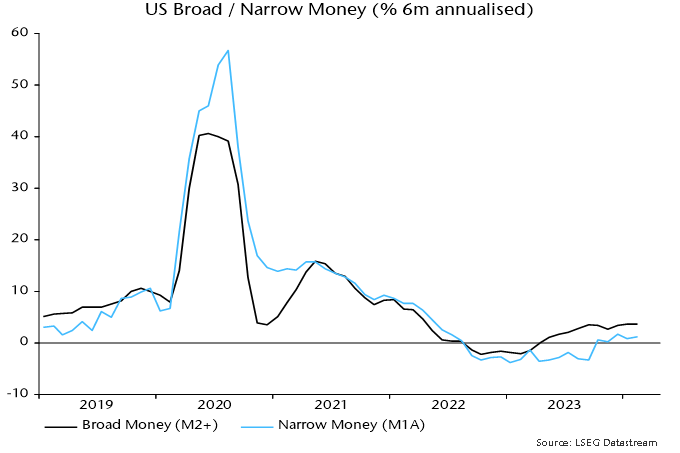
The six-month rate of change of US broad money has recovered from negative territory in early 2023 to 3.9% annualised in December – close to an average of 4.2% over 2010-19, when economic performance was generally favourable.

Does this signal that the economy has adjusted to higher interest rates and monetary conditions are no longer particularly restrictive, in turn suggesting less need for Fed easing?

The analysis below of the “credit counterparts” to monetary expansion indicates that the recent revival has been driven by exceptionally large-scale purchases of Treasury bills by money market funds.

Such buying will fall back but its recent importance highlights a larger point. If the fiscal deficit remains at its current level (or rises further), and the Treasury continues to choose to fund a large proportion of the deficit by expanding the Treasury bill issue, the contribution of deficit financing to monetary growth is likely to be significant, even assuming no return to QE. In this scenario, a higher average level of interest rates may be necessary to constrain money growth to a pace – of perhaps 4-5% pa – compatible with trend economic expansion and on-target inflation.

On the suggestion that the recovery in money growth obviates the need for policy easing, a key point is that the effects of prior monetary restriction are still feeding through and may not be fully apparent for another year or more. Rate cuts are likely to be warranted to cushion near-term economic weakness and avert an inflation undershoot.

The numbers quoted above for US broad money expansion refer to the “M2+” measure calculated here, which adds large time deposits at commercial banks and institutional money funds to the official M2 measure. The inclusion of these items is important as they capture a significant proportion of money holdings of non-financial businesses and non-bank financial institutions. As previously discussed, US business money holdings have been rising rapidly in recent quarters, resulting in six-month momentum of M2+ diverging positively from that of M2 since late 2022, i.e. M2 is understating broad money growth at present.

Six-month broad money momentum has recovered by much more and to a higher level in the US than in the Eurozone and UK – see chart 1.

Chart 1

Chart 1 showing Broad Money (% 6m annualised)

The credit counterparts analysis links changes in broad money to movements in other items on the monetary sector’s balance sheet, the US monetary sector being defined as the Fed, commercial banks and other depository institutions, and money funds. The following simple formulation is used for the analysis here:

Change in broad money = monetary financing of federal deficit + change in commercial banks’ loans and leases + other counterparts (residual)

Monetary financing of federal deficit = net purchases of Treasury securities by Fed, commercial banks and money funds – change in Treasury general account balance at Fed

The table shows the contribution of these items to the six-month change in M2+, not annualised, in December 2022 and December 2023.

Table 1 showing the contribution of these items to the six-month change in M2+, not annualised, in December 2022 and December 2023

The positive swing in six-month momentum between the two periods was driven by monetary deficit financing and, in particular, a huge change in money funds’ transactions in Treasuries, from selling in H2 2022 to exceptionally large-scale buying in H2 2023.

What caused this turnaround? Following the suspension of the debt ceiling in June 2023, the Treasury issued a net $1.21 trillion of Treasury bills in H2 2023, up from $170 billion in H2 2022 and the second-highest half-year amount ever (after H1 2020).

Money funds and commercial banks are natural buyers of Treasury bills because of the maturity structure of their liabilities. The market mechanism that induced them to increase demand was a rise in Treasury bill yields relative to other short-term rates, including the emergence of a premium over the Fed’s overnight reverse repo rate.

Money funds moved $1.1 trillion out of the Fed facility during H2 2023, buying an estimated $900 billion of Treasury securities and placing the remainder (and an additional amount) in the private repo market (with those funds probably also used to buy Treasuries, suggesting further indirect monetary financing).

Money funds’ Treasury buying is likely to slow dramatically in H1 2024, for two reasons. First, expansion of the Treasury bill issue will be scaled back to $200 billion (from $1.21 trillion in H2 2023), according to refunding plans. Secondly, money funds’ balance in the Fed facility was down to $800 billion at end-2023 (from $2.3 trillion a year earlier), with a further decline in early 2024. The rate of Treasury bill purchases will plausibly slow as the balance approaches exhaustion.

It would, however, be misleading to suggest that purchases of Treasuries by money funds and banks face a constraint in terms of the availability of investible resources. The first-round effect of the fiscal deficit is to swell the broad money stock, i.e. it creates the liquidity necessary to absorb associated debt issuance. If new Treasuries are sold to non-banks, the monetary boost is reversed. If, alternatively, money-holders choose to retain their higher balances, banks and money funds have additional funds with which to buy Treasuries. The money creation due to the deficit then remains unsterilised.

How large a boost could this private form of monetary financing give to broad money growth over the medium term? The federal deficit was $1.78 trillion in calendar 2023, equivalent to 6.5% of GDP and 6.8% of the M2+ stock at end-2022. Suppose that 1) the deficit remains stable as a proportion of the money stock, 2) it is half-financed via Treasury bills and 3) money funds and banks take up half of the issued bills. Assuming no QE / QT and a stable Treasury balance at the Fed, monetary deficit financing would contribute 1.7 pp to annual M2+ growth.

For comparison, Treasury buying by money funds and banks contributed 0.6 pp to average annual growth of M2+ over 2010-19.

Suggested conclusions are: 1) prior monetary weakness will be the dominant influence on economic developments over the next few quarters; 2) the recovery in broad money growth is likely to stall in H1 2024; and 3) a persistent large fiscal deficit could cause funding indigestion and force a renewed increase in reliance on bill financing (or, in the extreme, a resumption of QE), in turn posing an upside risk to medium-term money growth and inflation.

Image of car side mirror with view of scenery behind the car.

In 2023, we at Banyan Capital Partners continued our journey of strategic growth, investment and delivering value to our investors.

New to Banyan and recent promotions

Photo of Chris Luongo
Chris Luongo
to Senior Associate
Photo of Gordon Yee
Gordon Yee
to Senior Analyst
Photo of Miranda Li
Miranda Li
to Senior Analyst
Photo of Dominic Mitchell
Dominic Mitchell
has joined as
Director of Finance

These promotions and additions reflect our culture of professional growth and recognizing the contributions of our team members. Our team’s development is integral to our ongoing success and capacity for identifying and nurturing promising investment opportunities and our investment portfolio.

New platform investment

Image of dried flower arrangement.

Second Nature Designs

Founded in 1994, Second Nature is a leading manufacturer and distributor of home décor and gifting products made up of dried florals and other naturally and sustainably sourced botanicals. The company sources materials globally, manufactures its products in Hamilton, Ontario and services a recognizable customer base across North America.

We’ve partnered with Second Nature’s President and founder as well as its management team, to facilitate succession planning and execute on the business’s next phase of growth.

Portfolio spotlight

Image of vitamins

Purity Life

In November 2023, Purity Life completed its acquisition of the assets of Indigo Natural Foods Inc., a leading distributor of natural health products based in Toronto. This transaction deepens Purity Life’s market presence in Ontario and enhances its portfolio with numerous new brands.

Image of bike rack on top of vehicle

Rack Attack

In January 2023, Rack Attack completed the acquisition of Racks Unlimited, a leading provider of vehicle rack solutions with two stores in Calgary, Alberta. This strategic acquisition allowed Rack Attack to expand its footprint in the Western Canadian market.

With the additional opening of four new stores in Kitchener, London, Winnipeg and Philadelphia, the company now has a total of 46 stores across North America.

Innovative Surface Solutions

In April 2023, Innovative was pleased to announce the appointment of David Safran as President & CEO. David was formerly the CEO of the Kissner Group and brings over 15 years of experience in the salt and derivative products industry.

Learn more about our current investment portfolio

Operating Partner Network

Since 2008, Banyan has partnered with the best operators in their industries to successfully buy and build businesses with a long-term ownership focus.

Photo of Andy O'Brien
Andy O’Brien
Operating Partner
Photo of Jason Grouette
Jason Grouette
Operating Partner

Andy O’Brien joined Banyan as an Operating Partner in June 2023, targeting investment opportunities in the food service, food retail, consumer products and retail sectors.

This follows the addition of Jason Grouette as an Operating Partner in 2022 to target investment opportunities in the safety and industrial B2B space.

Learn more about our Operating Partner Network

Looking ahead

Banyan is poised for further growth and expansion as we move into 2024. Our focus remains on identifying new investments in middle-market businesses across North America while maintaining our commitment to long-term value creation. We will continue to leverage our expertise and network to foster strategic partnerships, ensuring sustainable success for our portfolio companies and investors.

New investments

We continue to actively seek to invest in businesses with EBITDA of at least $5 million.

Do you have an opportunity in mind? Explore our investment criteria or connect with us today.

Photo of Sabrina Lacroix

As Chief Compliance Officer, Sabrina Lacroix builds on the strong foundation established during her tenure as Senior Compliance Manager. She brings a deep understanding of regulatory frameworks and a commitment to maintaining stringent compliance standards.

We look forward to her ongoing impact at Global Alpha.