Shibuya Crossing and its surroundings in Tokyo, Japan.

Last week, the January edition of the BofA Global Fund Manager Survey was released. It featured 256 panelists who manage a combined US$669 billion in assets. The survey revealed a growing optimism about rate cuts and a macroeconomic “soft landing” despite increasing bearishness with respect to China. Among the many interesting findings, a few are particularly relevant to our focus:

  • For the first time since June 2021, there’s a marked preference for small caps over large caps.
  • A strong preference for high-quality investments.
  • Overweight in countries compared to the average positioning of the past 20 years: notably the US and Japan.
  • Overweight in sectors relative to the average positioning in the past two decades: predominantly in consumer staples, healthcare and technology.

While our last commentary covered global small caps in general, this week let’s take a closer look at Japan specifically. The positive sentiment towards Japan in the survey is in line with market trends. The Nikkei 225 Index was up 28% in 2023 and recently reached its highest level in 34 years, approaching a new record.

Factors driving this rally include a weaker yen, the end of deflation, wage growth and improved corporate governance. A decade ago, few companies had independent directors, but today almost all have at least a third of their board as independents. Institutional investors are increasingly voting down poison pills and supporting activism.

Source: GMO.

In 2024, we expect continuing financial reforms to attract more investors. Here are some new initiatives:

  • January: Introduction of the revamped Nippon Individual Savings Account (NISA). Under Prime Minister Kishida’s new capitalism scheme, the NISA aims to boost household wealth through investment. The contribution limit has been raised and the tax-exempt period extended, allowing an annual contribution of up to ¥3.6 million (US$24,300) per person and a combined total balance of ¥18 million to be permanently tax exempt. As of June 2023, there were 19.4 million NISA accounts, a modest number considering Japan’s population. In contrast, Japanese households held a record ¥2,115 trillion in financial assets, with more than half of this amount in cash.
  • January 15: Companies on the Tokyo Stock Exchange (TSE) began disclosing their capital efficiency plans. Thus far, 40% of firms listed in the TSE’s prime section have done so.
  • April: Enhanced segment earnings reporting. In addition to quarterly earnings reports, listed companies will now only need to submit more detailed financial reports semiannually rather than quarterly. This change emphasizes segment reporting. The TSE will mandate that companies disclose earnings and cashflow for each business segment to improve transparency.
  • November 5: The TSE will extend trading hours by 30 minutes to increase liquidity.

How have Japanese small caps been performing?

Since 2000, Japanese small caps have substantially outperformed large caps.

However, in 2023, they underperformed, with value stocks outperforming growth stocks. This trend was influenced by the TSE’s March 2023 initiative for sustainable growth and enhanced corporate value, leading to a renewed interest in large caps and companies with a price/book value below 1x.

Looking ahead, we believe strong fundamentals and valuations are likely to favour Japanese small caps over large caps due to:

  1. Faster earnings growth: Bloomberg data predicts +20% EPS growth for the MSCI Japan Small Cap Index in the next 12 months compared to +8% for the MSCI Japan Index. EPS growth for the following 12 months is +12% for the MSCI Japan Small Cap Index and +10% for the MSCI Japan Index.
  2. Cheaper valuations: The P/E multiple discount for Japanese small caps compared to large caps widened in 2023 to a sizable 3.6%, suggesting a potential mean reversion.
  3. Reduced FX volatility: We expect the JPY to appreciate against the USD in 2024 in response to monetary policy in the US and Japan. Japanese small caps, which are more exposed to the stable domestic economy than large caps, should be less affected by currency fluctuations and may even benefit from a stronger yen via imports.

We believe the shift towards Japanese markets and small-cap stocks hints at something deeper than market fluctuations and could be indicative of structural changes and a broader reassessment of risk and opportunity. Moving forward, investors may need to view traditional powerhouses through a new lens and consider how different markets and different asset classes can offer new avenues for growth in a world where economic certainties are increasingly hard to come by.

US consumers have trounced the Europeans – again. US personal consumption rose by 9.7% between Q4 2019 and Q3 2023 versus a 0.5% increase in the Eurozone and a 1.6% fall in the UK – see chart 1.

Chart 1

Chart 1 showing Real Personal Consumption Q4 2019 = 100

The divergence probably widened in Q4, judging from retail sales. US sales rose solidly into year-end as Eurozone turnover flatlined (through November) and UK sales hit a new low – chart 2.

Chart 2

Chart 2 showing Real Retail Sales December 2019 = 100

Faster growth of US real personal disposable income explains just over half of the US / Eurozone consumption divergence over Q4 2019-Q3 2023 and about one-third of the US / UK difference. The remainder reflects contrasting saving behaviour.

The US personal saving rate fell by 2.3 pp between Q4 2019 and Q3 2023 versus rises of 1.4 and 4.3 pp in the Eurozone and UK respectively – chart 3*.

Chart 3

Chart 3 showing Gross Personal Saving Ratios Dotted = Q4 2019

What explains the willingness of US households to consume more out of their income than before the pandemic, both in absolute terms and relative to Europeans?

A “monetarist” view is that divergent saving behaviour is related to the magnitude of the boost to household money balances from pandemic-era monetary and fiscal stimulus.

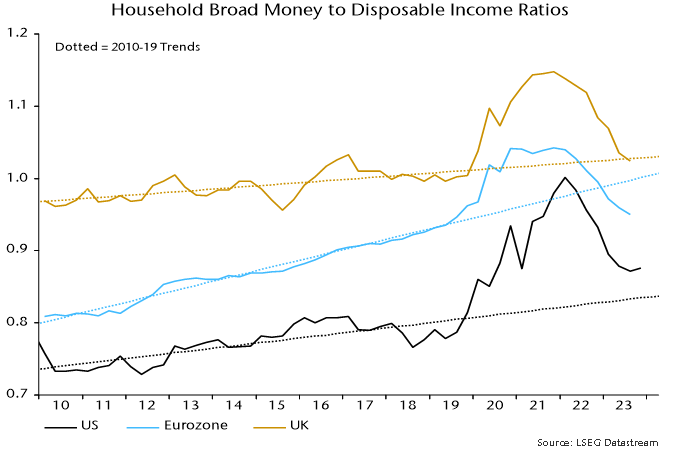
The rise in the ratio of household broad money to disposable income from Q4 2019 was larger and peaked later in the US than in the Eurozone and UK – chart 4.

Chart 4

Chart 4 showing Household Broad Money to Disposable Income Ratios Dotted = Q4 2019

Households with “excess” money balances adjust by spending more on consumption or investment (housing), adding to non-monetary financial assets and / or reducing debt. The larger US excess has probably resulted in a bigger and more sustained boost to consumption than in Europe.

To the extent that monetary adjustment involves higher consumption, the saving rate will be lower than otherwise until the ratio of money balances to income is restored to an “equilibrium” level.

Judging how much of a consumption boost remains requires an estimate of “equilibrium”. As chart 4 shows, the ratio of household broad money to income is below its Q4 2019 level in the Eurozone but still higher in the US and, to a lesser extent, UK.

A superior approach, however, may be to compare money to income ratios with their pre-pandemic trends, since the ratios tend to rise over time as wealth grows faster than income.

On this basis, money demand may now be acting to restrain consumption in the Eurozone / UK, while US excess money balances are now modest and on course to be removed during 2024 – chart 5.

Chart 5

Chart 5 showing Household Broad Money to Disposable Income Ratios Dotted = 2010-19 Trends

The US money to income ratio peaked in Q1 2022, a quarter ahead of the low in the saving rate. The saving rate had risen by 1 pp by Q3 2023 and may increase further as the excess money effect wanes.

*The headline measure of the US personal saving rate is calculated net of depreciation. A gross measure is used here to align with European convention.

Election sign at Polling Station.

Last week, the New York Times identified some pivotal themes set to shape 2024: elections, antitrust and shadow banking, painting a vivid tableau of the global investment landscape. Against this backdrop, over half the world’s population across more than 50 countries will choose their governments in 2024. The US is probably the most significant, but Taiwan’s on January 13 was also noteworthy in the context of the country’s tense relationship with China and its crucial role in the global technology sector and semiconductor manufacturing.

In antitrust, recent weeks have seen cancellations of deals such as Illumina and Adobe and losses in important cases for Google and Apple (with appeals underway). Many antitrust cases are expected to reach courts in both Europe and the US in 2024.

The shadow banking sector is also at the forefront, with prominent figures like Jamie Dimon of J.P. Morgan highlighting private credit as a potential harbinger of the next financial crisis.

Listen to Robert’s audio commentary:  


Small caps in 2024

Turning to our universe of global small-cap equities, our outlook for 2024 builds on our December 2023 comment. As you may recall, 2023 was marked by the dominance of US large-cap equities, particularly the “Magnificent Seven” technology stocks. To help provide a well-informed outlook for this year, I reviewed our previous commentaries, all of which are available on our website from the time our firm was established. They offer valuable context and background and I invite you to browse them for a fuller picture of our thinking over time.

Despite the incredible returns of the Nasdaq-100 Index and, consequently, the S&P 500 Index due to unprecedented concentration, these large-cap indices have not significantly outperformed small caps since 2000, even in the face of various global upheavals, including the tech crash, the Great Financial Crisis and the COVID-19 pandemic.

Defying expectations: Large-cap vs. small-cap performance since 2000

Source: Bloomberg.

2024’s market moods

Understanding market psychology is a good starting point for thinking about the year ahead. So, where do we stand today?

We view the Nasdaq 100 and, by extension, the S&P 500 as being in the “New Paradigm” phase. Meanwhile, small-cap, international and emerging markets equities are approaching the “Despair” phase. Question is, when and what will trigger a return to the mean?

 Line graph showing the cycle of market sentiment, beginning with its rise, reaching a high point labeled "new paradigm," followed by a decline to a low point of despair, and then stabilizing back to the average level.

The concentration conundrum

The S&P 500 is at its highest concentration ever, with the top-10 stocks comprising 31%. This is in contrast to the 35-year average of 20% and even exceeds the 25% peak during the tech bubble. A look back at the performance of US large caps following the era of the Nifty Fifty, which dominated the markets in the 1960s, these stocks subsequently underperformed from 1973 to 1982, realigning their multiples with the broader market.

From 2000 to 2010, US large caps lagged most other indices by a wide margin.

Another perspective to consider is that the US’s weight in the MSCI World Index is at an all-time high of 70%, far exceeding its 25% contribution to global GDP. This is a stark increase from approximately 38% at the end of 2000.

According to the Buffett Indicator, which measures the total market cap over GDP, we are currently at 174%, another record high.

Now that we have scared you about the US large-cap market, the question remains: why do we anticipate a return to the mean in 2024?

Unprecedented global events: a four-year retrospective

The last four years have been extraordinary. In 2020, we had the COVID-19 pandemic, followed by a global lockdown, things we had never seen before. 2021 was the year of the reopening, although a few countries like China reopened in 2022. We also saw the rise of inflation. Not so transitory as it turned out, although the supply chain shocks were. 2022 was the year of the great interest rate resets around the world and the end of free money. Rates were no longer zero. We also saw the war between Russia and Ukraine break out last February. 2023 could have been a more normal year, maybe marked by a slowdown or recession caused by the rapid rise in interest rates. Instead, the economy continued to be strong.

The overlooked factors of government spending and consumer behaviour

What did we miss? First, we missed the fact that governments around the world continued to spend enormously, while running huge deficits. The US, for example, ran a deficit for fiscal 2023 (October) of $1.7 trillion, $320 billion (23%) more than in 2022 and 6.3% of its GDP.

Second, we did not think Americans would spend all the excess savings they had built up during COVID-19.

Source of excess savings

Source: Federal Reserve.

Third, we did not anticipate the frenzy brought by the launch of ChatGPT and the narrative around generative AI.

Fourth, we did not anticipate such an aggressive Fed pivot while inflation is still running hot. Is the Fed seeing a market slowdown ahead?

Navigating new normals

So, what do we think is in store for 2024?

  • The pandemic is over. Although COVID-19 persists, it is no longer seen as a flu variant. No more lockdowns. And companies in 2024 will stop the references to 2019.
  • Interest rates have more or less reached a peak. Will they come down fast? We do not think so unless we experience a deep recession and even then, they will not go back to 0. That experiment failed and the central banks admit it. Will they go from 5% to 10% as they did from 0 to 5%? We believe absolutely not.
  • Supply chain shocks have subsided. There are always supply chain snags, but what we saw in 2021 and 2022 is now behind us.
  • The easy comparison for inflation is now over. Comparing 2023 prices to 2022 showed a big decline. Comparing 2024 to 2023 will not be so straightforward. We will realize that inflation is stickier. How central banks will react remains to be seen. See air freight rates as an example:

Source: Xeneta.

  • The return of the bond vigilante: Those government deficits are unsustainable and the amount of government debt to be refinanced in 2024 is staggering. Governments will have to go back to austerity, possibly at the worst possible time if the economy slows down. We will also see income taxes rise, particularly for companies with high profitability and aggressive tax strategies.
  • The lagging impact of interest rate increases: It takes about 18 months to see the full impact of interest increases. So, we will see the impact of increases for another year, even if rates come down quickly.
  • A return to investment fundamentals: 2023 was brutal for many fundamental investors, us included. Dividend-paying companies underperformed non-dividend payers by the largest margin since 1983. Companies with strong balance sheets underperformed the weakest. Companies with low valuations underperformed those with high valuations.
  • Emphasis on revenue and EPS growth: In 2023, steady revenue and earnings growth gave way to momentum and liquidity. A good example is Apple, which saw its share price increase 49% in 2023 despite a 3% revenue decline in FY 2023 (September) and no earnings growth. That share price increase was equivalent to close to a trillion dollars, the market cap of Australia’s, South Korea’s or Stockholm’s stock exchanges. We anticipate a different trend this year, with a focus on solid balance sheets to withstand shocks and higher interest rates and to take advantage of consolidation opportunities.
  • There will be more M&A, both from strategic investors as well as private equity funds. A more stable operational and funding environment will be conducive to transactions.
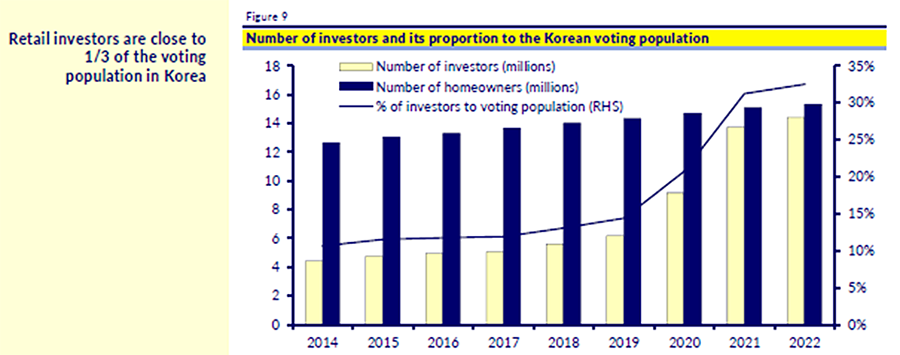
  • We may also see a return of individual investors in Japan now that the Nikkei Index is back to where it was in 1990 and the government is trying to unlock US$14 trillion of household savings by expanding the tax-exempt Nippon Individual Savings Account (NISA), allowing investors to buy up to $24,170 per year in stocks. Japanese households keep 54% of their assets in cash versus 35% in the euro area and 13% in the US.

Building trust through market cycles

For our clients who started investing with us between 2019 and March 2020, you will have experienced mediocre performance, even worse if you invested with us in spring 2020 or since March 2022. But likely satisfactory if you invested with us outside these periods.

Should you keep your trust in us? We believe you should.

Our portfolio management team remains the same. The five partners who manage our one portfolio as one team have been together for over 15 years.

We have added to our bench strength with five more analysts joining our developed market portfolio management team since 2018 and three more covering emerging markets.

Upholding our investment philosophy

Our philosophy remains the same. We believe:

  1. Earnings growth drives stock prices.
  2. Secular trends will support superior and longer-term growth.
  3. A long-term investment horizon is key.

Our investment process is solid:

  1. Add excellent investment ideas that meet all our criteria, including valuation and expected return, to an approved list.
  2. Use the approve list to build a portfolio that meets client expectations and constraints.

The chart below shows some style factors since 2008. Our worst two years since inception have been 2020 and 2023. Unfortunately, this has impacted our one to four-year performance. As illustrated, those two years coincided with size (larger), beta (higher) and ETFs (passive flows) outperforming.

You will also notice that the number of years these factors underperformed greatly surpass the number of times they outperformed, forming another reason for our optimism.

Calendar year style factor returns

Heatmap showing calendar year style factor returns from 2008 to 2023.

Source: Omega Point.

As we reflect on these trends and look ahead, it’s clear that the markets are in flux. We remain committed to adapting to these changes, always with an eye on long-term growth.

With this perspective, I want to wish you an excellent 2024. May the year bring health, peace and happiness to you, your families and your friends and colleagues!

Robert Beauregard

President, Co-Founder and Chief Investment Officer

*This communication may contain forward-looking statements (within the meaning of applicable securities laws) relating to the business of our funds and the overall financial environment in which they operate. Forward-looking statements are identified by words such as “believe”, “in our opinion”, “anticipate”, “project”, “expect”, “predict”, “intend”, “plan”, “will”, “may”, “estimate” and other similar expressions. These statements are based on our expectations, estimates, forecasts and projections and include, without limitation, statements regarding decreased fund portfolio risk and future investment opportunities. The forward-looking statements in this communication are based on certain assumptions; they are not guarantees of future performance and involve risks and uncertainties that are difficult to control or predict. A number of factors could cause actual results to differ materially from the results discussed in the forward-looking statements. There can be no assurance that forward-looking statements will prove to be accurate as actual outcomes and results may differ materially from those expressed in these forward-looking statements. Readers, therefore, should not place undue reliance on any such forward-looking statements. Further, these forward-looking statements are made as of the date of this communication and, except as expressly required by applicable law, we assume no obligation to publicly update or revise any forward-looking statement, whether as a result of new information, future events or otherwise.

Image of Arthur Erikson Place

Crestpoint Real Estate Investments Ltd. (in joint venture with Vestcor Inc.) KingSett and Reliance Properties Ltd., announced today that the iconic building, Arthur Erickson Place in Vancouver, BC has received the Canada Green Building Council’s (CAGBC’s) Zero Carbon Building – Performance Standard™ certification.

China’s economic woes partly reflect restrictive monetary policy. The latest money numbers suggest still-deteriorating prospects and urgent need for a policy reversal. It is unclear whether such a pivot is under way.

Two-quarter growth of nominal GDP (own seasonal adjustment) remained historically weak at 2.7% annualised in Q4, after 2.6% in Q3. Official real GDP numbers show a recovery in two-quarter growth from 3.6% annualised to 4.7%, so the implication is that GDP prices fell at a faster rate (1.9% annualised versus 1.0%) – see chart 1.

Chart 1

Chart 1 showing China Nominal & Real GDP (% 2q annualised)

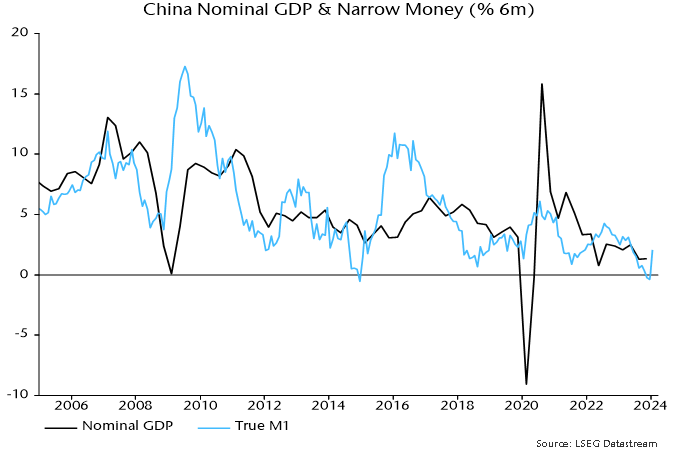
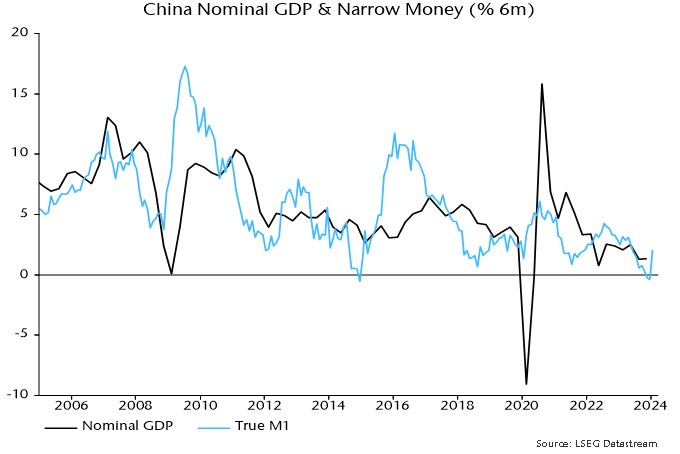
The stabilisation of two-quarter nominal GDP growth in H2 2023 mirrors sideways movement of six-month narrow and broad money growth during H1. Money trends, however, weakened sharply during H2, suggesting a further slowdown in nominal / real GDP in H1 2024 – chart 2.

Chart 2

Chart 2 showing China Nominal GDP & Narrow / Broad Money (% 6m)

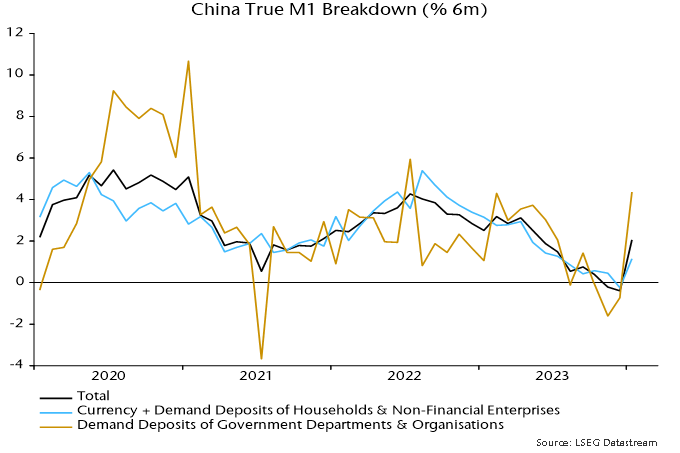
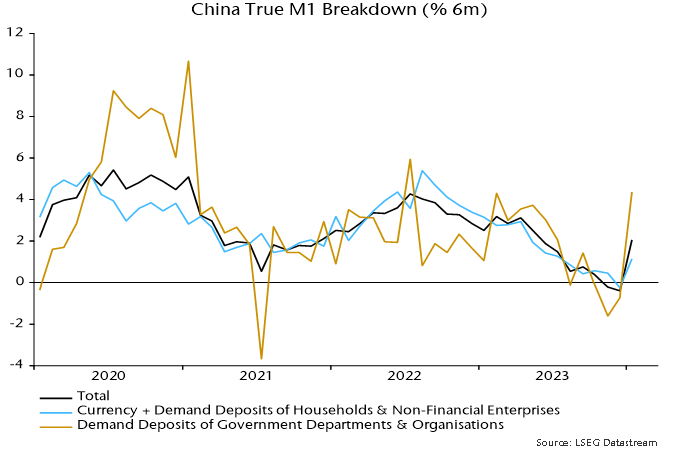
Six-month narrow money momentum turned negative in late 2023 and is challenging the record low reached at end-2014. Weakness then rang policy alarm bells, contributing to an aggressive easing shift in 2015 that succeeded in reflating the economy and stocks.

Monetary optimists note that broad money growth is above the level reached then and in the middle of its range in recent years. A widening narrow / broad money divergence, however, suggests a faster rate of decline of broad money velocity, plausibly related to structural weakness in real estate and lack of confidence in policy.

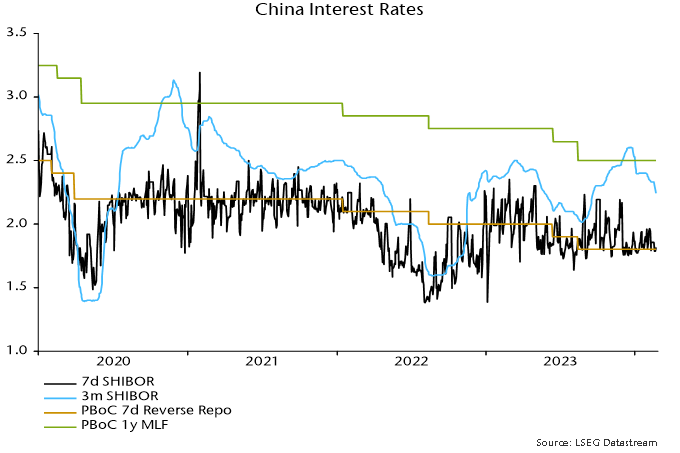
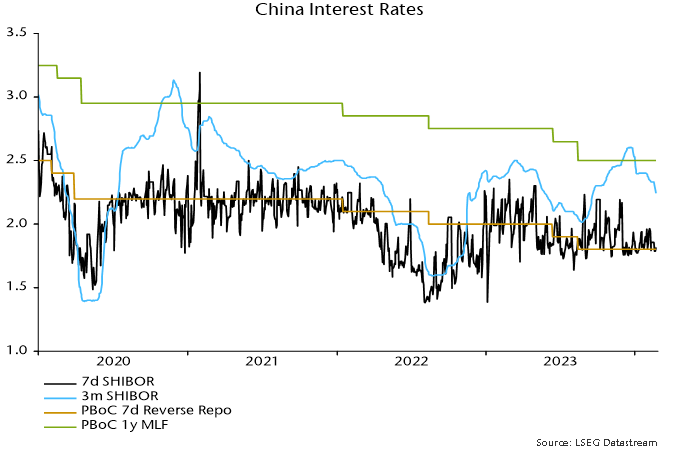
Will the economy and markets be rescued by 2015-style easing? Developments in 2023 don’t inspire hope. The PBoC loosened policy during H1 but a new upswing in term money rates began soon after the appointment of new Governor Pan Gongsheng in July, with three-month SHIBOR closing 2023 at a 32-month high – chart 3.

Chart 3

Chart 3 showing China Interest Rates

Another change under Governor Pan has been the suspension of publication of the PBoC’s informative quarterly surveys of entrepreneurs, consumers and bankers – the Q3 surveys were never released and Q4 results would normally have appeared by now.

A possible interpretation is that the PBoC has switched to prioritising currency stability, managing rates higher to discourage capital outflows while passing the baton of economic support to fiscal policy (and withdrawing from providing information on economic developments).

Foreign exchange reserves were boosted by valuation effects in late 2023 (weaker US dollar, rally in Treasuries) but settlements data suggest sustained intervention to support the currency during H2, consistent with a persistent sizeable forward discount on the offshore RMB – chart 4.

Chart 4

Chart 4 showing China Foreign Currency Reserves (mom change, $ bn)

Fiscal stimulus focused on government-directed investment is unlikely to be sufficient to reverse economic weakness without accompanying monetary accommodation to lift private sector confidence and broad money velocity.

Are there any signs of the PBoC pivoting back to easing? One glimmer is that its lending to the banking system continued to expand rapidly in late 2023, which, together with a slower rise in government deposits at the PBoC, resulted in the second-largest quarterly rise in bank reserves on record – chart 5.

Chart 5

Chart 5 showing China PBoC Balance Sheet (RMB trn, 3m change)

The PBoC’s injections, however, may have been intended to moderate rather than reverse the rise in money rates. Three-month SHIBOR eased in early January but has stalled since – chart 3. Recent renewed US dollar strength may bolster the hard-liners.

Aerial view of downtown Taipei, Taiwan. Financial district and business area with intersection or junction with traffic.

Summary

  • EM underperformed US and international markets through 2023 – posting a 10.3% return in USD terms versus 26.3% for the US, 18.9% for EAFE and 22.7% for Europe ex-UK.
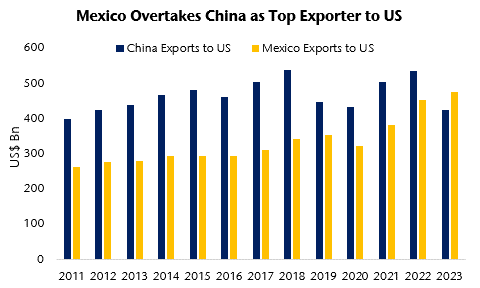
  • China was down 11% for the year, while Taiwan was up 31.3%, India 21.3%, Brazil 31.5% and Mexico 41.6%.
  • EM equities trade at 11.9x next 12m P/E against a 20-year average of 12.6x, while China trades at 9.3x against a 20-year average of 12.5x.
  • Brent crude closed the year at US$80 per barrel, pulling back sharply from its spike above US$90 in October following the outbreak of conflict between Israel and Hamas.
  • China held its Central Economic Work Conference in December, with top officials and economic advisers meeting to set growth targets for 2024. Government advisers have told the press that officials are targeting a range between 4.5% and 5.5%, with most favouring around 5% (the same as for 2023). The official target is set to be officially endorsed at the Two Sessions in March.
  • As reported in the Financial Times, BYD sold a record 526,000 battery-only EVs to Tesla’s 484,000 during the fourth quarter of 2023. This is the first time BYD has surpassed Tesla in quarterly sales.

“Goldilocks thinking”

Earlier this year, we emphasised our caution with respect to market expectations for the economy and inflation, warning that a Wile E. Coyote moment was a real risk for investors lured into the idea of a “miraculous disinflation” or “no landing” scenario. Bets on the combination of falling inflation, a resilient economy and rate cuts in 2023 were the fuel for a Santa rally propelling tech stocks and cyclicals.

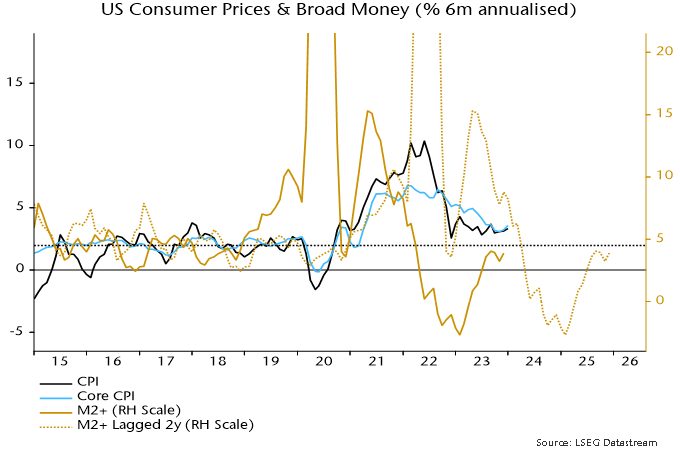
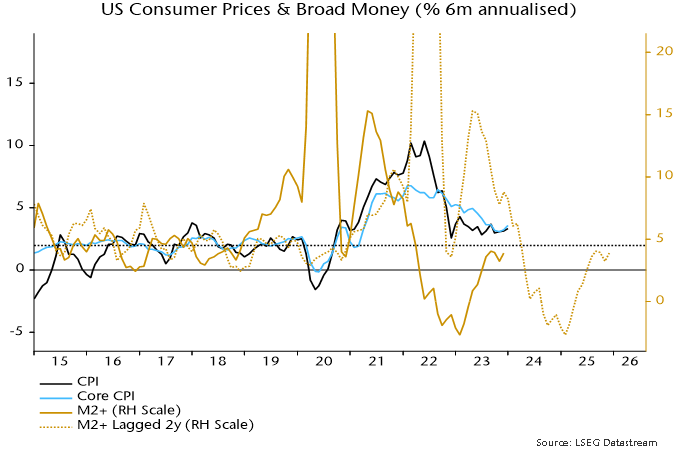
In line with our forecasts, inflation has fallen rapidly as suggested by broad money growth with the usual two-year lag. What has surprised us is the resilience of the US economy despite monetary tightening, which appears partly to reflect consumption driven by savings built up during the pandemic. Improvements in the global supply chain have also supported industrial production.

G7 inflation rates fell by more than most expected during 2023, mirroring a big decline in money growth during 2021 – inflation heading for an undershoot by end 2024

Source: NS Partners & Refinitiv Datastream.

Better inflation news has allowed the Fed to stay on hold since July despite strong Q3 GDP growth and a still-tight labour market. With inflation likely to continue to fall, investors are more hopeful of a soft landing coupled with rate cuts in 2024 and have rerated risk assets accordingly.

Based on the monetary and economic data that we track, our view is that market sentiment is excessively bullish and at risk of a correction. In his latest memo, Easy Money, published on January 9, Oaktree’s Howard Marks struck a similar tone, warning against “Goldilocks thinking”:

“At present, I believe the consensus is as follows:

  • Inflation is moving in the right direction and will soon reach the Fed’s target of roughly 2%.
  • As a consequence, additional rate increases won’t be necessary.
  • As a further consequence, we’ll have a soft landing marked by a minor recession or none at all.
  • Thus, the Fed will be able to take rates back down.
  • This will be good for the economy and the stock market.

Before going further, I want to note that, to me, these five bullet points smack of “Goldilocks thinking”: the economy won’t be hot enough to raise inflation or cold enough to bring on an economic slowdown.”

We certainly agree. While our analysis suggests that inflation has further to fall and rate cuts should be coming this year, global manufacturing PMI new orders are likely to decline further. Additionally, money trends are yet to suggest a significant subsequent recovery.

Economic “resilience” partly reflected pandemic catch-up effects, but is consistent with historical experience following monetary tightenings, suggesting greater H1 weakness

Source: NS Partners & Refinitiv Datastream.

G7 annual real narrow money momentum led industrial output momentum by an average 12m at major lows historically, suggesting that the full impact of recent weakness won’t be apparent until mid-2024.

We continue to believe that hard landings are possible in the US / Europe, with resilience to date not inconsistent with historical lags for monetary weakness and yield curve inversion. Against this backdrop, we expect quality and defensive sectors to outperform in the near term on a view that hopes of a soft landing may prove to be premature.

Taiwan’s DPP returned to the presidency but lose the legislature

Taiwan held elections on January 13, with William Lai Ching-te of the Democratic Progressive Party (DPP) winning the presidency, taking 40% of the vote against 33% for Hou Yu-ih of the Kuomintang (KMT) and 26% for Ko Wen-je of the Taiwan People’s Party (TPP).

Credibility on management of cross-strait relations to safeguard Taiwan’s democracy was a key issue, and the key factor behind the DDP presidency win. However, voters (particularly younger generations) expressed their dissatisfaction with the DDP on a host of domestic issues that cost the party its hold over the legislature, now controlled by the KMT. Issues include prohibitively expensive property prices, a rapidly ageing population (see chart below), stagnant wage growth and debate over the length and quality of military conscription.

Taiwan faces demographic headwinds

Source: CIA Factbook 2024.

In addition, a host of DPP officials have been caught up in scandals in recent years, including misuse of party funds, academic plagiarism by a legislator subsequently promoted by President Tsai to vice president of the government and an extramarital affair forcing another legislator to step down.

What does China make of it? While China has repeated the rhetoric that “reunification is inevitable”, the election result is unlikely to provoke any material military response from Beijing in the near term, although some PLA muscle-flexing is to be expected in the coming months. Predictably, the Party is claiming the result as a win from its perspective, pointing out that the result signals voter dissatisfaction in the electorate after eight years of DPP rule, with Lai’s win in part owing to Taiwan’s first past-the-post electoral system. The majority of voters went for the KMT (Beijing’s favoured candidate) and political upstart TPP.

Perhaps the most notable development was the rise of the TPP, founded less than five years ago by prominent surgeon and quirky political pragmatist Ko Wen-je. Clever rhetoric and deft use of social media was key for Ko to connect with younger voters, to foreground domestic issues in his campaign over relations with China, effectively counter-positioning with the DPP and KMT.

On China, Ko has shifted over the years from alignment with the DPP towards the KMT, arguing that Taiwan is part of a greater China while disagreeing with Beijing over which state should rule the territory.

Over the next term, Ko and his party have eight seats in the legislature, setting the TPP up as kingmaker to either the KMT with 52 seats or DPP with 51, and a pivotal player on issues such as energy policy, defence expenditure and kickstarting wage growth in the service sector.

Looking further ahead, the TPP may signal the breakdown of old, inherited voting patterns and the emerging base of young voters who identify primarily as Taiwanese but, at least for now, are more focused on domestic economic, social and political issues.

Hand flipping wooden blocks from 2023 to 2024, text on table.

The start of 2023 was marked by caution, largely influenced by the prior year’s market environment that witnessed several firsts. 2022 was the first time investors faced double-digit negative returns from both equity and traditional fixed income investments in a calendar year. Many defined benefit (DB) pension plans also experienced a rapid change in their financial health, moving from deficits to meaningful surpluses despite the challenging markets. Returns in 2023 have bounced back strongly, though not without many twists and turns. This article reflects on 2023 and offers insights for the year ahead.

Interest rate surprise

The rapid rise in interest rates surprised many investors and the impact varied among investor types. Investors with a total-return goal, such as endowments, foundations and Indigenous trusts, saw portfolio market values drop in 2022 due to negative returns in both equities and fixed income. In contrast, despite negative asset returns, many DB pension plans saw their deficits replaced by surpluses as the decrease in liabilities outpaced asset declines.

Higher yields implied more favourable longer-term returns for fixed income, and discussions in 2023 shifted from the past focus of reducing fixed income allocations towards assessing the merits of increasing allocations for all investor types.

Balancing act

For total return-oriented entities like endowments, foundations and Indigenous trusts, an improved fixed income outlook was welcome. However, historical data suggests that higher fixed income yields can indicate lower equity market returns (see “crystal ball challenge” below).

Registered charities are dealing with the added impact of an increase in the minimum annual distribution quota (DQ) requirement from 3.5% to 5.0% introduced in 2023. This change could lead charities to target higher returns or accept a lower margin of additional return to meet the higher DQ.

The prospect of higher fixed income returns and potentially lower equity returns provided an opportunity for investors to reassess their asset mix strategy to ensure alignment with their goals, particularly if their fixed income allocation has been historically low or well below target allocations.

Opportunity knocks

The start of 2023 brought significant improvement to the financial well-being of many DB plans, after decades of additional contributions to counteract the adverse effects of declining interest rates and subsequent stronger growth of the liabilities compared to the asset growth. The better financial position provided an opportunity to revisit long-term asset mix strategies and risk levels.

The specific actions of DB plans depend on the plan type (e.g., corporate, university or public), actuarial liability measures that drive risk assessments, and other factors such as whether the DB plan is open or closed to new members, and plan maturity (e.g., percentage of active members versus retiree and deferred members). At a minimum, for plans that found themselves in a healthier funded position, there was a strong case for discussing the merits and trade-offs of de-risking.

While it’s unclear to what extent DB plans took the opportunity to de-risk and shift towards higher fixed income allocations, there was an uptick in fixed income search activity in the latter part of 2023, possibly indicating a trend by committees towards reassessing their asset mix strategy. However, the market roller coaster ride in 2023 was evident in both fixed income and equities. Longer-term bond yields experienced further increases at the end of the third quarter and into the start of the fourth quarter, but then yields subsequently declined leading to longer-dated fixed income investments bouncing back very strongly and achieving returns higher than major equity markets. The higher fixed income returns are likely a reflection that liabilities over the fourth quarter increased more than the assets and reduced some of the previous improvement in DB plans’ funded position.

One form of risk management that has continued unabated is de-risking through annuity purchases, especially in corporate DB plans, where the transaction can reduce the impact of DB plans on a company’s balance sheets. Many companies that chose the annuity purchase route for de-risking did so when inflation was low. Depending on the extent of built-in inflation-related pension increases, these companies might face pressure from retirees for ad-hoc pension increases given the higher inflation environment. Under a buy-out annuity, the structure is such that post-transaction there’s no longer a dedicated pool of assets with the plan sponsor for members captured under the buy-out, implying the only source of funding for ad-hoc increases would be the company’s balance sheet.

Tech titans increase market concentration

In 2023, equity returns were dominated by U.S. mega-cap stocks, particularly in the information technology sector, which benefited from investor exuberance around artificial intelligence (AI) and added to the concentration challenges of the bellwether S&P 500 Index. As shown in Figure 1, the S&P 500 Index’s top-10 holdings represented almost a third of the Index at the end of 2023.

Figure 1: Weight of top-10 holdings in the S&P 500 Index

Source: Connor, Clark & Lunn Financial Group and S&P Global Market Intelligence.

U.S. equities typically represent the largest individual component of many investors’ portfolios. Upcoming committee meetings should include discussions on the increasing concentration in the U.S. equity market. This isn’t to say the U.S. technology sector won’t continue to perform well over the next decade. However, it’s prudent to consider the benefits of diversifying the portfolio and to evaluate options for managing potential downside risks should negative outcomes unfold.

While diversification within equity markets is one option, such as leveraging the lower correlation merits of emerging markets compared to developed markets or pairing a value investment style with a growth portfolio, diversifying through fixed income and private market investments may be more advantageous. Therefore, any diversification strategy should include a broad set of investment opportunities and extend beyond equities.

Mixed experience from private markets

Over the past 10 years or so, private markets have experienced significant inflows from institutional investors. In 2023, the returns across various private markets have been mixed. Commercial real estate made most of the headlines for two reasons. First, there was the lingering impact from the COVID-19 pandemic on the office sector, leading to decreased market valuations. Secondly, some commercial real estate managers had liquidity issues, delaying divestiture requests. Other real estate sectors performed well, helping to offset office sector declines in diversified portfolios and contributing to a more optimistic market outlook for 2024 and longer term.

Private equity markets were also challenged in 2022/2023, but the forecast for 2024 and beyond is much more positive. In contrast, the infrastructure market was a standout performer in 2023 and appears well-positioned for the future. Infrastructure is increasingly seen as crucial for supporting clean energy projects and reducing reliance on carbon-intensive assets as part of global efforts to address climate risk. A successful energy transition will require extensive new infrastructure globally, focused on renewable energy sources.

The crystal ball challenge

Forecasting returns is no easy task. For example, a Horizon Actuarial Services survey of U.S. investment managers and consultants found that they significantly underestimated the strength of the U.S. equity market for the 10-year period ending December 31, 2022, and overestimated the weaker returns of emerging markets. The average annualized U.S. equity return projection was 5.9%, compared to the actual return of 12.6%. Emerging market equities were expected to return 7.5% but delivered just 1.8% (all returns in U.S. dollars).

There is, however, a historical correlation between yield levels and the outlook for equity market returns. Figure 2 illustrates the distribution of 10-year historical returns for the S&P 500. The green bars represent periods where U.S. government 10-year bond yields at the start of the 10-year period were below 3.5%, while the gold bars show returns when starting yields were between 3.5% to 5%. For example, when the yields were below 3.5%, around 20% of returns were around 17.5%. The overall average annualized S&P 500 return when yields were below 3.5% was 10.8%. Conversely, when yields were higher, such as the end of 2023, the average annualized Index return was 6.7%.

Figure 2: U.S. equity returns depending on the level of fixed income yields

Source: Connor, Clark & Lunn Financial Group.

Despite the recent decline in yields, longer-term return expectations for fixed income remain higher than what we’ve seen in a while. The level of yield at the time of writing also indicates the potential for lower long-term equity returns compared to previous strong performance.

For private markets, it is difficult to generalize since the outlook is heavily influenced by the specific strategy in which you’re invested. It’s therefore important to engage with your private market managers to understand their return expectations and assess the risk of liquidity constraints, like those recently seen in some commercial real estate strategies.

In other private markets, such as private debt, the current environment has likely enhanced its relative return potential, possibly attracting increased interest from all investor types. As noted earlier, the emphasis on energy transition to address climate risk will likely boost interest in specialized energy infrastructure strategies. Present conditions also provide an opportunity to consider more liquid, higher-yielding assets, such as commercial mortgages, that can take advantage of current higher rates.

2024: Steering through uncertainty

As your committee reviews 2023 performance, there should be welcome relief from strong positive total portfolio returns. For DB plans considering a de-risking strategy, the fourth quarter was a reminder that the opportunity to take advantage of a healthier financial position was not timeless and that there are scenarios where lower yields (and subsequent increases in liabilities) could prevail.

The top-performing market in 2023 was the U.S. equity large-cap market that was a beneficiary from the enthusiasm around AI. While the positive impact of technological innovation may persist, it’s up against a challenging economic, social and political backdrop, along with associated uncertainties. Geopolitical risks, including the U.S. election, conflicts in the Middle East and Europe, and the U.S.-China rivalry could significantly affect shorter-term market outlooks in 2024.

Given the various dynamics highlighted, ensure that committee meeting discussions focus on confirming whether your risk-return profile aligns with your objectives.

Subscribe for updates

The money and cycles forecasting approach suggested that global inflation would fall rapidly during 2023 but at the expense of significant economic weakness. The inflation forecast played out but activity proved more resilient than expected. What are the implications for the coming year?

One school of thought is that economic resilience will limit further inflation progress, resulting in central banks disappointing end-2023 market expectations for rate cuts, with negative implications for growth prospects for late 2024 / 2025.

A second scenario, favoured here, is that the economic impact of monetary tightening has been delayed rather than avoided, and a further inflation fall during H1 2024 will be accompanied by significant activity and labour market weakness, with corresponding underperformance of cyclical assets.

The dominant market view, by contrast, is that further inflation progress will allow central banks to ease pre-emptively and sufficiently to avoid material near-term weakness and lay the foundation for economic acceleration into 2025.

On the analysis here, the second scenario might warrant a two-thirds probability weighting versus one-sixth for the first and third. This assessment reflects several considerations.

First, on inflation, developments continue to play out in line with the simplistic “monetarist” proposition of a two-year lead from money to prices. G7 annual broad money growth formed a double top between June 2020 and February 2021 – mid-point October 2020 – and declined rapidly thereafter. Annual CPI inflation peaked in October 2022, falling by 60% by November 2023 – chart 1.

Chart 1

Chart 1 showing G7 Consumer Prices & Broad Money (% yoy)

Broad money growth returned to its pre-pandemic average in mid-2022 and continued to decline into early 2023. The suggestion is that inflation rates will return to targets by H2 2024 with a subsequent undershoot and no sustained revival before mid-2025.

Secondly, economic resilience in 2023 partly reflected post-pandemic demand / supply catch-up effects. On the demand side, an analytical mistake here was to downplay the supportive potential of an overhang of “excess” money balances following the 2020-21 monetary explosion. Globally, this excess stock has probably now been eliminated – chart 2.

Chart 2

Chart 2 showing Ratio of G7 + E7 Narrow Money to Nominal GDP June 1995 = 100

The moderate economic impact of monetary tightening to date, moreover, is consistent with historical experience. Major lows in G7 annual real narrow money momentum led lows in industrial output momentum by an average 12 months historically – chart 3. With a trough in the former reached as recently as August 2023, economic fall-out may not be fully apparent until H2 2024.

Chart 3

Chart 3 showing G7 Industrial Output & Real Narrow Money (% yoy)

The suggestion that economic downside is incomplete is supported by a revised assessment of cyclical influences. The previous hypothesis here was that the global stockbuilding cycle would bottom out in late 2023 and recover during 2024. Recent stockbuilding data, however, appear to signal that the cycle has extended, with a recovery pushed back until H2 2024.

The assumption of a late 2023 trough was based on a previous low in Q2 2020 and the average historical cycle length of 3 1/3 years. This seemed on track at mid-2023: G7 stockbuilding had crossed below its long-run average in Q1, consistent with a trough-compatible level being reached in H2 – chart 4. The downswing, however, was interrupted in Q2 / Q3, with a further decline likely to be necessary to complete the cycle and form the basis for a recovery.

Chart 4

Chart 4 showing G7 Stockbuilding as % of GDP (level)

A resumed drag from stockbuilding may be accompanied by a further slowdown or outright weakness in business investment, reflecting recent stagnation in real profits – chart 5. Capex is closely correlated with hiring decisions, so this also argues for a faster loosening of labour market conditions.

Chart 5

Chart 5 showing G7 Business Investment (% yoy) & Real Gross Domestic Operating Profits (% yoy)

Real narrow money momentum remains weaker in Europe than the US, suggesting continued economic underperformance and a more urgent need for policy relaxation – chart 6. Six-month rates of change are off the lows but need to rise significantly to warrant H2 recovery hopes. Globally, the US / European revivals have been partly offset by a further slowdown in China, suggesting still-weakening economic prospects.

Chart 6

Chart 6 showing Real Narrow Money (% 6m)

The frenetic rally of the final two months resulted in global equities delivering a strong return during 2023 despite the two “excess” money indicators tracked here* remaining negative throughout the year. The indicators, however, started flashing red around end-2021, since when the MSCI World index has slightly underperformed US dollar cash.

Historically (i.e. since 1970), equities outperformed cash on average only when both indicators were positive, a condition unlikely to be met until mid-2024 at the earliest.

The late 2023 rally was led by cyclical sectors as investors embraced a “soft landing” scenario. Non-tech cyclical sectors ended the year more than one standard deviation expensive relative to history versus defensive ex. energy sectors on a price / book basis – chart 7. Current prices appear to discount an early / strong PMI recovery, which the earlier discussion suggests is unlikely.

Chart 7

Chart 7 showing MSCI World Cyclical ex Tech* Relative to Defensive ex Energy Price / Book & Global Manufacturing PMI New Orders *Tech = IT & Communication Services

Quality stocks outperformed during 2023, reversing a relative loss in 2022 and consistent with the historical tendency when “excess” money readings were negative. Earlier underperformance partly reflected an inverse correlation with Treasury yields, a relationship now suggesting further catch-up potential.

Contributing factors to the dramatic underperformance of Chinese stocks during 2023 include excessively optimistic post-reopening economic expectations at end-2022 and unexpectedly restrictive monetary / fiscal policies. MSCI China is at a record** valuation discount to the rest of EM – chart 8 – while monetary / economic weakness suggests an early policy pivot.

Chart 8

Chart 8 showing MSCI China Price / Book & Forward P / E Relative to MSCI EM ex China

A key issue for 2024 is the extent to which central bank policy easing will revive money growth. While inflation is expected to trend lower into early 2025, the cycles framework suggests another upswing later this decade – the 54-year Kondratyev price / inflation cycle last peaked in 1974. Aggressive Fed easing 54 years ago – in 1970 – pushed annual broad money growth into double-digits the following year, creating the conditions for the final Kondratyev ascent. Signs that a similar scenario is playing out would warrant adding to inflation hedges.

*The differential between G7 plus E7 six-month real narrow money and industrial output momentum and the deviation of 12-month real narrow money momentum from a long-term moving average.

**Since June 2000. MSCI China included only B-shares through May 2000, when red chips and H-shares were added.

Corporate businesspeople shaking hands in an office.

Recent market movements have been driven by a decline in bond yields and a repricing of a more optimistic scenario, where growth is resilient and inflation figures are falling fast. While mid-term trends look supportive, persistently high inflation could point to later interest rate cuts than markets currently expect.

Small caps shine in Europe

We believe that growth will remain steady in 2024 despite potential economic contractions in some regions during the first half of the year. European small caps continue to look attractive compared to their larger counterparts. As illustrated below, small caps are near their largest historical discount relative to large caps. Several industries still trade at very low valuations and could benefit from a potential re-rating. We believe the end of the destocking phase combined with lower interest rates should help in regaining momentum for European small caps.

P/E of STOXX small caps vs STOXX large caps

Source: Goldman Sachs.

Wage growth: a silver lining

Real wage growth is another indicator showing positive signs. An increase in wage growth could be beneficial for consumers and the broader economy. Companies’ responses to growing labour costs will be a key determinant for financial markets in 2024. Companies with strong pricing power should be able to raise prices again. Others might scale back labour, cut investments or accept lower profits. In summary, we expect earnings growth to be erratic and modest in 2024.

Factor investing in a dry liquidity climate

Regarding factor investing, liquidity has dried up in 2023 and small caps are underinvested in compared with other asset classes. According to JP Morgan, small caps in Europe have experienced their worst 23-month outflows in the last 15 years. However, November’s positive inflows may indicate a shift toward a more optimistic sentiment. A return to more normalized monetary policy should gradually improve liquidity and investment flows during 2024. Much like the adage “cash is king,” investors are likely to continue rewarding companies with decent dividends and buybacks.

M&A: the untapped potential for small caps

M&A activity is another potential catalyst that would favour smaller companies. M&A in 2023 has been low, as shown by the chart below, with a 70% decrease primarily due to fewer foreign buyers. Corporate sentiment, equity valuations and monetary conditions are key drivers of M&A activity. Reasonable equity valuations along with a normalizing monetary policy should enhance corporate sentiment toward M&A. With positive sentiment and plenty of balance sheet resources, a potential pickup in M&A could greatly benefit smaller companies.

Sources: Goldman Sachs, Bloomberg.

Navigating tomorrow’s market

As small caps gain traction and M&A activity hints at resurgence, the market presents a complex puzzle. The real insight emerges in piecing together these fragments to understand where the next wave of growth will come from.