Money Moves Markets
Weaker US monetary data
February 29, 2024 by Simon Ward
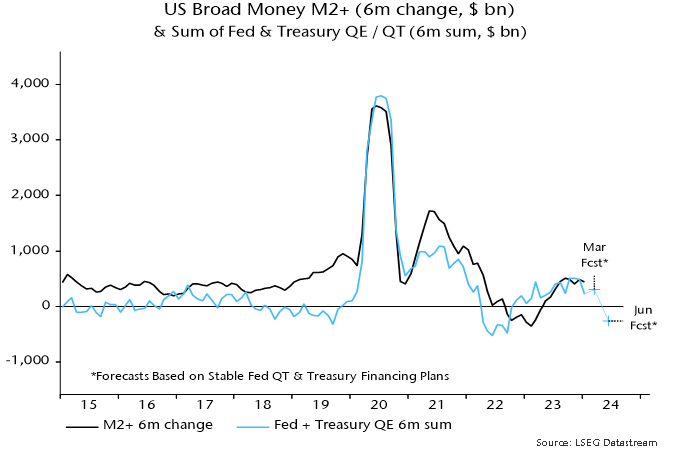
US monetary conditions eased during H2 2023, reflecting the Treasury’s decision to skew debt issuance towards bills and the Fed’s December pivot. This loosening is now reversing, partly because of the recent sticky inflation scare and associated back-up in yields, and prospectively as the Treasury scales back bill financing in Q2.
January monetary statistics are consistent with a turnaround. The narrow M1A measure followed here contracted by 1.4% on the month, more than reversing a 1.0% December gain. Broad money M2+ stagnated after a 0.8% December rise*.
Six-month M2+ growth appears to be rolling over in line with the forecast in a previous post – see chart 1. To recap, sales of Treasury bills to money funds should continue to offset the monetary impact of the Fed’s QT during Q1 but the Treasury’s plans to redeem bills in Q2 imply a dramatic contractionary shift – unless the Fed simultaneously halts QT.
Chart 1
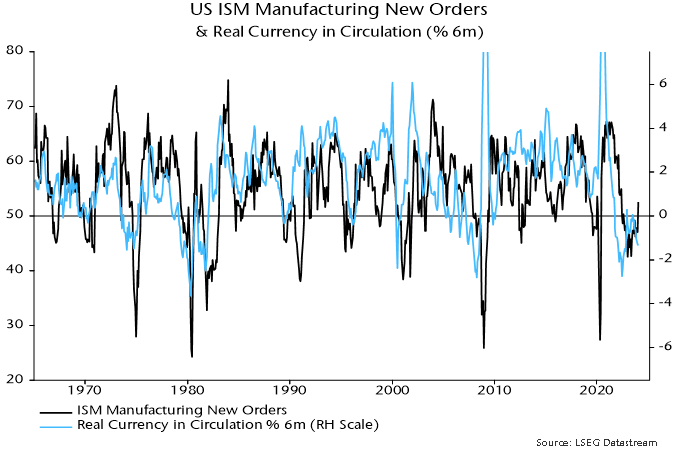
Prospective monetary weakness poses a threat to risk assets and could coincide with economic news that derails the current soft / no landing consensus. This consensus has been bolstered by a recent pick-up in the ISM manufacturing new orders index, a widely-watched cyclical indicator. A post in July signalled a coming ISM rebound but suggested that it would prove temporary.
That remains the base-case view here. A relapse is expected in reflection of global real narrow money weakness into last autumn and on the view that the 2022-23 stockbuilding cycle downswing has yet to reach a final low.
US six-month real narrow money momentum has led swings in ISM new orders historically. The currency component has displayed a slightly stronger correlation than the aggregate, probably because of a linkage with retail goods spending – chart 2. Real currency momentum signalled the current ISM recovery but has been moving lower since last summer. January retail sales weakness may have been more than weather-related and the ISM recovery may be about to abort.
Chart 2
*M1A = currency in circulation plus demand deposits. M2+ = M2 plus large time deposits at commercial banks and institutional money funds.