The Fed’s quarterly financial accounts provide information on sector money trends and funds flows. Several features of the Q4 accounts, released last week, are noteworthy.

First, net retirement of equities by non-financial corporations (via buy-backs and cash take-overs) reached a record dollar amount ($270 billion) in Q4, confirming that corporate buying was a key driver of the year-end rally – see chart 1.

Chart 1

Chart 1 showing US Non-Financial Corporations: Net Retirement of Equities ($ bn)

The rise in equity purchases followed strong growth of non-financial business broad money holdings in the year to end-Q3, discussed in a previous post. Such holdings, however, contracted slightly in Q4, pulling annual growth down from 10.6% to 6.2% – chart 2.

Chart 2

Chart 2 showing US Broad Money Holdings by Sector (% yoy)

Financial business money holdings had surged in the year to end-Q1 2023, perhaps partly reflecting cash-raising related to equity market weakness in 2022. These balances were run down during H2, though still finished the year slightly higher than at end-2022.

The recent weaker trends in non-financial and financial business money suggest less buying support for equities and other risk assets going forward.

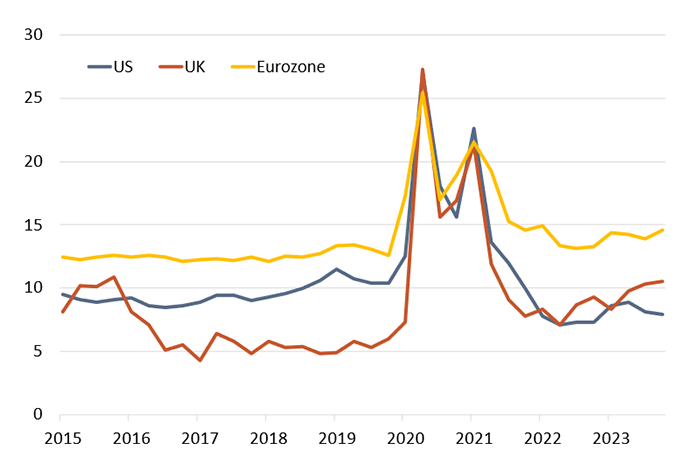
Household broad money, by contrast, rose solidly in Q4, resulting in the annual change returning to positive territory. The ratio of money holdings to disposable income recovered slightly following six consecutive quarterly declines, remaining above its pre-pandemic trend, in contrast to shortfalls for corresponding Eurozone and UK ratios – chart 3.

Chart 3

Chart 3 showing Household Broad Money to Disposable Income Ratios

The Q4 financial accounts also contain initial estimates of corporate profits and gross domestic income (GDI). Profits after tax adjusted for stock appreciation and economic depreciation rose at a 2.5% annualised rate last quarter and remain below a peak reached in Q3 2022 – chart 4, blue line. The range-bound movement is consistent with S&P 500 earnings data and questions perceptions of economic / profits strength.

Chart 4

Chart 4 showing US National Accounts Corporate Profits & S&P 500 Aggregate Earnings ($ bn)

GDI is an alternative estimate of GDP and has consistently lagged the headline expenditure-based measure in recent quarters – see previous post. It did so again in Q4, rising at a 1.9% annualised rate versus headline GDP growth of 3.2% – chart 5. GDI grew by just 1.2% in the year to Q4.

Chart 5

Chart 5 showing US GDP / Gross Domestic Income (% qoq annualised)

Sunset view of high voltage electricity towers on the shoreline of San Francisco bay area; California.

It’s no secret that the US electrical grid is in a dire state now more than ever. Most of the infrastructure we see today was built in the 1960s and 1970s, with over 70% being more than 25 years old. Marked by significant and consistent underinvestment, the US grid continues to experience increasing supply disruptions, blackouts and fire incidents. Maintenance and repair are perpetual needs. A notable example of maintenance disrepair happened last year with the Hawaiian Electric fire. In August 2023, Maui County sued Hawaiian Electric, the state’s largest supplier of electricity, accusing the utility of negligence in what became the deadliest US fire in over a century resulting in thousands of acres burned and over 100 fatalities.

The push for electrification

Additionally, with rising population levels and the ongoing push for electrification, the grid is ill-equipped to manage the volume of electricity being transmitted through existing power lines. Electricity demand in the US is expected to increase by 18% by 2030 and 38% by 2035. This increased electricity transmission will be driven by the transition to electric vehicles as well as the build out of carbon-neutral energy sources, namely renewables.

Facing the future: investment and innovation

To meet the rising demand and supply of electricity, significant augmentation and expansion of the current grid, with substantial resources invested, will be necessary. Several states have already announced massive investment projects to address these needs. Notably, in October 2023, the Biden-Harris administration announced a USD$3.5 billion funding initiative for 58 projects across 44 states for grid infrastructure, signalling the beginning of extensive future investments. The International Energy Agency estimates that, by the end of the decade, over $600 billion a year will need to be invested globally to ensure a resilient supply of clean and reliable electricity. In fact, from 2020 to 2023, global grid investments have grown from USD$285 billion to over USD$310 billion.

Bar chart showing growth of energy transition investment, 2004 to 2023.

Source: BNEF

These developments make the grid infrastructure trend one we are closely watching as we seek to identify companies poised to benefit from this theme.

Nexans: a catalyst for change

One such company is Nexans (NEX FP), a recent addition to our portfolio that stands to gain from escalating investment in US grid infrastructure over the next decade. A France-based cable manufacturer with a significant presence in the US, Nexans specializes in producing high, medium and low voltage transmission cables and serves a variety of end markets.

Several years ago, recognizing the global trend towards electrification, Nexans decided to realign its portfolio to become a pure electrification player by 2024, committing to divest from three divisions unrelated to this goal, namely telecom, auto harness and a portfolio of small unrelated segments.

2023 marked a transition year for the company as it intensified its refocus efforts. This was met by some volatility in its stock price due to a challenging market environment that made divestment difficult along with uncertainties in offshore wind markets. However, the company has recently shown significant progress and is delivering on its portfolio transition ahead of schedule. Moreover, offshore wind markets in the US are experiencing renewed positive sentiment, evidenced by strong auction prices that de-risked them last week. Nexans’ stock price has rebounded from a multiyear low in October 2023 to a multiyear high and we remain optimistic about the company’s future prospects and its successful transition to full electrification.

Hands holding freshly roasted aromatic coffee beans.

Coffee is one of the most valuable agricultural commodities and the most widely used socially acceptable drug, yet few people take the time to understand its significance in modern society and human history. Originating from an Ethiopian mountainside a couple of thousand years ago, today’s coffee market sustains roughly 125 million jobs. With its total addressable market estimated at $468 billion, it’s on track to outpace global GDP, fueled by rising per capita consumption in emerging markets.

Medicinal luxury to cultural staple

Initially, coffee in Europe was a medicinal luxury for the elite. As it became more accessible, it gradually became the favoured drink of both blue- and white-collar workers, embedding itself in Western culture. The first English coffeehouse opened at Oxford University in 1650. By 1700, there were over 2,000 coffeehouses paying more rent than any other trade at the time. Coffee’s exploding popularity can be attributed to the historical British reputation for alcohol consumption; coffee presented a healthier alternative that still offered a communal space for socializing – and it helped with hangovers.

Coffee’s political and economic influence

In 18th century Germany, its popularity even led Frederick the Great to ban it to curb the outflow of money abroad and promote beer, Germany’s traditional beverage. This prohibition spurred a flourishing black market and large-scale protests that lasted four years before being revoked. The impact of coffee in England and Germany, however, pales in comparison to its role in shaping American culture and history.

Coffee and the American Revolution

The famous Boston Tea Party is often cited as the tipping point of coffee in the US. Americans were already avid consumers of tea, coffee and beer at the time and most taverns and coffeehouses offered all three options to their patrons. In an act of defiance against King George’s tea tax, Americans embraced coffee as a symbol of independence, significantly boosting its consumption. From 0.19 pounds per capita in 1772 to 1.41 pounds by 1799, coffee became intertwined with the fabric of the nation, a trend that has only grown stronger with time.

Why coffee captures our attention

So, why is Global Alpha excited about coffee? Are we investing in coffee beans? If you’ve been reading our commentaries for a while, you’ll know that we often seek creative and sometimes indirect exposure to secular themes that we favour. Like most commodities, coffee is a volatile and hard to predict market prone to oversupply and weather events – areas outside our expertise. Instead, we are invested in a company that provides tools for coffee enthusiasts to enjoy their drinks precisely as they want to.

Brewing success in the coffee appliance market

De’Longhi SpA (DLG IM) is an Italian global leader in the production of small domestic appliances, with a market-leading position among European coffee makers. The company designs its premium products in-house and its brand appeal is best-in-class, boasting a 35% global market share in the espresso coffee machine segment. It’s fitting that a company like De’Longhi originated in Europe, where per capita coffee consumption is the world’s highest.

Local success to global expansion

De’Longhi’s initial success lent strong credibility to its brands and has helped accelerate its global expansion in the last decade, especially in the US and Far East markets. Historically, the company sold professional coffee makers through its Eversys brand, but in December it announced the acquisition of La Marzocco to accelerate its leadership in the professional segment. The professional coffee-making market alone is a $5 billion industry growing at approximately 5% annually, driven by a long-term shift from making coffee at home to buying it from coffee shops. Starbucks for example plans to expand its current 38,000 stores to over 55,000 by 2030. This acquisition enables De’Longhi to cover virtually the entire coffee machine space, from budget-friendly to luxury household and high-output professional machines.

De’Longhi SWOT analysis

Strengths

  • Brand recognition in espresso machines (De’Longhi) and food preparation (Kenwood/nutribullet).
  • Strong distribution partnerships globally and owned manufacturing capacity.

Weaknesses

  • The household appliance market is highly competitive.
  • Consumer habits and preferences for coffee consumption are continuously evolving.

Opportunities

  • Expansion of the professional coffee segment following the acquisition of La Marzocco.
  • Opportunities for product innovation.

Threats

  • Consolidation of the distribution market.
  • Valuation of potential M&A targets.

Brewing beyond the bean

Most of our weekly readers, much like ourselves, are probably coffee consumers, yet many of us spend little time thinking about this beverage we crave each morning. This “taken-for-granted” product represents exactly the kind of space Global Alpha aims to invest in for the long term.

Source: Pendergrast, M. (2010). Uncommon Grounds: the history of coffee and how it transformed the world.

US monetary conditions eased during H2 2023, reflecting the Treasury’s decision to skew debt issuance towards bills and the Fed’s December pivot. This loosening is now reversing, partly because of the recent sticky inflation scare and associated back-up in yields, and prospectively as the Treasury scales back bill financing in Q2.

January monetary statistics are consistent with a turnaround. The narrow M1A measure followed here contracted by 1.4% on the month, more than reversing a 1.0% December gain. Broad money M2+ stagnated after a 0.8% December rise*.

Six-month M2+ growth appears to be rolling over in line with the forecast in a previous post – see chart 1. To recap, sales of Treasury bills to money funds should continue to offset the monetary impact of the Fed’s QT during Q1 but the Treasury’s plans to redeem bills in Q2 imply a dramatic contractionary shift – unless the Fed simultaneously halts QT.

Chart 1

Chart 1 showing US Broad Money M2+ (6m change, $ bn) & Sum of Fed & Treasury QE / QT (6m sum, $ bn)

Prospective monetary weakness poses a threat to risk assets and could coincide with economic news that derails the current soft / no landing consensus. This consensus has been bolstered by a recent pick-up in the ISM manufacturing new orders index, a widely-watched cyclical indicator. A post in July signalled a coming ISM rebound but suggested that it would prove temporary.

That remains the base-case view here. A relapse is expected in reflection of global real narrow money weakness into last autumn and on the view that the 2022-23 stockbuilding cycle downswing has yet to reach a final low.

US six-month real narrow money momentum has led swings in ISM new orders historically. The currency component has displayed a slightly stronger correlation than the aggregate, probably because of a linkage with retail goods spending – chart 2. Real currency momentum signalled the current ISM recovery but has been moving lower since last summer. January retail sales weakness may have been more than weather-related and the ISM recovery may be about to abort.

Chart 2

Chart 2 showing US ISM Manufacturing New Orders & Real Currency in Circulation (% 6m)

*M1A = currency in circulation plus demand deposits. M2+ = M2 plus large time deposits at commercial banks and institutional money funds.

Business team investment trading in a monitoring room on desktops with screens showing stock market data.

In May 2024, US and Canadian markets will be moving to T+1 settlement cycle. As we transition to the shorter settlement cycle, we believe it is important for you to be aware of this upcoming change and the preparation CC&L has been making, alongside our industry partners.

Below are answers to common questions to help you understand the upcoming T+1 settlement transition, as well as the work we are doing to prepare for it.

What is T+1 settlement?

T+1 settlement refers to the process where securities transactions are completed one business day after a trade has been executed. Currently, in Canada, the US and Mexico, the standard is to settle these transactions two days after the trade (i.e., T+2).

Which markets are moving to T+1?

The US and Canadian markets are planning to switch to T+1 settlement over the Memorial Day weekend between May 25 and May 28, 2024. Mexico wants to make this change to align with the US, but is waiting for regulatory approval.

Europe and the UK are also looking to compress their securities settlement cycle. The Association for Financial Markets in Europe (AFME) established a T+1 industry taskforce in March 2023 and the UK formed a similar group called the Accelerated Settlement Taskforce in December 2022. However, neither Europe nor the UK has set a date for when they might move to T+1 settlement.

What is the live date for T+1 settlement in Canada and the US?

Canada settlement cycle T+1 transition timeline

Friday
May 24, 2024
Saturday
May 25, 2024
Sunday
May 26, 2024
Monday
May 27, 2024
Tuesday
May 28, 2024
Wednesday
May 29, 2024
Thursday
May 30, 2024
Last T+2 trade date Conversion weekend Conversion weekend First T+1 trade date Double settlement date Trade and settle T+1 Trade and settle T+1
Friday
May 24, 2024
Last T+2 trade date
Saturday
May 25, 2024
Conversion weekend
Sunday
May 26, 2024
Conversion weekend
Monday
May 27, 2024
First T+1 trade date
Tuesday
May 28, 2024
Double settlement date
Wednesday
May 29, 2024
Trade and settle T+1
Thursday
May 30, 2024
Trade and settle T+1


US settlement cycle T+1 transition timeline

Friday
May 24, 2024
Saturday
May 25, 2024
Sunday
May 26, 2024
Monday
May 27, 2024
Tuesday
May 28, 2024
Wednesday
May 29, 2024
Thursday
May 30, 2024
Last T+2 trade date Conversion weekend Conversion weekend Markets closed
conversion weekend
First T+1 trade date Double settlement date Trade and settle T+1
Friday
May 24, 2024
Last T+2 trade date
Saturday
May 25, 2024
Conversion weekend
Sunday
May 26, 2024
Conversion weekend
Monday
May 27, 2024
Markets closed
conversion weekend
Tuesday
May 28, 2024
First T+1 trade date
Wednesday
May 29, 2024
Double settlement date
Thursday
May 30, 2024
Trade and settle T+1


What are the benefits of T+1 settlement?

Moving to T+1 settlement has several advantages. According to the Securities Exchange Commission (SEC), it makes trading safer by shortening the time between making and settling a trade. This also helps protect investors and makes the trading process more efficient. A faster settlement time can lower credit and counterparty risk and collateral costs and increase market liquidity. It can also help reduce broker-dealer margin and collateral requirements.

What makes the move to T+1 distinct from previous settlement date compressions?

The shift to T+1 settlement is different and more complicated than past changes, such as the move from T+3 to T+2 in 2017, with a more aggressive timeline involving more complex technology and process updates. The previous change was a joint decision by the industry and regulators to make clearing and settlement safer and better coordinate with EU and UK trade lifecycle timelines. The move to T+1 is being driven by specific events and is mandated by the SEC, making it more challenging for market participants.

What are the key challenges in switching to T+1 settlement?

Moving to T+1 settlement brings up several challenges. First, while it reduces risk for those selling securities, it increases the work and potential for error on the buy side because of the compressed settlement timeline. This change means firms need to closely examine how they operate to handle the quicker pace.

Key issues for our firm include:

  • Different settlement times in global markets, which can make coordinating trades more complicated.
  • The timing of currency exchanges that need to happen after securities trades, which can affect when and how trades are settled.
  • Managing the cashflow cycle for pooled funds and segregated clients, which influences when trades can happen and requires changes in how investment teams work.

These challenges means firms must plan carefully to continue trading without issue under the new, quicker settlement timeline.

Which securities will the reduced settlement cycle affect?

The Canadian Capital Markets Association (CCMA) has compiled a list of securities scheduled to transition from the current T+2 settlement cycle to T+1 cycle in 2024. You can access the list at the CCMA’s website at: https://ccma-acmc.ca/en/t1-resources/canadian-t1-asset-list-liste-dactifs-canadiens-t1/.

The Depository Trust & Clearing Corporation (DTCC) also offers information on settlement cycles and related changes on its website at dtcc.com.

Will there be penalties for settling bonds and trades late?

No new penalties will be introduced; however, if registered dealers and advisers fail to meet the trade matching target requirements, they could face consequences. The Bank of Canada is considering charging a fee for any government bond trades that settle outside the prescribed timeframe. This fee would only be introduced after the transition to T+1 is complete, and the impact of the fee is properly assessed.

How is CC&L preparing for T+1 settlement?

In spring 2023, CC&L formed a project team to address the shift to T+1 settlement. This team is divided into four main workstreams focused on identifying and resolving issues and making changes in how trades are managed, covering everything from legal requirements to how trades are funded and settled.

It is also imperative that our peers and industry stakeholders are ready for this change. CC&L has started talking to brokers and custodians to understand their plans for T+1 and to determine what CC&L needs to maintain best execution.

Additionally, CC&L has consulted with technology providers to explore tools that could help with a shorter settlement period.

What are CC&L’s next steps?

As May 2024 approaches, CC&L will continue communicating with industry partners and clients, educating them about the change and working on necessary adjustments to meet the new standard.

Any updates to how CC&L handles transactions will be shared with clients closer to the start date.

If your question wasn’t answered above, please contact us at [email protected].

Cosmetic skin care products on green leaves.

Rising consumer demand driving supply chain transparency

Recognizing the trends shaping the trajectory of ESG integration by companies in their processes in 2024 is a key focus point. Amid growing regulatory requirements and increasing consumer demand for transparency, the spotlight has now extended to companies’ supply chain practices, emphasizing the need for holistic ESG considerations.

Regulatory momentum

The surge in regulatory frameworks, such as the upcoming Corporate Sustainable Due Diligence Directive (CSDDD) and the Deforestation Regulation in the EU, alongside proposals like the Securities and Exchange Commission’s mandate for emissions disclosure across value chains, signal a global push toward heightened accountability and risk management. These directives require companies to broaden their due diligence to encompass their entire supply chains, addressing human rights and environmental sustainability risks to preempt controversies and safeguard against reputational damage that could adversely affect shareholder value.

Consumer power and the ripple effect

A driver in these regulatory developments is undoubtedly rising consumer preference for goods that are ethically and sustainably produced. As shoppers become more mindful of the environmental and social impacts, companies are compelled to reevaluate their supply chain practices. Not meeting these emerging standards can result in serious brand and financial repercussions, as evidenced by the backlash against major labels like Adidas and Nike over labour misconduct allegations within their supply chains that triggered boycotts and meaningful share price declines in 2020. Especially within the apparel and footwear industry, there is an acute pressure to implement sustainable practices along supply chains.

Examples of ESG risk management in supply chains

Asics (7936 JP), a Japan-based sporting goods manufacturer in our portfolios, has increasingly integrated ESG principles and enhanced due diligence in its supply chain in recent years. The company, involved in labour issues in a Cambodian factory in 2013 and 2017, has been working on increasing supplier traceability initiatives, including corporate social responsibility (CSR) and human rights policies, audits and monitoring, aiming to reduce the risks of human rights abuses and environmentally harmful practices in procurement activities. As a result of its supply chain initiatives, Asics was recognized on the CDP Supplier Engagement Leaderboard in 2021, a leading international non-profit dedicated to assessing the disclosure of companies on environmental matters. Furthermore, a Human Rights Committee established in 2022 at the board level oversees and evaluates the effectiveness of these initiatives. This strategic focus on ESG not only bolsters brand credibility but also mitigates reputational and legal risks. For instance, Asics avoided the fallout faced by peers in 2020-21 over cotton sourcing controversies from China’s Xinjiang region, likely the result of its intensified risk management.

L’Occitane and the beauty of responsibility

Similarly, the personal care products industry is witnessing rising customer demand for ethically sourced products. Another company in our portfolio, L’Occitane International SA (973 HK), a global leader in natural and organic beauty and skincare products, is considered a champion in this area. By prioritizing a partnerships-based approach with suppliers and rigorously assessing the CSR performance of over 9,000 suppliers worldwide, L’Occitane ensures holistic risk mitigation and proactive engagement with at-risk suppliers. The group participates in the Responsible Beauty Initiative (RBI) and the Partners by Nature program, to help promote responsible sourcing practices in the industry and strengthen its collaboration with strategic suppliers. In 2022, it was invited to join the EcoVadis trailblazer’s network as one of the awarded companies in the 2021 edition. This network includes the most advanced companies in terms of responsible value chains that come together to share best practices and challenges. In addition to being a leader in this field, the company’s commitment to responsible sourcing, increasingly popular among consumers worldwide, is in line with its brand image and strategy.

The bottom line – sustainability as a strategic supply chain priority

In today’s environment of regulatory scrutiny and elevated consumer expectations, ESG integration in portfolio company supply chains can build trust and help to mitigate the legal risks of regulatory non-compliance.

Disclaimer: ESG integration at Global Alpha is driven by taking into account material sustainability and/or ESG risks that could impact investment returns, rather than being driven by specific ethical principles or norms. The investment professionals may still invest in securities that present sustainability and/or ESG risks, including where the portfolio managers believe the potential compensation outweighs the risks identified.

Chinese monetary statistics for January suggest that policy easing is starting to become effective.

Six-month growth of narrow money, as measured by true M1*, rebounded from a negative December reading to its highest level since May – see chart 1.

Chart 1

Chart 1 showing China Nominal GDP & Narrow Money (% 6m)

Q1 numbers can be volatile because of New Year timing effects, so improvement needs to be confirmed by February / March data.

True M1 can be broken down into “private” and “public” sector components. The former aggregates currency in circulation and demand deposits of households and non-financial enterprises. The latter is calculated as a residual and is dominated by demand deposits of government departments and organisations.

Six-month growth rates of both components rose in January but the public sector increase was much larger, consistent with funds being mobilised to boost fiscal spending – chart 2.

Chart 2

Chart 2 showing China True M1 Breakdown (% 6m)

Progress in implementing fiscal stimulus is also suggested by a strong rise in central government deposits – these are excluded from money definitions but deployment of funds will have a positive monetary impact.

The broader M2 measure continues to outpace narrow money, with six-month growth little changed in January, extending a recent sideways movement. In terms of the “credit counterparts”, domestic credit expansion has firmed since late 2023 but there has been an offsetting increase in non-monetary funding (“other liabilities”) – chart 3.

Chart 3

Chart 3 showing China M2 & Credit Counterparts Contributions to M2 % 6m

A reduction in the broad / narrow money growth gap driven by narrow acceleration is usually a positive economic signal, indicating a rise in broad money velocity.

The January narrow money recovery, as noted, partly reflects implementation of fiscal spending plans. A sustained pick-up requires monetary policy to be sufficiently accommodative. Recent developments are promising. PBoC lending to the banking system grew by a record amount in Q4. Banks’ excess reserve ratio rose to 2.1%, the highest since Q4 2020 – before the recent 0.5 pp further reduction in the requirement ratio. The reserves injection has contributed to three-month SHIBOR reversing half of its August-December rise since the start of the year – chart 4. Currency weakness has remained contained despite softer rates; indeed, the JP Morgan effective index has risen slightly year-to-date.

Chart 4

Chart 4 showing China Interest Rates

Monetary deterioration into late 2023 argues for economic weakness through H1 2024. Confirmation that monetary trends have turned would suggest improving prospects for H2.

*Official M1 plus household demand deposits. M1 conventionally includes such deposits but they are omitted from the Chinese official measure for historical reasons.

Six-month core CPI momentum has returned to a target-consistent level in the Eurozone and UK, with January readings of 2.1% and 1.9% annualised respectively*. US momentum is significantly higher, at 3.6% – see chart 1. What explains this gap?

Chart 1

Chart 1 showing Core Consumer Prices (% 6m annualised)

One answer is that the US CPI is overstating core pressure. The six-month increase in the Fed’s preferred core PCE measure was 1.9% annualised in December. Assuming a monthly rise of 0.4% in January (the same as for core CPI), six-month momentum would firm to 2.4% – still little different from Eurozone / UK core CPI readings.

The stronger rise in the US CPI than the PCE index reflects a higher weighting of housing rents and a faster measured increase in “supercore” services prices.

Perhaps reality lies somewhere between the two gauges, i.e. the stickiness of US core CPI momentum is at least partly genuine. If so, the US / European divergence may be explicable by monetary trends in 2021-22.

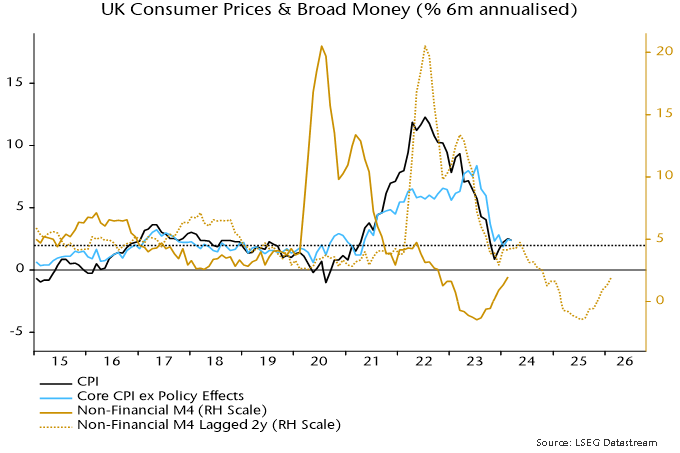
Previous posts highlighted the close correspondence between the slowdowns in Eurozone and UK six-month CPI momentum and profiles of broad money growth two years earlier. Chart 2 updates the UK comparison to incorporate January CPI data.

Chart 2

Chart 2 showing UK Consumer Prices & Broad Money (% 6m annualised)

UK and Eurozone six-month broad money momentum peaked in summer 2020 and had returned to the pre-pandemic range by late 2021. This is consistent with the reversion of six-month headline and core CPI momentum to target-consistent levels around end-2023.

US broad money momentum followed a different path, with a more extreme surge in summer 2020, a return to earth in H2 2020 and a secondary rise in H1 2021, driven partly by disbursement of stimulus checks in December 2020 and March 2021 – chart 3.

Chart 3

Chart 3 showing US Consumer Prices & Broad Money (% 6m annualised)

The sharp fall in US six-month money growth during H2 2020 was echoed by a slowdown in CPI momentum into end-2022 – much earlier than occurred in the Eurozone and UK. More recent CPI stickiness may reflect the lagged effects of the secondary monetary acceleration into mid-2021.

What does this suggest for absolute and relative prospects? The judgement here is that broad money growth of 4-5% pa is consistent with 2% inflation over the medium term. US six-month money momentum crossed below both this range and UK / Eurozone momentum in May 2022, reaching an eventual low in February 2023, at a weaker level than (later) lows in the UK / Eurozone.

Assuming a two-year lead, this suggests that US six-month core CPI momentum will move down to 2% around mid-2024 on the way to a larger (though possibly shorter) undershoot than in the UK / Eurozone.

*Eurozone = ECB seasonally adjusted CPI excluding energy and food including alcohol and tobacco. UK = own measure additionally excluding education and incorporating estimated effects of VAT changes, seasonally adjusted.

East indian female pediatrician and mother measuring the weight of baby girl during a routine medical check-up.

When it comes to our wealth, we often think about assets or money that we own. However, when we’re sick, we realize our health represents our real wealth and the importance of investing in it.

Population surge meets healthcare hurdle

With its rapidly growing population, India faces significant challenges in providing adequate healthcare services to its citizens. The World Health Organization (WHO) projects India’s population to reach 1.5 billion by 2030, making it the most populous country globally. This growth puts immense pressure on the healthcare system to meet increasing demand for medical services and facilities.

India’s bold step with the world’s largest insurance plan

In 2018, India’s Prime Minister, Narendra Modi, launched Ayushman Bharat Pradhan Mantri Jan Arogya Yojana (AB-PMJAY), the world’s largest universal health insurance plan often referred to as the National Health Protection Scheme. The program aims to help India’s most vulnerable population by offering Rs. 5 lakh (~CDN$8,000) per family per year. The plan is estimated to support 550 million citizens across the country, allowing cashless benefits at any public or private impaneled hospital nationwide. This significantly increases access to quality healthcare and medication for almost 40% of the population, covering almost all secondary and many tertiary hospitalizations. It also addresses the previously unmet needs of a hidden population that lacks financial resources. The plan helps to control costs by providing treatment at fixed, packaged rates.

A flourishing market, billions in the making

Since 2015, India’s healthcare sector has been growing at a CAGR of 18%, currently valued at ~USD$450 billion. Narayana Health’s CEO, one of India’s largest hospital chains, estimates the market to be worth USD$828 billion by 2027. This growth is mainly driven by increased spending from both public and private sectors.

India’s healthcare market value (USD)

Source: Frost & Sullivan; Aranca Research; Various sources (LSI Financial Services, Deloitte).

Foreign direct investment and pharmaceutical export

It’s not surprising that drugs and pharmaceuticals comprise a large percentage (63.4%) of foreign direct investment, as Western countries outsource generic drug manufacturing to India to benefit from reduced labour costs. This is followed by investment in hospitals/diagnostic centres (26.6%) and medical/surgical appliances (9%).

India remains the world’s largest provider of generic drugs, exporting $25.4 billion worth in 2023. We view this market as attractive as the competitive landscape has forced new players to innovate as patents expire.

Ajanta Pharma – a beacon of innovation in India’s pharmaceutical sector

We continue to own Ajanta Pharma (AJP IN). It has high exposure to branded generic markets and a leading position in niche categories, with a superior margin and return profile. The company operates across India, the US and more than 30 emerging countries in Africa and Asia, focusing on cardiology, ophthalmology, dermatology and pain management.

Despite being a smaller player in the space with a 0.7% market share, Ajanta maintained this position during the lockdown and outperformed industry growth by 200 basis points. Owned by its founder, with the family retaining close to 70% of the business, Ajanta benefits from over four decades of experience and we believe continues to be in capable hands.

This growth story is a testament to how investment can translate into tangible health benefits, weaving a new narrative of prosperity and the true value of wealth in health.

Summary

  • A down month in EM equities was led by continued investor pessimism in China, down by over -10% in USD terms. Further commentary below.
  • Bucking the trend were securities in India across healthcare, communications, real estate and consumer staples.
  • Stocks in Taiwan with AI exposure also outperformed.

Korea adopts Japan’s playbook to boost equities

Bottoming Korean exports growth from October has been led by a recovery in the semiconductor sector, reflected by the outperformance of equities with exposure to the AI supply chain, which posted strong returns through 2023.

South Korea Exports YoY Index

Line graph showing South Korea year-over-year exports from 2019 to January 2024.

Source: Bloomberg

The market pulled back during the month before bouncing on news that Korean regulators are looking to emulate Japan’s efforts to pressure companies into improving governance and driving higher valuations. These proposed measures look set to boost market laggards trading at below 1x price/book – or around half of the Kospi 200.

While yet to be finalised, terms of the proposal include:

  • A requirement that listed companies disclose valuation improvement measures.
  • Financial authorities will publish a name-and-shame list of companies that have not announced valuation improvement plans.

Efforts by listed Korean companies to improve payouts, repair balance sheets and buy back shares could see super-cheap stocks lead the market higher. According to CLSA, Korean stocks are under-owned by GEM investors with the Kospi trading at 0.88x P/B as of 18 January.

Strong retail presence

The catalyst for the move is clear. Parliamentary elections loom in April for deeply unpopular president Yoon Suk Yeol, who is looking to improve his prospects by adding further fuel to an export-led economic recovery via the stock market. The move looks savvy given over 30% of the voting age population invests in single stocks in a market that is dirt cheap.

Bar chart comparing Korean investors to Korean homeowners and the voting population from 2014 to 2022.

Source: CLSA (Feb 2024)

Our playbook is to stick with our quality names in Korea, across semis giants Samsung and Hynix, autos and financials. Preferred shares for a number of companies also look attractive given massive discounts to ordinary shares. For instance, Samsung preferred shares are trading at a c.20% discount. Pref shares could be bought back at a discount by the parent companies as a cost-effective way to boost shareholder returns.

Economic recovery and reforms to benefit rising automaker KIA

KIA is a brand on the rise, continuing to execute on a premiumisation strategy led by the launch of a series of popular EV models that are on track to reach 40% of sales by 2030.

Illustration showing KIA EV sales plan projections to 2030.

Source: Kia Investor Presentation, 2022

The stock is trading around 2024E 4.2x PE for a 5.6% dividend yield and return on equity of 18%. This qualifies KIA for laggard status in our view, as it trades below its Japanese peers despite much better returns and margin profile. The company appears to embrace the drive to improve stock performance, having committed to buying and cancelling Won 2.5trn worth of stocks over the next 5 years (6% of outstanding shares).

KIA enjoys strong brand recognition and growing market share in the US and Europe, along with other growing markets such as India. Average selling prices are set to rise as EVs take a greater share of sales, attracting customers on higher incomes (i.e., KIA’s average customer in the US earns over US$150k per annum) who tend to opt for the more expensive trim options. The company has launched a series of premium EVs, which include a number of SUV models (the EV9 is pictured below) that have been especially popular in the US. They boast fast-charging, battery range, performance and looks (KIA’s chief designers hail from the likes of Audi, Lamborghini and VW), rivalling the best EV offerings from premium European brands.

Picture of a KIA SUV.

Source: evo.co.uk

Rising vehicle financing costs and recession risks in the US and Europe could slow progress, but recent results have been strong. Declining raw materials costs and the higher SUV mix allowed the company to raise operating profit margin guidance to above the 2023 level (11.9%) and higher-than-market forecasts, putting KIA well ahead of Tesla (9%).

Former general set to clinch presidency in Indonesia

Former Indonesian general Prabowo Subianto is the favourite to win the country’s presidential election in February. The election marks the end of Joko Widodo’s decade in power, stepping down with a remarkable 80% approval rating. Having run against Widodo in the 2014 and 2019 elections, Prabowo now has the backing of the president, along with his 36-year-old son Gibran Rakabuming Raka as a running mate.
The latest polling suggests Prabowo has a chance of winning 50% of the vote needed to avoid a second round run-off. The former military strongman now dubbed the “dancing grandpa” by his young base of supporters has pledged continuity with the policies of Widodo. This includes encouraging investment in industries such as nickel processing to capture more of the battery value chain, along with boosting GDP from the pedestrian 4-5% under Widodo up into the high single digits.

Mexico now the #1 source of imports to the US

Mexico overtook China as the top source of imports to the US in 2023, fuel for the narrative that “friend-shoring” supply chains will gradually screen China out of the Western trading bloc.

Bar chart comparing China and Mexico exports to the US between 2011 and 2023.

Source: US Census data

The real story isn’t quite so simple – US import data understate Chinese exports, with the total recorded in Chinese data being c.25% higher. This seems to reflect systematic tariff avoidance. In addition, many Chinese firms are investing aggressively in Mexico to take advantage of the North American Free Trade Agreement and gain frictionless access to the US market. As the Wall Street Journal illustrates in a recent piece, China’s exporters can access the US duty-free with Made in Mexico labels:

The participation of Chinese companies in this shift attests to the deepening assumption that the breach dividing the United States and China will be an enduring feature of the next phase of globalization. Yet it also reveals something more fundamental: Whatever the political strains, the commercial forces linking the United States and China are even more powerful.

Chinese companies have no intention of forsaking the American economy, still the largest on earth. Instead, they are setting up operations inside the North American trading bloc as a way to supply Americans with goods, from electronics to clothing to furniture.