Money Moves Markets
Will “Treasury QT” sink markets?
February 8, 2024 by Simon Ward
Recent US equity market buoyancy is likely to be related to a rebound in broad money momentum during H2 2023. The previous post argued that this was driven by monetary financing of the federal deficit – specifically, large-scale issuance of Treasury bills that were bought mainly by money funds and banks.
A more contentious interpretation is that the Treasury has been operating a form of QE that has overridden the monetary effects of the Fed’s QT.
The federal deficit can be financed by running down the Treasury’s cash balance at the Fed or issuing bills / coupon debt. The first option injects money directly. Issuing bills is also likely to expand broad money, since money funds and banks usually absorb the bulk of new supply. Coupon issuance usually has the smallest monetary impact because coupon debt is purchased mainly by non-banks.
So a summary measure of the monetary influence of financing operations is the difference between Treasury bill issuance and the change in the Treasury balance at the Fed – henceforth “Treasury QE”.
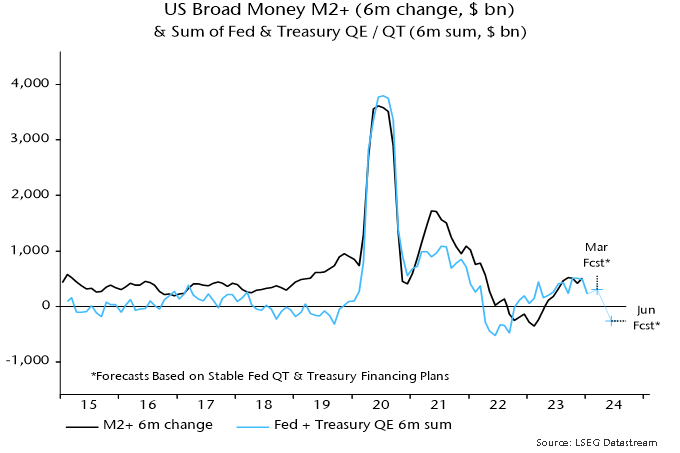
Chart 1 shows six-month running totals of Fed QE / QT and the suggested Treasury monetary impact along with the six-month change in broad money. The sum of the Fed and Treasury series “explains” most of the variation in money momentum in recent years – chart 2.
Chart 1
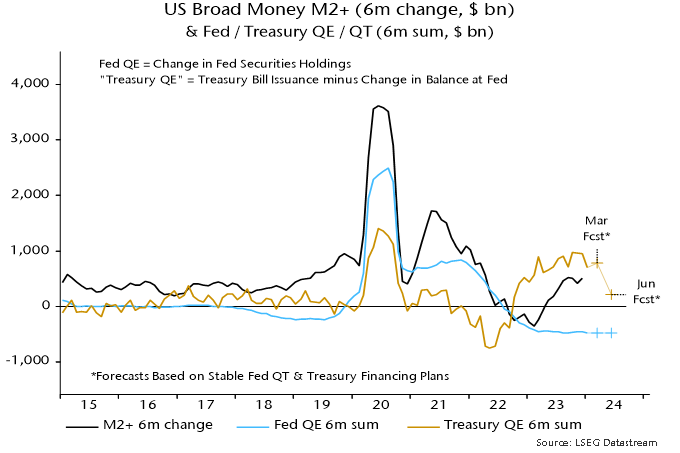
Chart 2
“Treasury QE” was a major contributor to the 2020 monetary surge and became significant again in late 2022 / early 2023, mainly reflecting a run-down of the Treasury’s cash balance. Following suspension of the debt ceiling in June 2023, the Treasury rebuilt the balance but the monetary impact was more than offset by bumper bill issuance – see the previous post for details.
The Treasury’s recently released financing plans imply a swing from expansion to contraction during H1 2024. The cash balance at the Fed is targeted to fall from $769 billion at end-2023 to $750 billion at end-Q1, remaining at this level at end-Q2. The stock of bills, meanwhile, is projected to rise by $442 billion in Q1 but fall by $245 billion in Q2. “Treasury QE” would remain strong at $461 billion in Q1 – far ahead of expected Fed QT of about $240 billion – but a dramatic shift would occur in Q2, with “QT” of $245 billion.
If Fed QT were to continue at its current pace, the suggestion is that the six-month change in broad money would return to negative territory by mid-year, unless other monetary counterparts were to show offsetting strength – chart 2.
Note that the above argument is distinct from the notion that ongoing Fed QT risks pushing reserve balances and / or deposits at the overnight reverse repo (ON RRP) facility below the level required for money market stability. The possibility of a broad money shortage due to a withdrawal of Treasury monetary support would remain even if the minimum reserves / ON RRP level proves to be lower than feared. The two risks, however, could interact.
A possible conclusion is that markets face a monetary air pocket in Q2 unless the Fed halts QT at its March meeting. A cynic might speculate that the Treasury’s financing plans are designed to increase pressure for an early Fed cessation, which might be followed by a H2 resumption of bill financing to swell monetary support ahead of the November election.