Money Moves Markets
Assessing UK house price valuation: a real yield-based approach
April 26, 2024 by Simon Ward
UK house prices were an estimated 52% expensive relative to history at the end of 2023, based on a comparison with rents and the real yield on index-linked gilts, a competing inflation-protected asset.
The degree of overvaluation is below previous extremes and does not imply that house prices need to fall by an equivalent magnitude, or even at all – the deviation could be eliminated by rental growth and a reversal of the recent rise in real yields.
The ratio of the average house price to average earnings is conventionally used to assess valuation. Chart 1 shows an economy-wide version of this ratio – the estimated value of the housing stock divided by aggregate household disposable income.
Chart 1
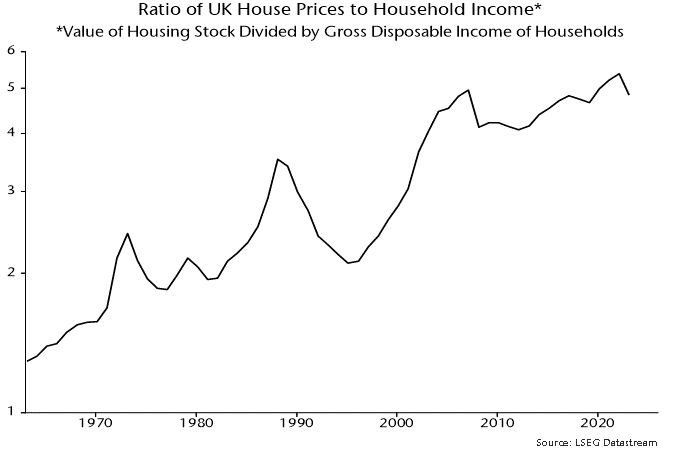
The secular rise in the ratio is usually ascribed to such factors as increasing credit availability, population growth and undersupply due to planning and other constraints.
The use of earnings as a yardstick is questionable: it would be odd to assess the valuation of an equity market by reference to the income of investors. A better approach is to compare house prices with the value of services provided – proxied by rents – using an appropriate discount rate.
A simple valuation metric based on this approach is the gap between the rental yield on housing and the real yield on longer-term index-linked gilts. Index-linked rather than conventional bonds are the appropriate reference because housing is expected to provide inflation protection over the longer term.
The rental yield series, shown in chart 2, is derived from national accounts data by dividing the sum of actual and imputed rents by an estimate of the value of the housing stock*. The measure, therefore, is comprehensive, including owner-occupied and public housing as well as private rented accommodation.
Chart 2
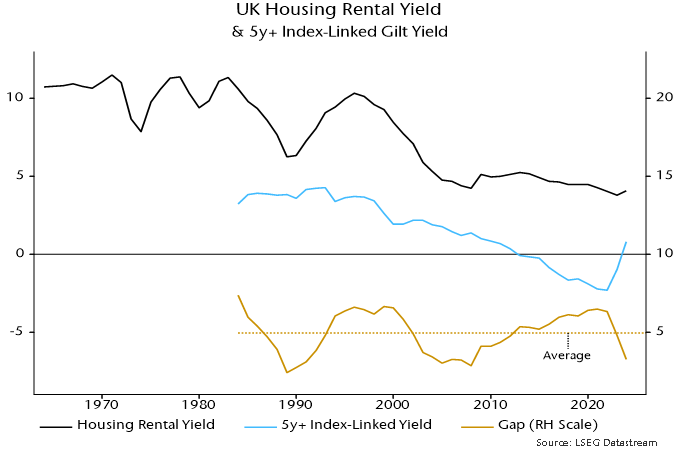
The index-linked yield series starts in 1983 – the first such gilt was issued in 1981 – so the rental / index-linked yield gap has 41 years of history. In contrast to the house price to income ratio, the gap appears to be stationary / mean-reverting. The average (mean) gap over this period was 4.96 pp. The deviation from this average is the basis of the estimate of over- / undervaluation in a particular year.
The gap indicates that housing was undervalued as recently as in 2021 but only because index-linked yields had fallen to a record negative.
The drop in the yield gap to an estimated 3.27% at end-2023 – implying housing overvaluation of 52% – was driven by index-linked yields returning to positive territory. The rental yield was little changed between 2021 and 2023.
Current overvaluation compares with prior extremes of 74% in 2007 and 105% in 1988 – chart 3. These extremes marked peaks of the 18-year housing cycle, with another top due around 2025.
Chart 3
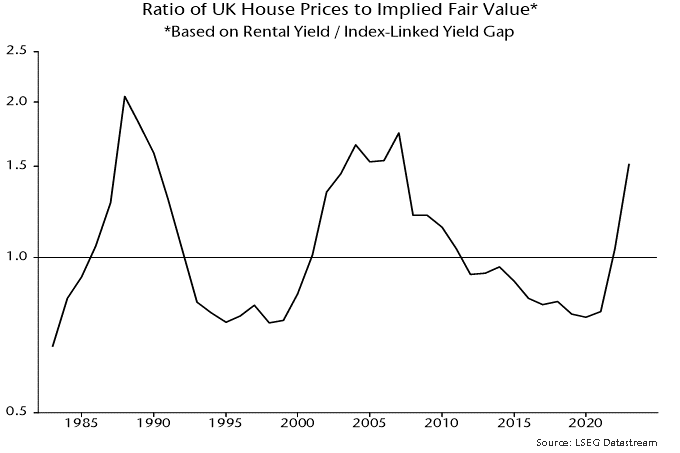
The suggestion is that, unless index-linked yields revert to negative, housing will perform poorly relative to history over the longer term, although prices may be supported over the next 1-2 years as the housing cycle upswing crests.
*The current series for actual and imputed rents begin in 1985; earlier numbers were estimated by linking to previous vintages. The value of the housing stock was calculated by adding the value of dwellings and an estimate of the value of associated land. The latter estimate was derived by applying the ratio of land value to dwellings value for households to the value of dwellings owned by all sectors. The resulting series begins in 1995; earlier numbers were estimated by linking to a previous vintage series for the value of the residential housing stock including land.