Commentary
What is the catalyst for EM equities?
April 17, 2024
Calling for the turn in EM performance has long been dismissed by sceptics as investing’s tribute to Samuel Beckett’s play, Waiting for Godot. The story centres on two strangers who both happen to be waiting for a man named Godot to appear, and pass the time by contemplating the meaning of life in a seemingly endless cycle of anticipation and uncertainty.
Defenders of the asset class argue this is too harsh for such a diverse subset of countries and companies, providing ample room for stock pickers to seek out alpha. On the other hand, EM investors have largely struggled to escape the gravitational pull of a dollar bull market that has lasted for over a decade, illustrated in the charts below.
USD has been both a key signal and driver for emerging market equities
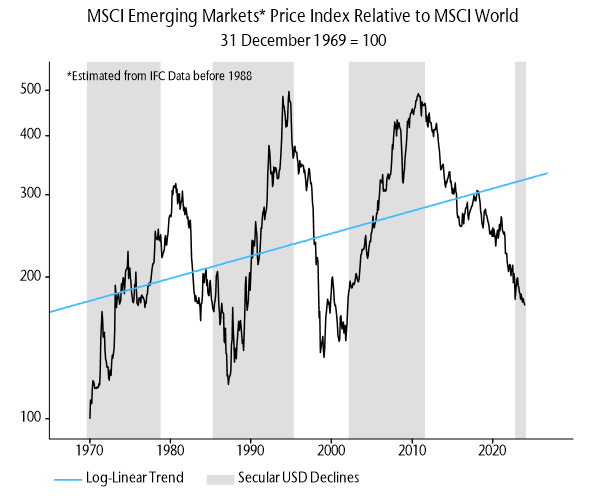
Source: NS Partners & Refinitiv Datastream
Was October 2022 a USD secular peak? The recent rally has yet to breach that high
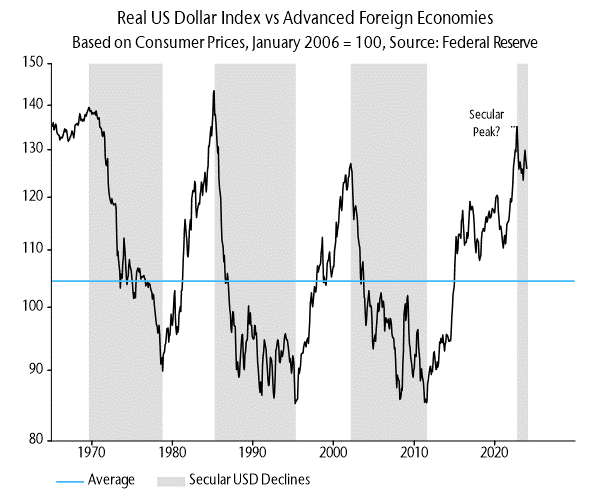
Source: NS Partners & Refinitiv Datastream
US equities have been ascendant for nearly a decade and a half, led by the superior earnings growth and profitability of the tech titans. Many large EMs have had to work through sharp recessions, deleveraging, balance of payments issues, foreign capital exodus and related currency weakness. The dynamics create a reflexive vicious circle where these negatives feed on each other, providing a poor backdrop for EM equities.
The result is global allocators herding into US stocks at the most concentrated levels since at least 1929 (see chart below), and within that weighting to the US, we saw the seven largest stocks in the S&P500 grow from 21% of the index to 30% by the end of 2023.
The current concentration of US stocks helped to drive an exceptional period of market returns
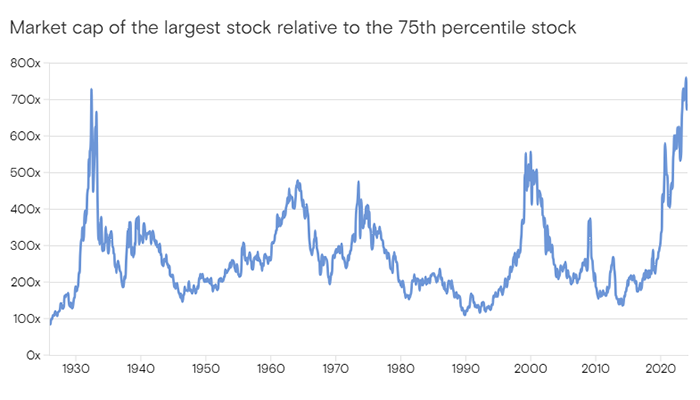
Source: Goldman Sachs, February 2024. Universe consists of US stocks with price, shares, and revenue data listed on the NYSE, AMEX, or NASDAQ exchanges. Series prior to 1985 estimated based on data from the Kenneth French data library, sourced from CRSP, reflecting the market cap distribution of NYSE stocks.
Going long US equities has been the winning trade for a long time. However, sticking solely with what has worked can risk falling into the behavioural trap of recency bias, and letting opportunities slip by.
Emerging markets have been left out in the cold, and we have hardly been banging the table over the last year or so. Everyone has heard the contrarian bull case of troughing EM economies, earnings, currencies and valuations.
Valuations are compelling
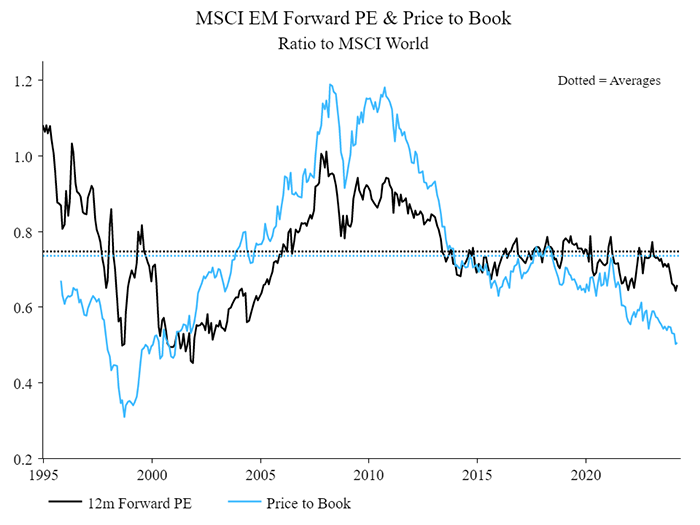
Source: NS Partners & Refinitiv Datastream
EM currencies look cheap (Brazil and Mexico are outliers)
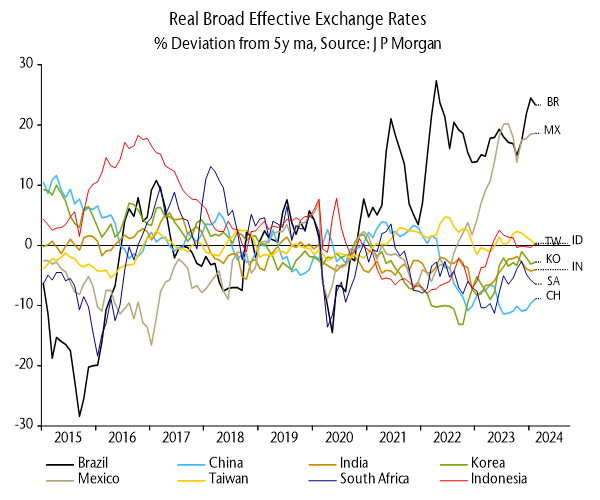
Source: NS Partners & Refinitiv Datastream
We have emphasised their superior money numbers and better inflation management by EM central banks, providing plenty of room to ease from very high levels of real rates.
However, the clincher in our view is a potential shift globally to positive excess money growth (real narrow money growth in excess of economic growth). This “double positive” condition of stronger money growth in EM than DM combined with positive global excess money has historically been correlated with EM outperformance.
This dynamic is illustrated in the charts below, the first mapping our two monetary indicators to periods of EM out- and underperformance (shading highlights double positive readings), while the second reinforces this with a hypothetical EM portfolio that moves to cash whenever either of the monetary indicators is negative.
Excess money measures mixed, double positive soon?
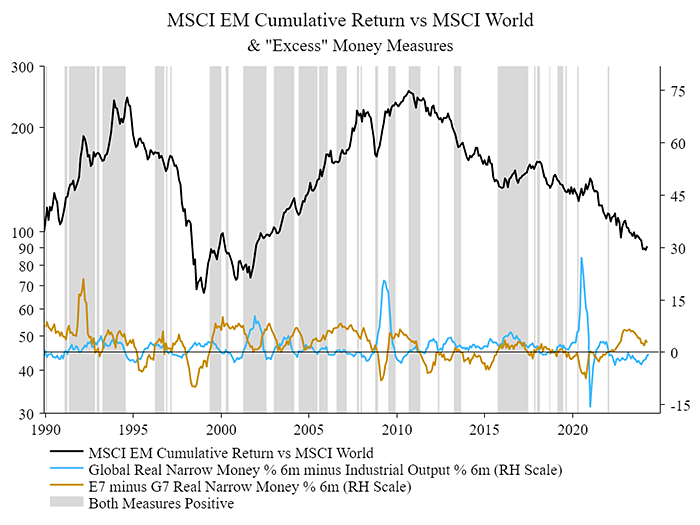
Source: NS Partners & Refinitiv Datastream
Hypothetical performance of excess money switching rule
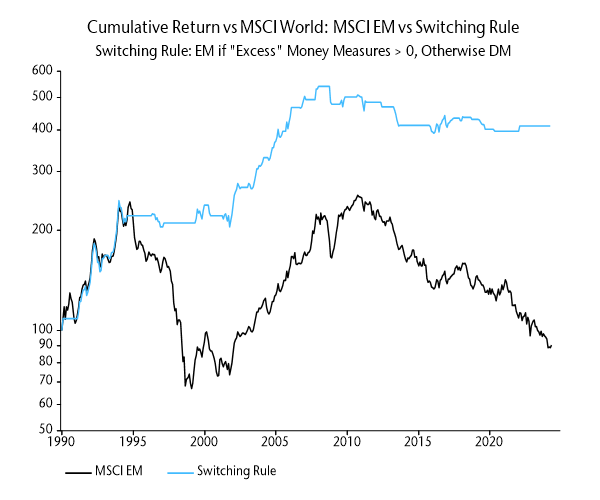
Source: NS Partners & Refinitiv Datastream
As you can see, that blue line for global excess money has been trending less negative and could be about to enter positive territory.
While it may be some time yet for the money and dollar signals to fall firmly in favour of emerging markets, our view is that point is getting closer.
With EM positioning plumbing the depths, catching the upswing in sentiment will reward those non-conformists with the stomach to embrace the uncomfortable.