Money Moves Markets
What explains US consumer exceptionalism?
January 23, 2024 by Simon Ward
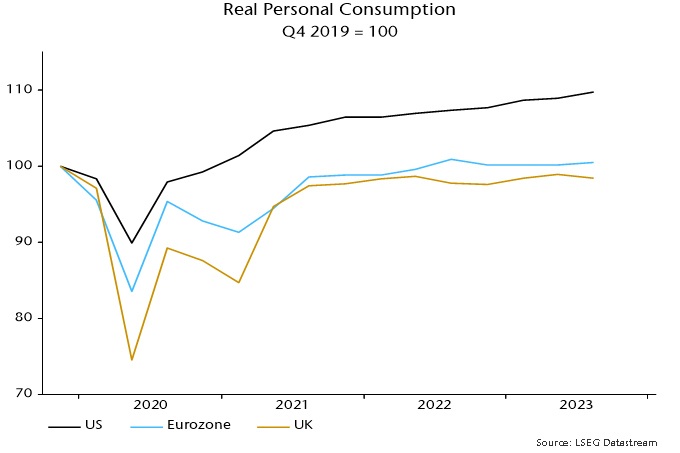
US consumers have trounced the Europeans – again. US personal consumption rose by 9.7% between Q4 2019 and Q3 2023 versus a 0.5% increase in the Eurozone and a 1.6% fall in the UK – see chart 1.
Chart 1
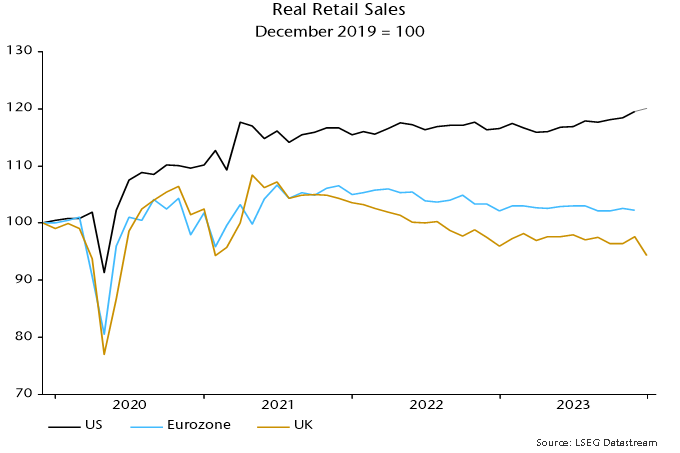
The divergence probably widened in Q4, judging from retail sales. US sales rose solidly into year-end as Eurozone turnover flatlined (through November) and UK sales hit a new low – chart 2.
Chart 2
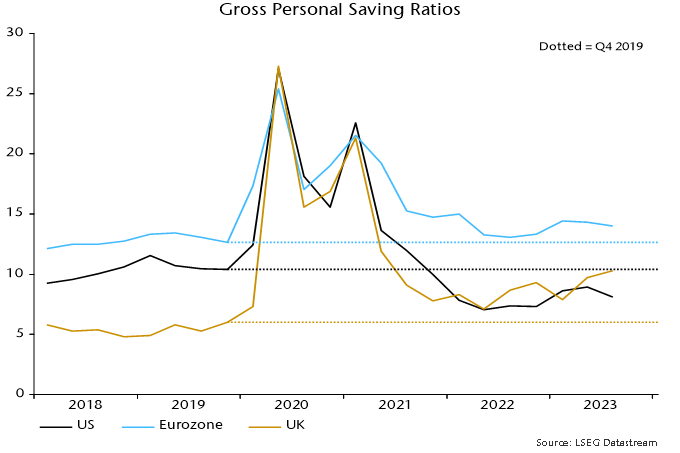
Faster growth of US real personal disposable income explains just over half of the US / Eurozone consumption divergence over Q4 2019-Q3 2023 and about one-third of the US / UK difference. The remainder reflects contrasting saving behaviour.
The US personal saving rate fell by 2.3 pp between Q4 2019 and Q3 2023 versus rises of 1.4 and 4.3 pp in the Eurozone and UK respectively – chart 3*.
Chart 3
What explains the willingness of US households to consume more out of their income than before the pandemic, both in absolute terms and relative to Europeans?
A “monetarist” view is that divergent saving behaviour is related to the magnitude of the boost to household money balances from pandemic-era monetary and fiscal stimulus.
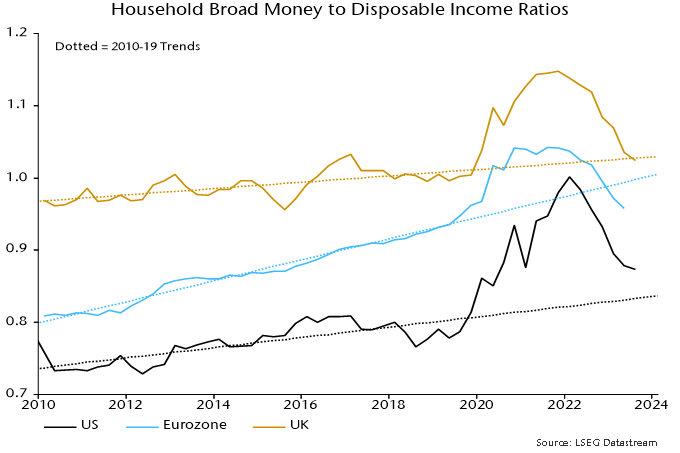
The rise in the ratio of household broad money to disposable income from Q4 2019 was larger and peaked later in the US than in the Eurozone and UK – chart 4.
Chart 4
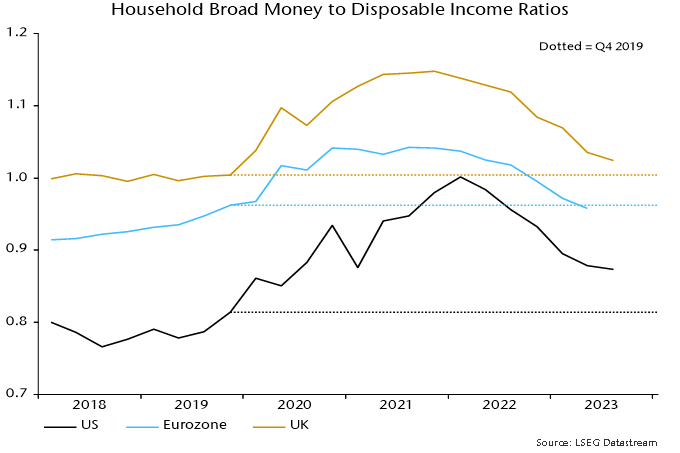
Households with “excess” money balances adjust by spending more on consumption or investment (housing), adding to non-monetary financial assets and / or reducing debt. The larger US excess has probably resulted in a bigger and more sustained boost to consumption than in Europe.
To the extent that monetary adjustment involves higher consumption, the saving rate will be lower than otherwise until the ratio of money balances to income is restored to an “equilibrium” level.
Judging how much of a consumption boost remains requires an estimate of “equilibrium”. As chart 4 shows, the ratio of household broad money to income is below its Q4 2019 level in the Eurozone but still higher in the US and, to a lesser extent, UK.
A superior approach, however, may be to compare money to income ratios with their pre-pandemic trends, since the ratios tend to rise over time as wealth grows faster than income.
On this basis, money demand may now be acting to restrain consumption in the Eurozone / UK, while US excess money balances are now modest and on course to be removed during 2024 – chart 5.
Chart 5
The US money to income ratio peaked in Q1 2022, a quarter ahead of the low in the saving rate. The saving rate had risen by 1 pp by Q3 2023 and may increase further as the excess money effect wanes.
*The headline measure of the US personal saving rate is calculated net of depreciation. A gross measure is used here to align with European convention.