Money Moves Markets
Weaker US business money trends
March 13, 2024 by Simon Ward
The Fed’s quarterly financial accounts provide information on sector money trends and funds flows. Several features of the Q4 accounts, released last week, are noteworthy.
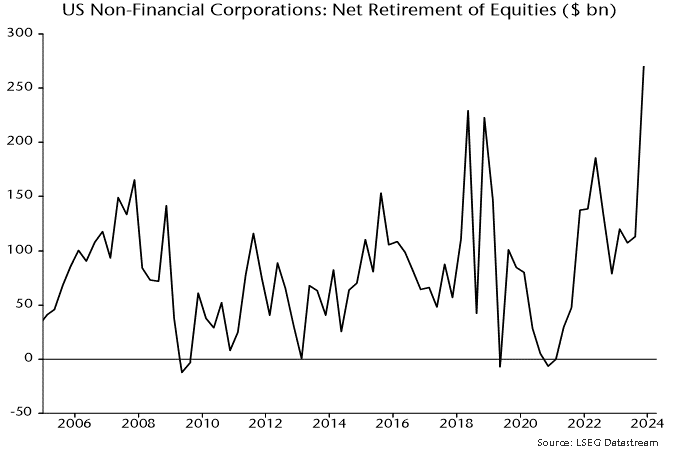
First, net retirement of equities by non-financial corporations (via buy-backs and cash take-overs) reached a record dollar amount ($270 billion) in Q4, confirming that corporate buying was a key driver of the year-end rally – see chart 1.
Chart 1
The rise in equity purchases followed strong growth of non-financial business broad money holdings in the year to end-Q3, discussed in a previous post. Such holdings, however, contracted slightly in Q4, pulling annual growth down from 10.6% to 6.2% – chart 2.
Chart 2
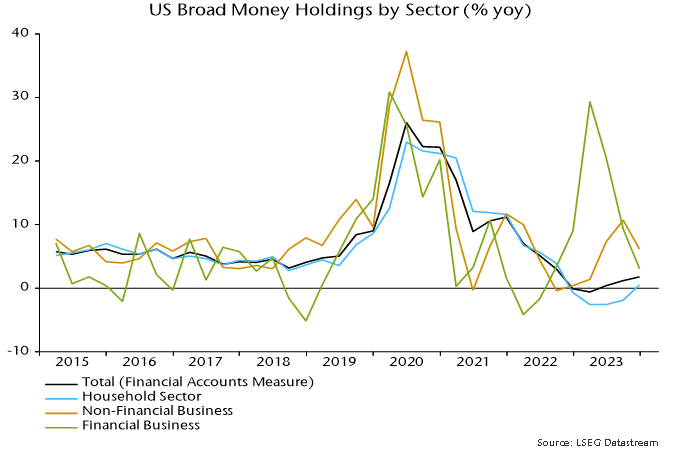
Financial business money holdings had surged in the year to end-Q1 2023, perhaps partly reflecting cash-raising related to equity market weakness in 2022. These balances were run down during H2, though still finished the year slightly higher than at end-2022.
The recent weaker trends in non-financial and financial business money suggest less buying support for equities and other risk assets going forward.
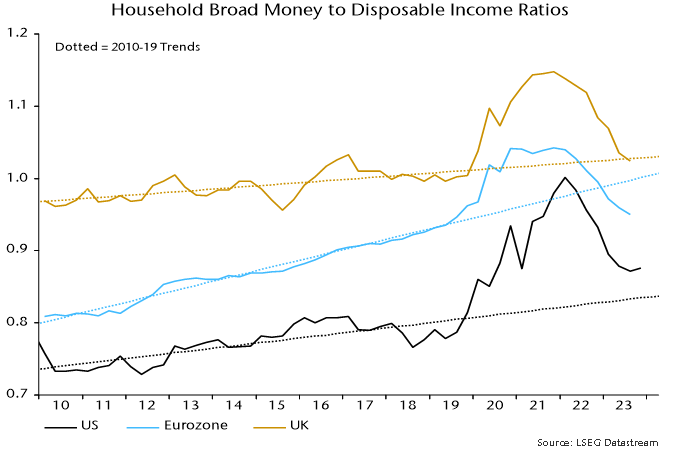
Household broad money, by contrast, rose solidly in Q4, resulting in the annual change returning to positive territory. The ratio of money holdings to disposable income recovered slightly following six consecutive quarterly declines, remaining above its pre-pandemic trend, in contrast to shortfalls for corresponding Eurozone and UK ratios – chart 3.
Chart 3
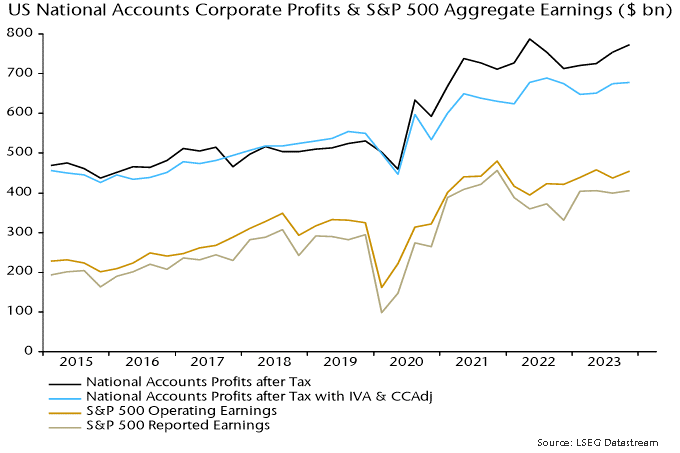
The Q4 financial accounts also contain initial estimates of corporate profits and gross domestic income (GDI). Profits after tax adjusted for stock appreciation and economic depreciation rose at a 2.5% annualised rate last quarter and remain below a peak reached in Q3 2022 – chart 4, blue line. The range-bound movement is consistent with S&P 500 earnings data and questions perceptions of economic / profits strength.
Chart 4
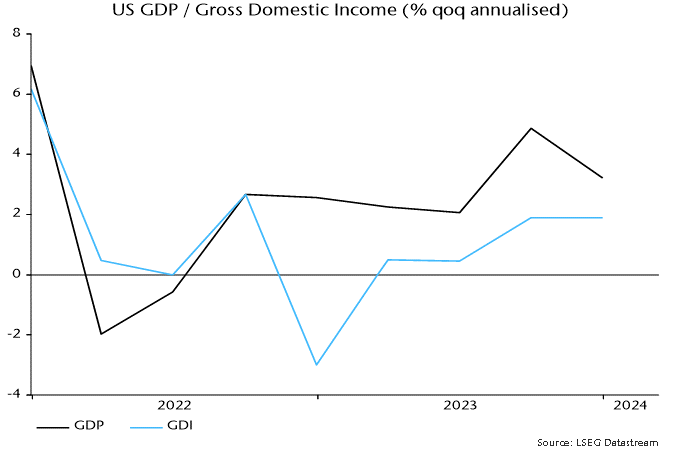
GDI is an alternative estimate of GDP and has consistently lagged the headline expenditure-based measure in recent quarters – see previous post. It did so again in Q4, rising at a 1.9% annualised rate versus headline GDP growth of 3.2% – chart 5. GDI grew by just 1.2% in the year to Q4.
Chart 5