Money Moves Markets
US core inflation: staying optimistic
May 3, 2024 by Simon Ward
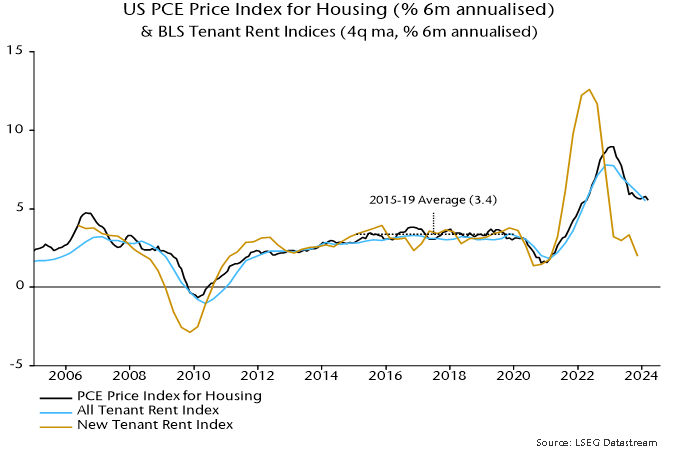
The Fed’s preferred core price measure – the PCE price index excluding food and energy – rose by an average 0.36% per month, equivalent to 4.4% annualised, over January-March.
The FOMC median projection in March was for annual core inflation to fall to 2.6% in Q4 2024. This would require the monthly index rise to step down to an average 0.17% over the remainder of the year – see chart 1.
Chart 1
The judgement here is that such a slowdown is achievable and could be exceeded, based on the following considerations.
First, such performance was bettered in H2 2023, when the monthly rise averaged 0.155%, or 1.9% annualised, i.e. the requirement is within the range of recent experience.
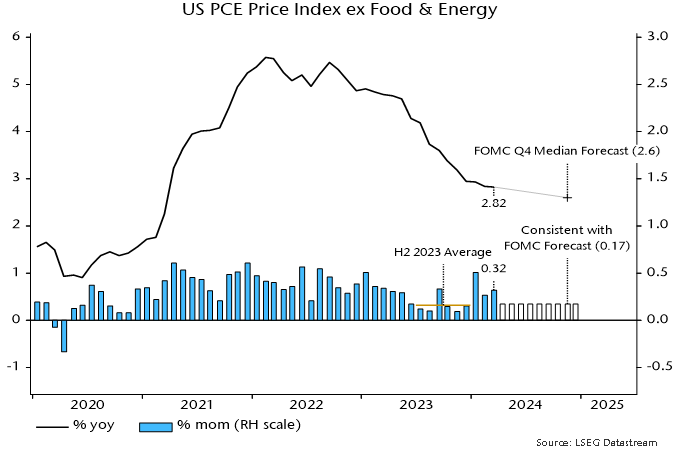
Secondly, the monetarist rule of thumb of a two-year lead from money to prices suggests a strong disinflationary impulse during H2 2024. From this perspective, any current “stickiness” may reflect the after-effects of a second pick-up in six-month broad money momentum in 2021, following the initial surge into mid-2020– see chart 2.
Chart 2
Momentum returned to a target-consistent 4-5% annualised in April 2022, subsequently turning negative and recovering only from March 2023, with the latest reading still sub-5%. Allowing for the usual lag, the suggestion is that six-month price momentum will move below 2% in H2 2024, remaining weak through next year.
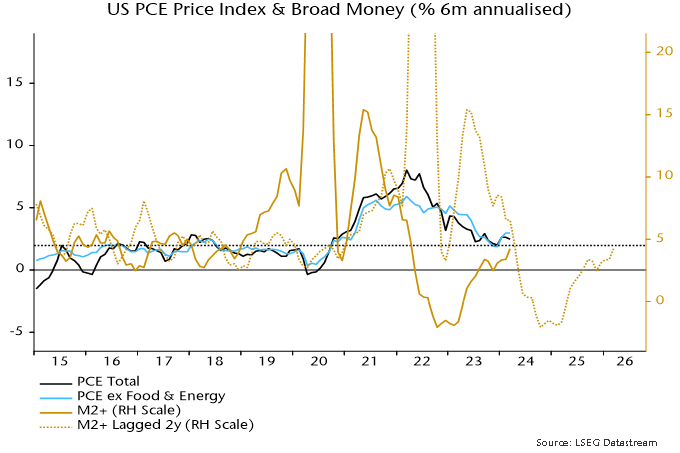
A third potential favourable influence is a speeding-up of the transmission of recent slower growth of timely measures of market rents to the PCE housing component. Six-month momentum of the latter was still up at 5.6% annualised in March but weakness in the BLS new tenant rent index through 2023 is consistent with a return to the pre-pandemic (i.e. 2015-19) average of 3.4% or lower – chart 3. With a weight of 17.5%, such a decline would subtract 3 bp from the monthly core PCE change.
Chart 3