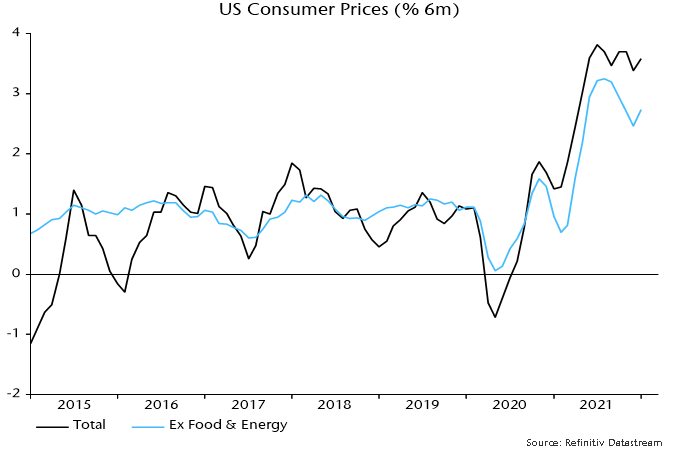
Year-on-year headline and core CPI inflation rates rose further in January, to 7.5% and 6.0% respectively, but six-month momentum remained below peaks reached in July-August – see chart 1.
Chart 1
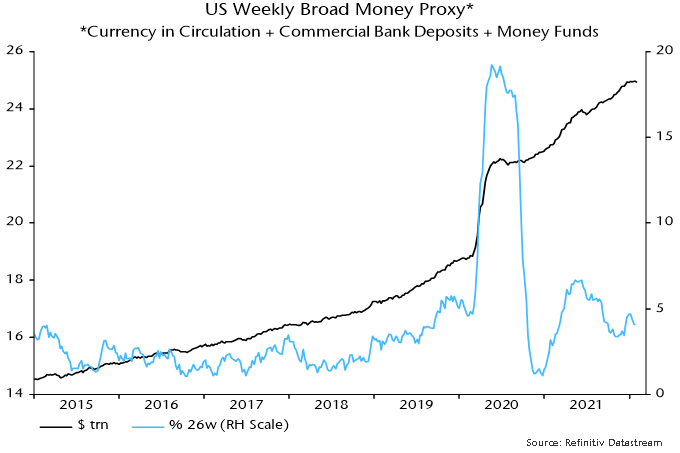
The fundamental cause of current high inflation is excessive monetary expansion in 2020-21 but six-month growth of broad money has returned to its pre-pandemic pace – chart 2. Weekly numbers have stagnated since December, when tapering started.
Chart 2
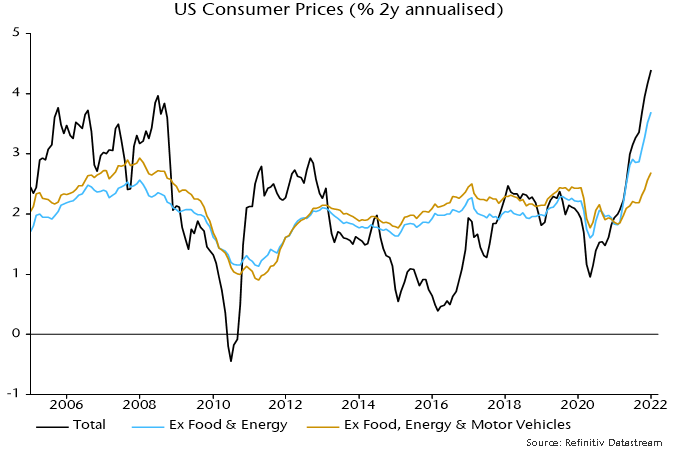
The year-on-year core rate of 6.0% overstates underlying inflation because of base effects and a one-off surge in vehicle prices. Year-on-year was only 1.4% in January 2021 so core prices have risen at an average rate of 3.7% pa over the last two years.
The CPI component for new and used vehicles soared by 28.1% between January 2020 and January 2022, boosting core CPI by 2.5 pp – vehicles had a 9.1% weight in the core basket in January 2020.
Stripping out vehicles, core CPI rose by “only” 2.7% pa in the two years to January. Two-year inflation on this measure reached a higher peak in the 2000s – chart 3.
Chart 3
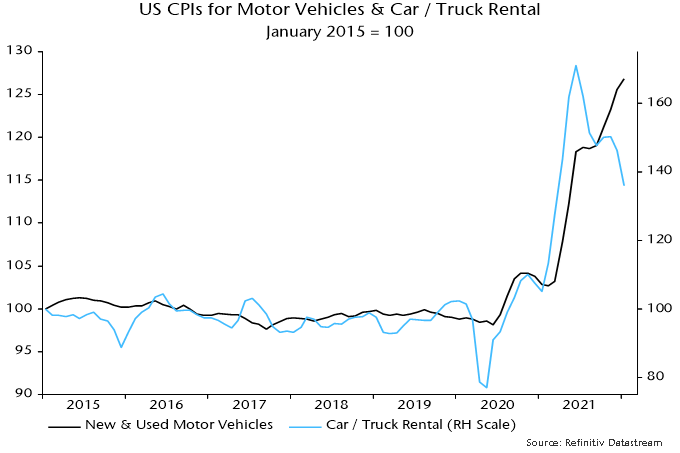
Vehicle prices should correct as supply constraints ease and high fuel prices depress demand. A recent fall in car / truck rental rates may be a harbinger – chart 4.
Chart 4
Suppose that core CPI ex. vehicles rises by 3.5% over the coming 12 months, above its two-year rate of increase of 2.7% pa. If vehicle prices were to correct by 10% over this period, the conventional core rate would fall to 1.9% in January 2023.
Actual and imputed rents are widely expected to exert upward pressure on core inflation. However, year-on-year rental inflation would have to rise from the current 4.4% to 8% to offset a 10% fall in vehicle prices. Rental inflation hasn’t breached 6% since the mid 1980s.
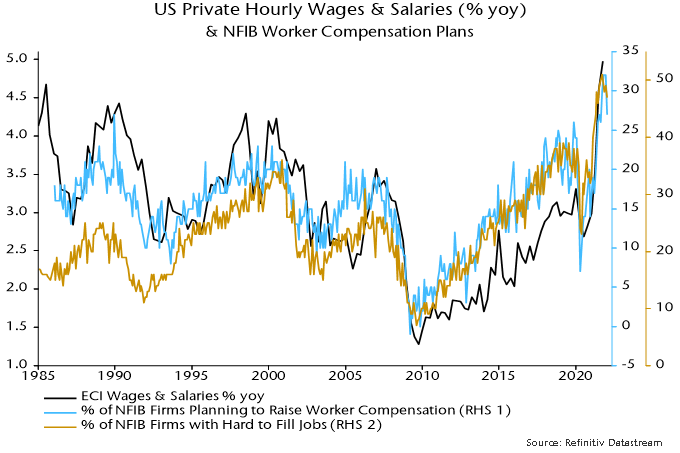
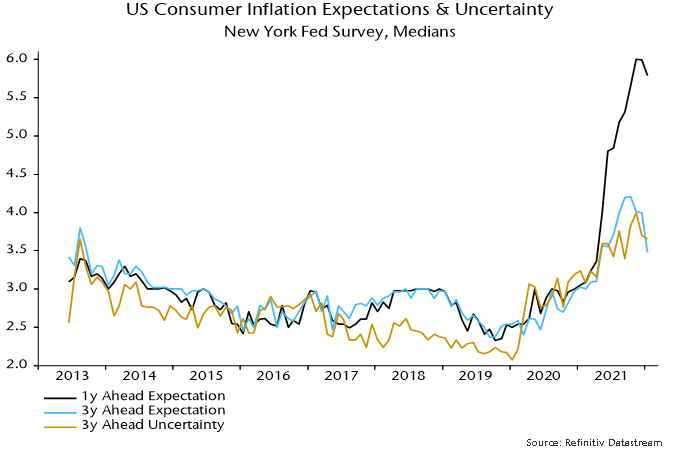
The Fed and other central banks are focused on backward-looking inflation indicators, including wage growth and (adaptive) inflation expectations, rather than money trends. Even these are showing signs of peaking: NFIB small firm worker compensation plans eased in January while New York Fed consumer expected inflation measures fell – charts 5 and 6.
Chart 5
Chart 6
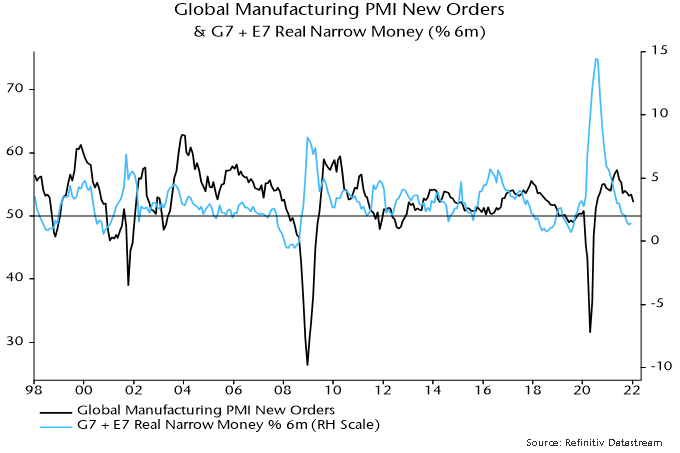
The global economic slowdown signalled by monetary trends appears to be playing out. The global manufacturing PMI new orders index fell to an 18-month low in January and is now 5.1 points below a May peak – see chart 1.
Chart 1
A decline in global six-month real narrow money growth into November suggests a further PMI fall into mid-year, at least, allowing for a typical 6-7 month lead. Real money growth recovered marginally in December but could weaken again in January – a provisional number will be available by early next week. Eurozone growth is likely to have turned negative based on last week’s CPI data, showing a further spike in six-month momentum.
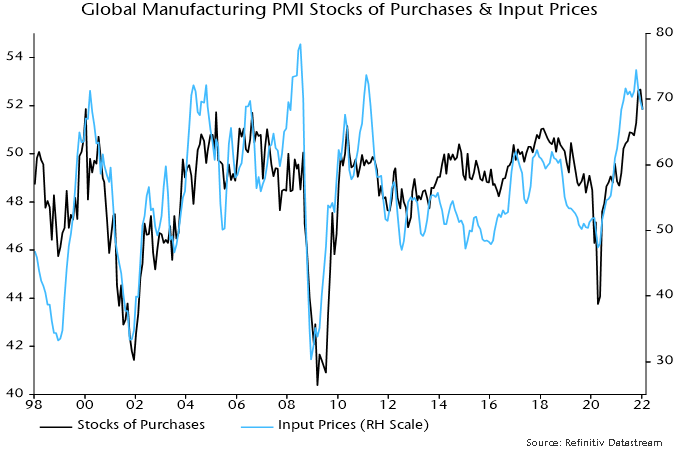
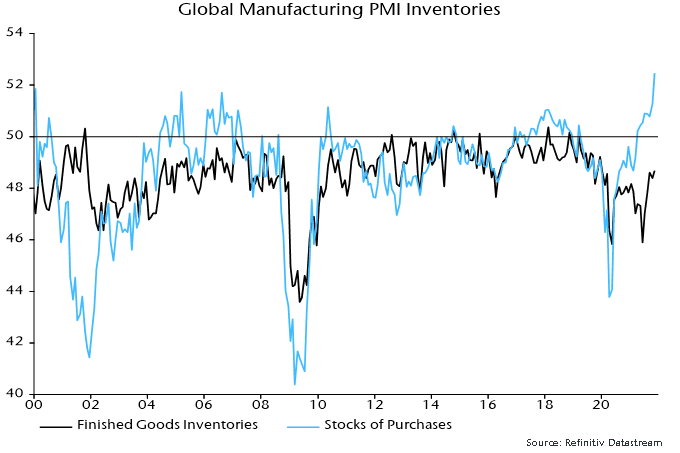
The manufacturing PMI stocks of purchases index reached a record level in December but fell back in January, consistent with the view here that the stockbuilding cycle has peaked and is about to enter a 12-18 month downswing phase. The coming inventory slowdown (and eventual liquidation) is likely, as usual, to be associated with a significant weakening of goods price pressures – chart 2.
Chart 2
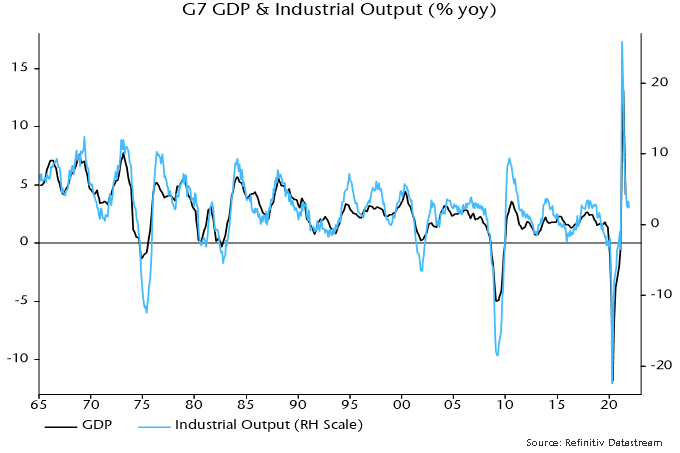
Optimists argue that services strength as pandemic disruption ends will outweigh any industrial slowdown. The (Keynesian) understanding here is that economic fluctuations are driven by goods spending and investment in particular. GDP growth swings mirror those in industrial output: the correlation coefficient of year-on-year changes was +0.89 over 1965-2020 – chart 3. There is no independent cycle in services demand. A services rebound as conditions normalise is likely to burn out swiftly if the industrial slowdown deepens.
Chart 3
The supposedly “blow-out” US jobs report has no implication for the assessment here, except to increase the likelihood of a Fed policy mistake. Labour market data are not forward-looking and the details of the report were much less impressive than the headlines.
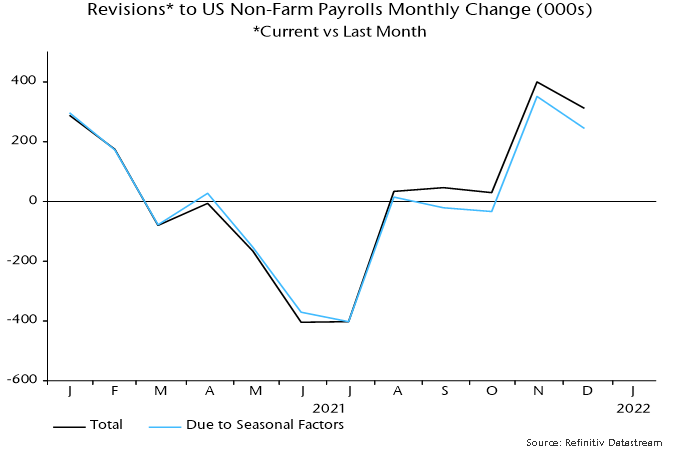
Huge upward revisions to November / December payrolls growth reflected new seasonal factors, with offsetting downgrades to June / July numbers – chart 4
Chart 4
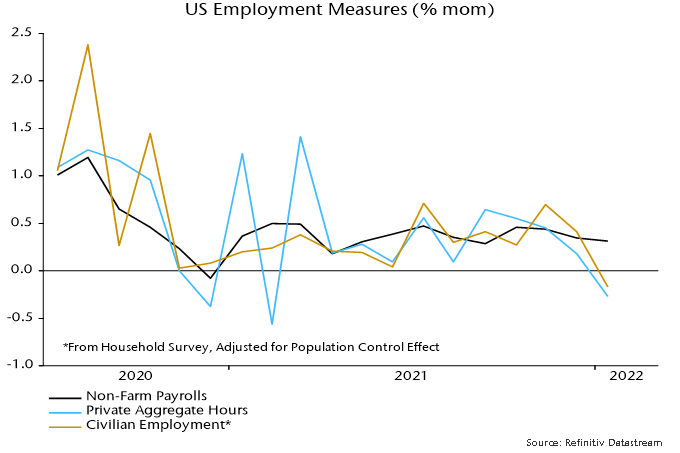
Payrolls rose solidly in January (with a boost from the new seasonal factor) but pandemic disruption showed up in falls in aggregate hours and the household survey employment measure – chart 5.
Chart 5
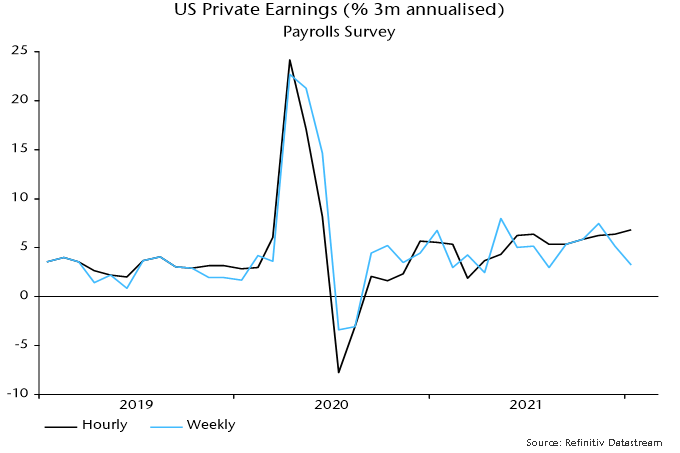
The drop in weekly hours may explain the larger-than-expected hourly earnings increase, assuming that lower-earners were more likely to have their hours cut. Weekly earnings growth remains range-bound – chart 6.
Chart 6
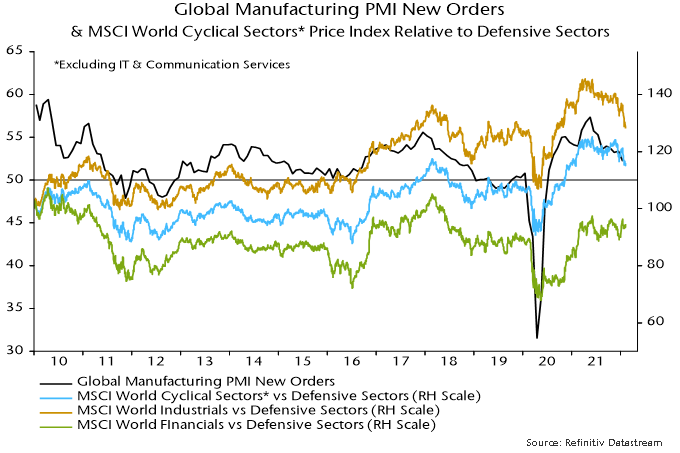
The PMI fall has been reflected in underperformance of MSCI-defined cyclical sectors versus defensive sectors but there is significant variation within the groupings, most notably the continued strength of financials – chart 7.
Chart 7
This resilience, of course, reflects rising bond yields and is likely to fade if waning economic momentum and easing price pressures pull these lower.
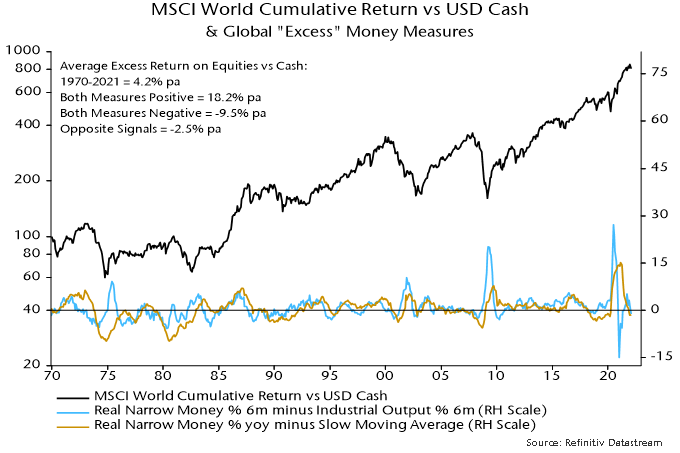
The view here remains that the rise in bond yields – like the outperformance of value versus growth – reflects a less favourable monetary backdrop for markets rather than a reprise of the “reflation trade”. Both “excess” money measures tracked here remain negative – chart 8.
Chart 8
The “monetarist” view is that central banks should conduct policy with the aim of stabilising growth of (broad) money at a non-inflationary rate.
Major central banks – the Fed and Bank of England in particular – trashed this principle in 2020-21, pursuing policies that caused money growth to explode, with the inflationary consequences still playing out.
The MPC’s decision in November 2020 to launch a further £150 bn of QE when annual broad money growth – as measured by non-financial M4* – was already at 12% was one of the worst in its 25-year history.
So what is the monetarist policy recommendation now?
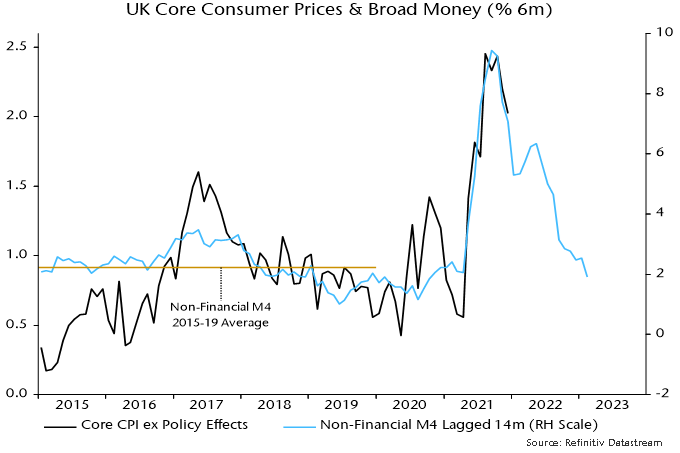
In the UK, it is to do nothing. Broad money momentum slowed sharply during 2021, with non-financial M4 rising by 1.9% or 3.9% at an annualised rate in the six months to December. This is close to the average in the five years preceding the pandemic and, if sustained, would be consistent with core CPI inflation returning to around target over the medium term – see chart 1.
Chart 1
The H2 broad money slowdown occurred despite QE continuing until November. Monthly growth of non-financial M4 fell to just 0.1% in December.
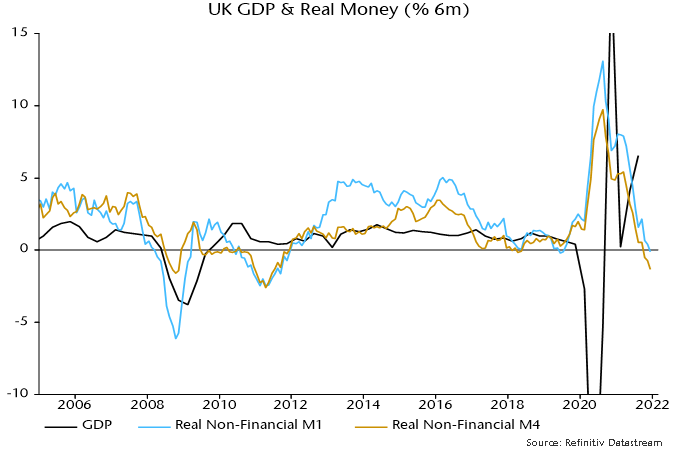
The combination of high inflation due to 2020-21 policy mistakes and the recent monetary slowdown has resulted in a contraction of real money balances, suggesting already-weak economic prospects – chart 2. Policy tightening into such a contraction risks pushing the economy into a recession.
Chart 2
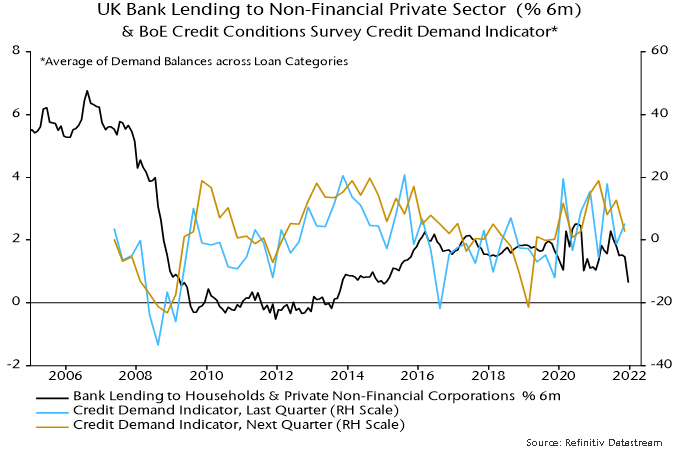
The MPC, on the view here, should wait for a rebound in money growth before raising rates and starting to reduce its gilts portfolio. Such a rebound is likely to depend on a pick-up in private sector credit growth, of which there is no sign in recent lending data or the Bank of England’s credit conditions survey – chart 3.
Chart 3
A consensus view is that the MPC needs to tighten to prevent high inflation becoming embedded in expectations. The best way of anchoring inflation expectations is to maintain low, stable money growth.
Another argument is that a period of weak money growth is warranted to offset excess expansion in 2020-21. Such attempts at monetary fine-tuning are hazardous and liable to create more volatility. The suspicion here is that “excess” money balances have already been largely absorbed by asset price / wealth gains (and an associated rise in the portfolio demand for money) and the current inflation surge.
*M4 holdings of the household sector and private non-financial corporations.
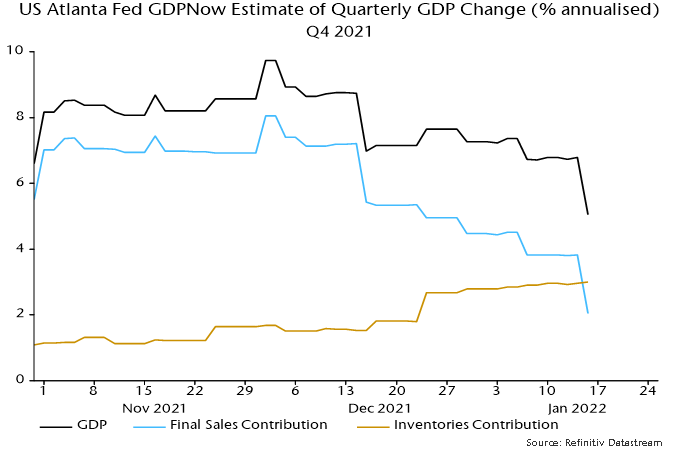
Recent US economic news has surprised negatively when properly weighted for significance. The Atlanta Fed’s nowcast of the contribution of final sales to Q4 annualised GDP growth has been slashed from 8.1 percentage points at the start of December to just 2.0 pp currently – see chart 1.
Chart 1
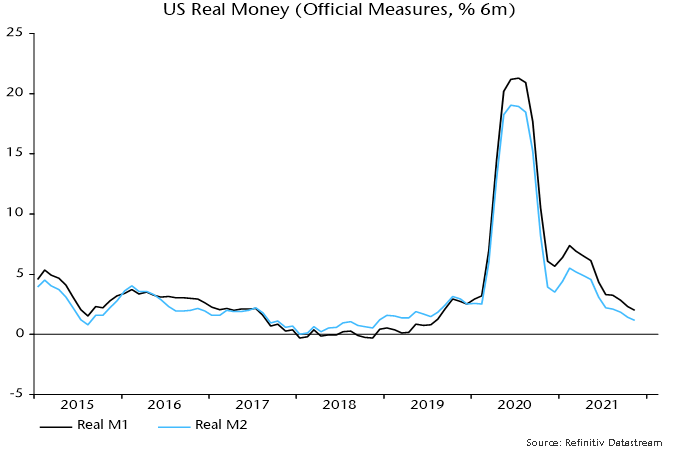
The most recent lurch down was driven by shockingly bad December retail sales – inflation-adjusted sales have now dropped 10% from their stimulus-inflated March peak.
The consensus is discounting weakness as temporary and due to the omicron wave. The “monetarist” forecast is that a cyclical slowdown is under way related to a big fall in real money growth since 2020 – chart 2.
Chart 2
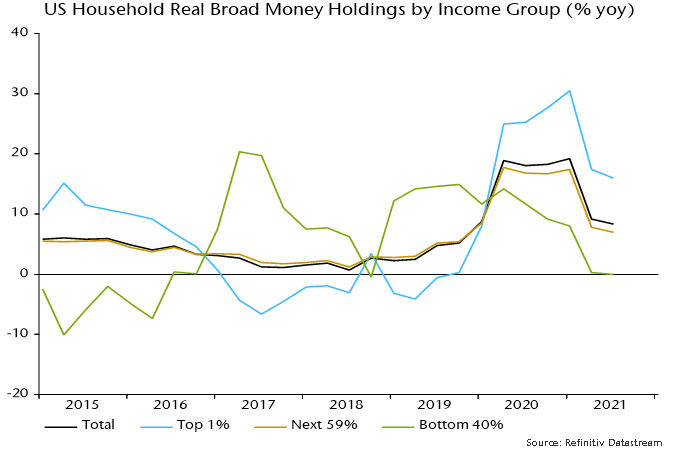
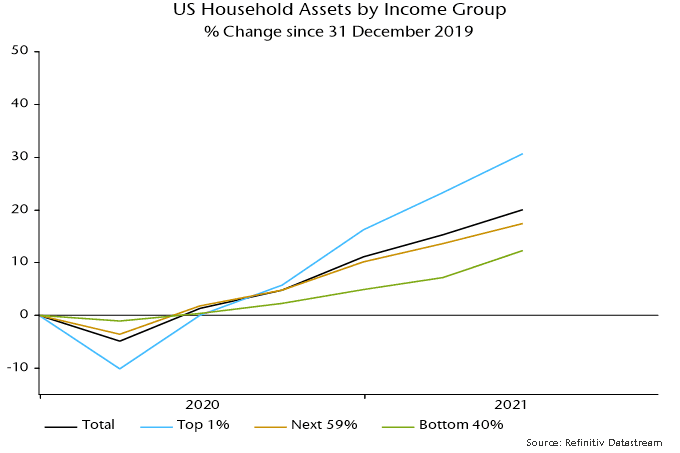
The distribution of money growth, moreover, looks unfavourable for demand growth. Broad money balances have risen fastest for high-income households with a lower propensity to consume. Money holdings of the bottom 40% of earners were stagnant in real terms in the year to end-Q3 – chart 3.
Chart 3
The Atlanta Fed’s Q4 GDP growth nowcast is still up at 5.0% but this reflects a whopping 3.0 pp contribution from inventories – consistent with the view here that the stockbuilding cycle is peaking.
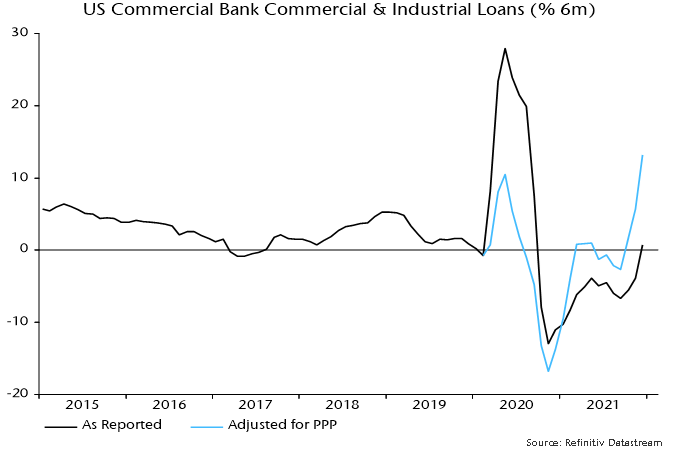
The latter estimate is based on inventory data through November but the December retail sales slump suggests further stockpiling. So does another bumper monthly rise in commercial and industrial loans, which are strongly influenced by inventory financing needs – chart 4.
Chart 4
The Fed’s “hawkish pivot” was predicated on a strong economy* but the Fed is often facing the wrong way at turning points. Officials are likely to row back if activity data continue to disappoint, even if inflation news remains unfavourable.
*From Chair Powell’s testimony to the Senate Banking Committee on 11 January: ”Today the economy is expanding at its fastest pace in many years, and the labor market is strong.”
The violent rotation in equity markets since the start of the year appears to have been driven by a tightening of liquidity conditions hitting high-flying growth stocks, rather than signalling increased economic optimism and a resumption of the late 2020 / early 2021 “reflation trade”.
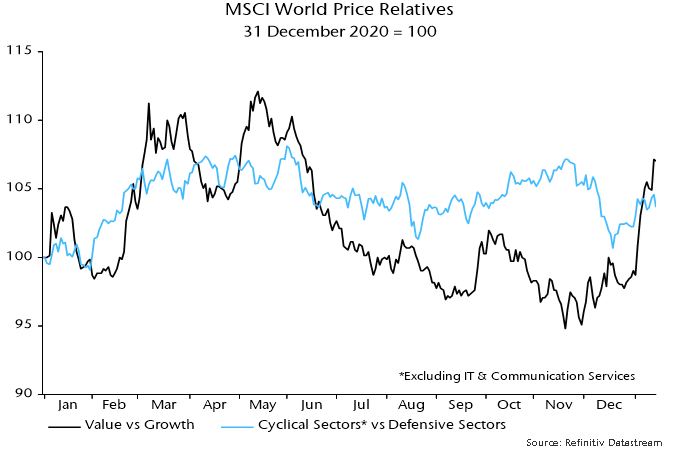
The price relative of MSCI World value to growth surged 8.1% between 31 December and last week’s close, reaching its highest level since June. The relative of non-tech cyclical sectors to defensive sectors was up by “only” 1.4% over this period and remains below a November secondary peak – see chart 1.
Chart 1
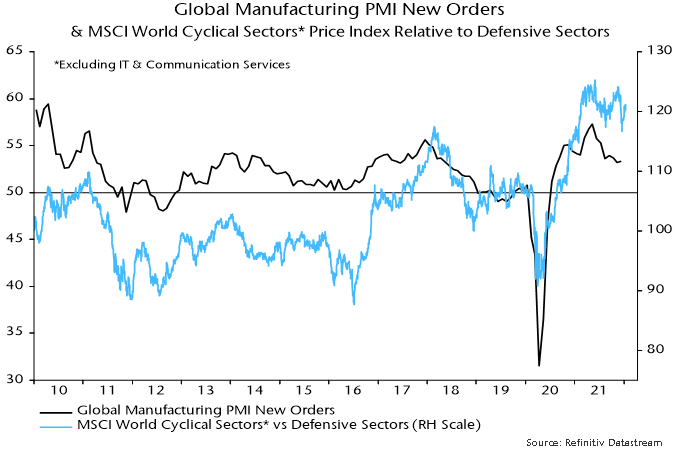
The behaviour of the cyclical to defensive sectors relative remains consistent with the view here that the global manufacturing PMI new orders index is in a downtrend – chart 2. This relative has displayed a much stronger correlation with the PMI historically than value vs. growth.
Chart 2
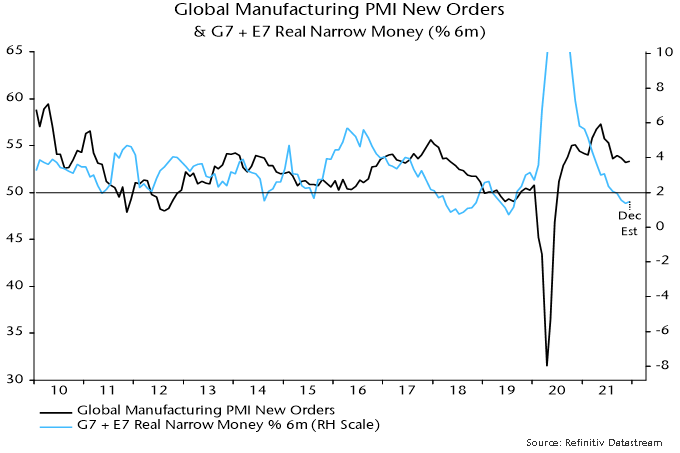
Global six-month real narrow money growth leads the PMI and is estimated to have moved sideways in December after November’s 27-month low. The suggestion is that the PMI will fall further in H1 with no recovery before Q3 at the earliest – chart 3.
Chart 3
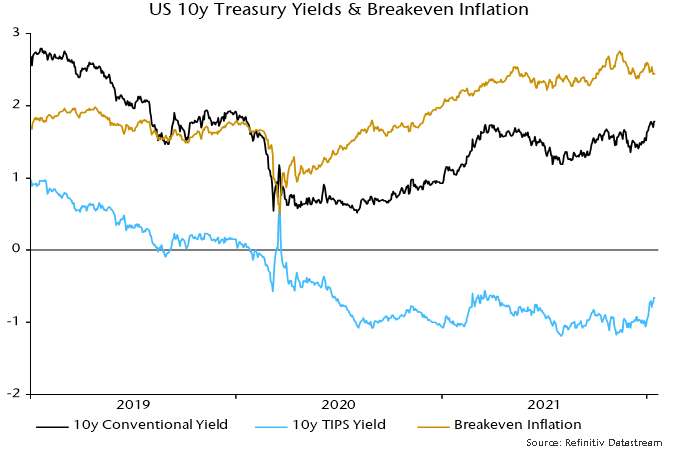
The view that equity market moves reflect liquidity tightening rather than reflation optimism is supported by the stability of Treasury market breakevens and a rising real yield – chart 4.
Chart 4
As previously discussed, both measures of global “excess” money tracked here are now negative for the first time since 2019.
On this view, the Fed’s “hawkish pivot” has been coincident with rather than the key driver of tighter liquidity.
Growth stocks may continue to suffer near term but the forecast of a global economic slowdown suggests approaching liquidity relief. The rally in the cyclical vs. defensive sectors relative, meanwhile, may reverse as activity news disappoints.
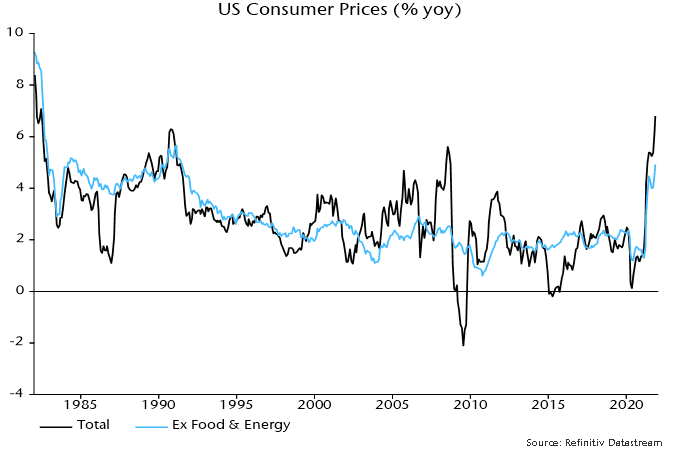
US core consumer price momentum is likely to slow sharply in early 2022 but monetary trends appear inconsistent with inflation returning to its pre-pandemic level.
Headline and core (i.e. ex. food and energy) annual inflation rates rose to their highest levels since 1982 and 1991 respectively in November (6.8% and 4.9%) – see chart 1.
Chart 1
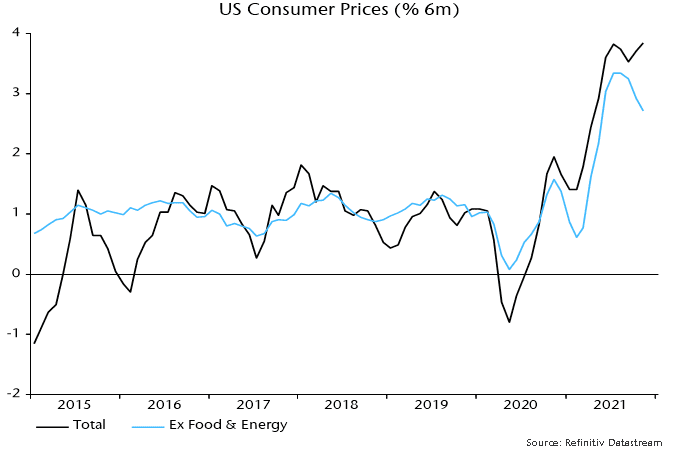
On a six-month rate of change basis, however, core momentum eased for a third month, albeit remaining high at 2.7% or 5.5% annualised – chart 2. Headline momentum was boosted by a further acceleration of food prices.
Chart 2
The moderation in core momentum mirrors a slowdown in six-month growth of broad money 14 months earlier – chart 3. The apparent relationship suggests a further significant fall in six-month core inflation.
Chart 3
A 14-month lead is notably shorter than the average in historical studies of the relationship between money and prices. The judgement here is that supply disruption due to the pandemic has accelerated the transmission mechanism.
While core momentum could slow faster than expected in early 2022, broad money trends argue against a return to the pre-pandemic level: core inflation averaged 2.0% over 2015-19. Six-month growth of the broad measure calculated here* is running at an annualised rate of about 9% versus a 2015-19 average of 5%.
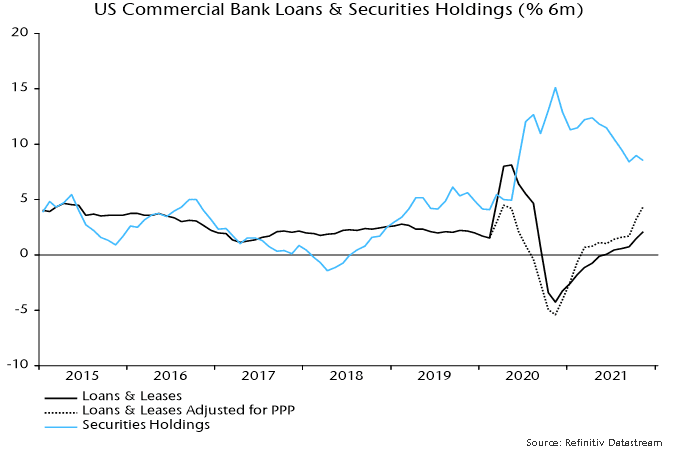
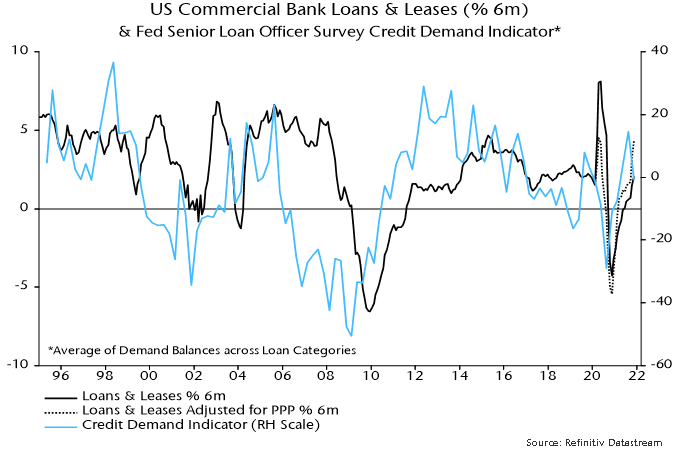
Broad money growth is being boosted by strong expansion of commercial bank assets as well as ongoing QE. Adjusting for PPP loan forgiveness, banks’ lending book grew by about 9% annualised in the six months to November, with securities holdings rising by 18% – chart 4.
Chart 4
Banks are well capitalised and highly liquid but the October Fed loan officer survey suggested a cooling of credit demand – chart 5. Securities purchases, meanwhile, could slow as QE tapering and a rebound in the Treasury’s cash balance at the Fed following Congressional approval of a rise in the debt ceiling relieve upward pressure on bank reserves.
Chart 5
*M2+ = M2 + large time deposits at commercial banks + institutional money funds.
These are the views of the author at the time of publication and may differ from the views of other individuals/teams at Janus Henderson Investors. Any securities, funds, sectors and indices mentioned within this article do not constitute or form part of any offer or solicitation to buy or sell them.
Past performance does not predict future returns. The value of an investment and the income from it can fall as well as rise and you may not get back the amount originally invested.
The information in this article does not qualify as an investment recommendation.
Marketing Communication.
The expectation here has been that monetary policy easing since Q2 would result in a recovery in Chinese money growth into end-2021, in turn presaging better economic performance in 2022. The Evergrande default threatened to derail the scenario by triggering an endogenous tightening of credit conditions but November money data suggest that it remains on track.
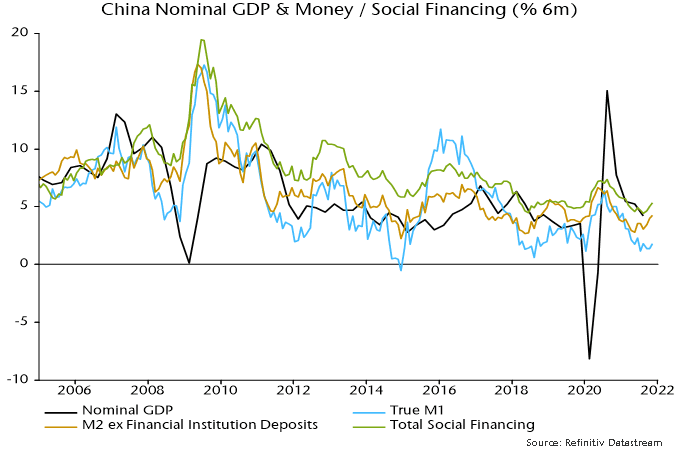
A disappointing feature of the November numbers is that six-month growth of narrow money – as measured by “true” M1, which includes household as well as corporate demand deposits – appears* to have risen only slightly and has yet to break away decisively from a July low. Growth of the broader non-financial M2 measure and aggregate credit, however, increased further, in the former case to a 12-month high – see chart 1.
Chart 1
The forecasting approach here generally places greater weight on narrow than broad money for assessing directional changes in economic momentum. In China’s case, however, the signals from the measures have been similar; indeed, there are several examples of broad money growth leading narrow money growth at lows (e.g. 2008, 2011-12, 2018).
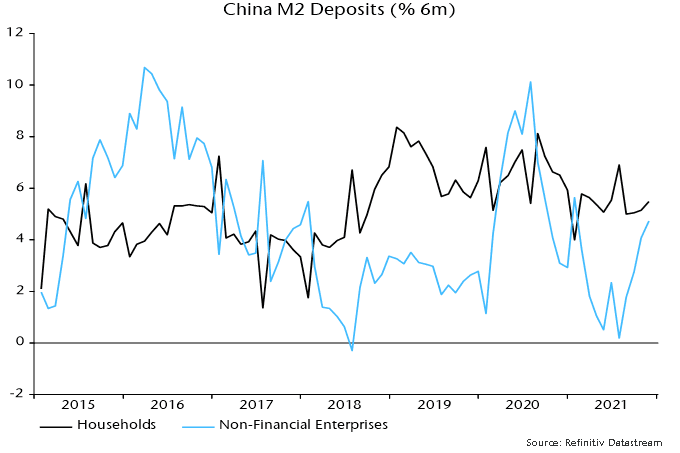
Sectoral data show a pick-up in M2 deposit growth of non-financial enterprises and continued solid household expansion – chart 2.
Chart 2
The judgement here is that the broad / narrow money divergence reflects current low economic confidence – the monetary position of households and firms has improved but this has yet to feed through to spending intentions and an associated switch out of time into demand deposits. The delayed transmission of money to the economy may reflect covid restrictions and property sector uncertainty but should proceed barring further negative shocks.
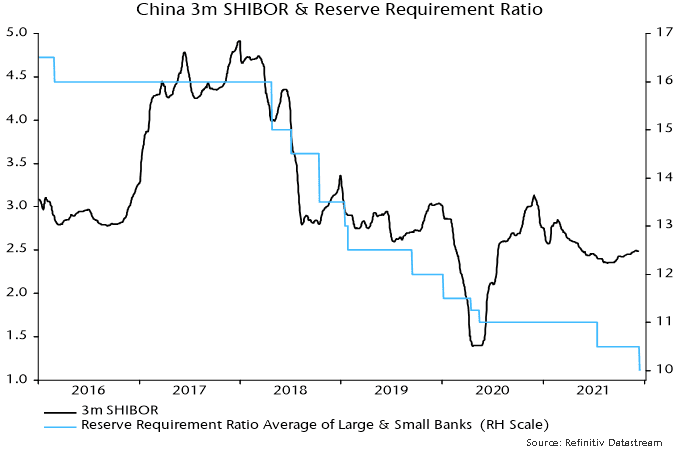
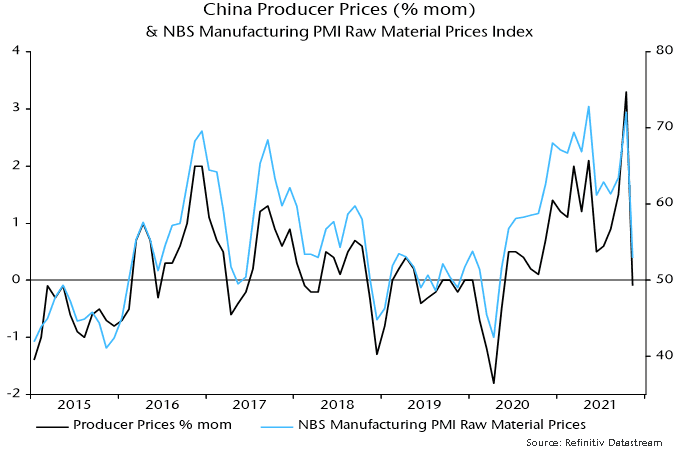
The case for optimism would be strengthened if three-month SHIBOR were to resume a decline following the latest cut in reserve requirement ratios. A July cut did not feed through to lower rates partly because the PBoC offset the impact in other money market operations – chart 3. Easing inflationary pressures – chart 4 – and property sector weakness suggest that the latest reduction is more likely to represent a genuine policy loosening.
Chart 3
Chart 4
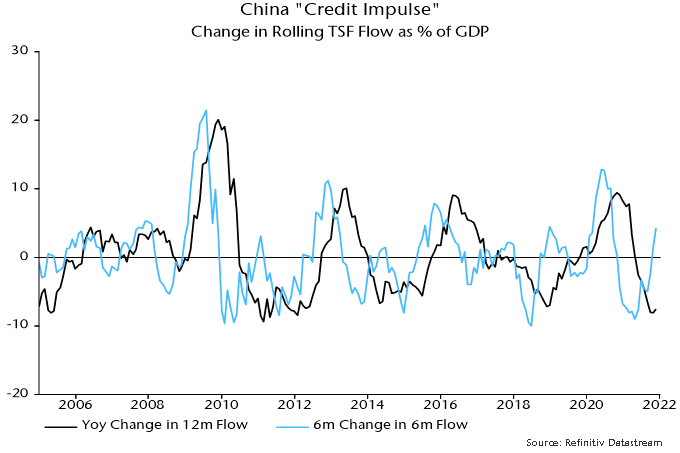
Consensus views about Chinese economic prospects are influenced by the “credit impulse” – the change in the flow of credit expressed as a percentage of GDP. Previous research here analysing long-term G7 data found that the credit impulse underperformed real narrow money growth as a leading indicator, partly because it gave more false turning point signals. Regardless, some economists / strategists are likely to call attention to a bottoming-out of the 12-month impulse and a sharp recovery in the six-month version – chart 5.
Chart 5
*The household demand deposit component is currently estimated.
These are the views of the author at the time of publication and may differ from the views of other individuals/teams at Janus Henderson Investors. Any securities, funds, sectors and indices mentioned within this article do not constitute or form part of any offer or solicitation to buy or sell them.
Past performance does not predict future returns. The value of an investment and the income from it can fall as well as rise and you may not get back the amount originally invested.
The information in this article does not qualify as an investment recommendation.
Marketing Communication.
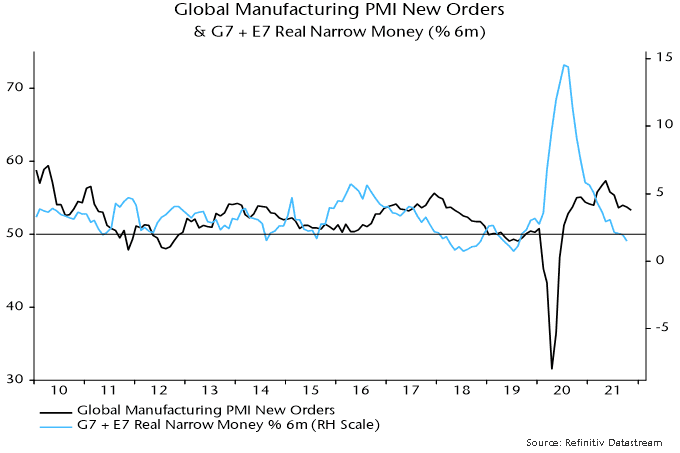
The global manufacturing PMI new orders index – a timely indicator of industrial demand momentum – eased to a 15-month low in November, continuing its decline from a May peak that was signalled by a July 2020 top in six-month real narrow money growth. With additional October data confirming a further fall in real money growth, the PMI orders slide is expected to extend into Q2 2022, at least – see chart 1.
Chart 1
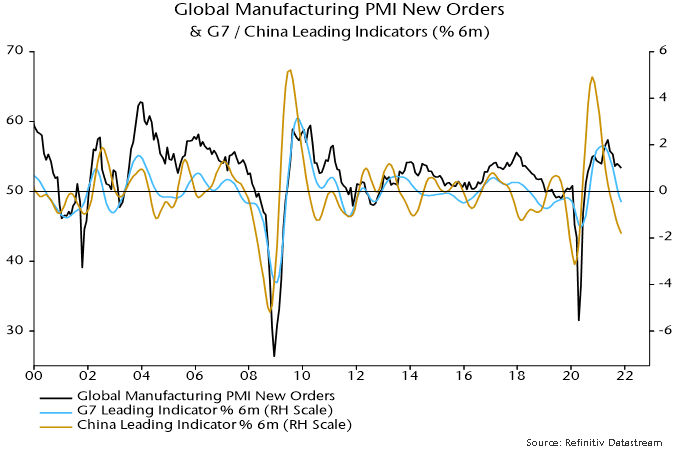
The monetary slowdown signal is supported by the OECD’s leading indicators, November estimates of which are included in chart 2. The OECD indicators mostly exclude monetary aggregates and display a shorter lead time than money.
Chart 2
The November decline in global new orders reflected a slight firming in developed markets offset by EM weakness driven by a relapse in China.
The most striking feature of the global report was a further surge in the stocks of purchases index – a gauge of the pace of input stockpiling – to a record. Finished goods inventory accumulation, by contrast, remains “normal” – chart 3.
Chart 3
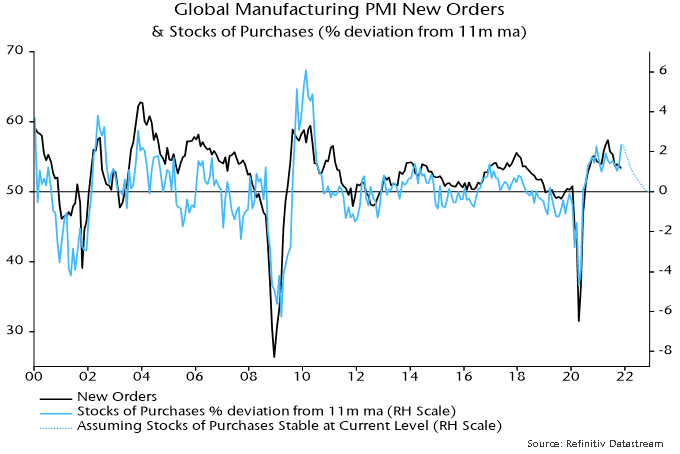
Input purchases by downstream manufacturers have boosted order flow for firms higher up the production chain. Such stockbuilding, however, is peaking and even a stabilisation at the current extreme pace would imply a drag effect on new orders – chart 4.
Chart 4
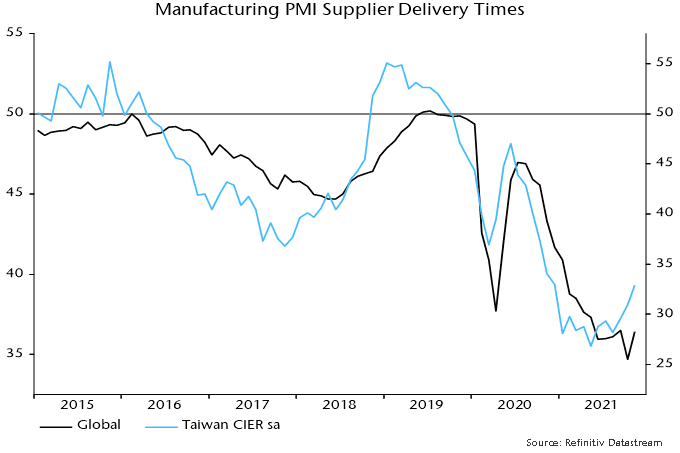
Cooling demand is starting to feed through to an easing of supply pressures. The supplier delivery times index recovered from an October record low (rise = faster), with an extension of an earlier turnaround in Taiwan, which typically leads, suggesting further improvement – chart 5.
Chart 5
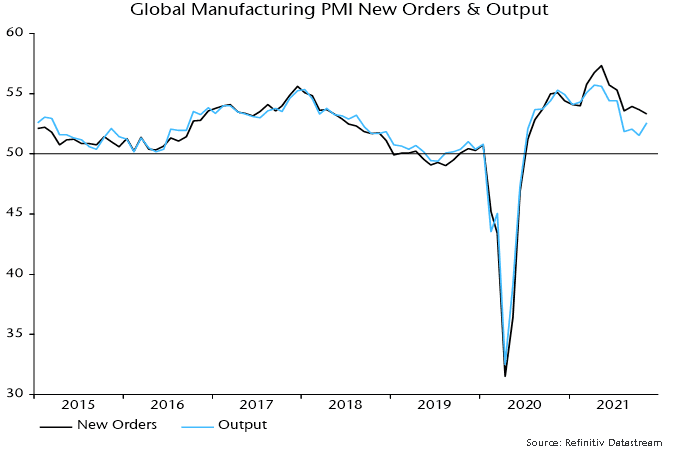
Easing supply problems and a possible pick-up in finished goods inventory accumulation suggest that the PMI output index will catch up with and temporarily overtake new orders – chart 6. An improved supply / demand balance should also be associated with moderating price indices, which probably topped in October.
Chart 6
The judgement here is that markets will focus on softening demand / price momentum and “look through” a temporary output pick-up. Any reignition of the cyclical / reflation trade is likely to require a prior rebound in global real money growth.
These are the views of the author at the time of publication and may differ from the views of other individuals/teams at Janus Henderson Investors. Any securities, funds, sectors and indices mentioned within this article do not constitute or form part of any offer or solicitation to buy or sell them.
Past performance does not predict future returns. The value of an investment and the income from it can fall as well as rise and you may not get back the amount originally invested.
The information in this article does not qualify as an investment recommendation.
Marketing Communication.
The consensus expects US consumer spending to continue to grow solidly despite the current inflation squeeze on real wages and associated weakness in sentiment / confidence – the average forecast is for a rise of 3.6% in 2022, according to Consensus Economics Inc. This partly reflects an assessment that spending has been supply-constrained while consumers have substantial unused fire-power in the form of money balances accumulated against a background of high saving over the past 18 months.
The suspicion here is that much of the increase in money holdings reflects portfolio and precautionary demand, implying little implication for near-term spending prospects.
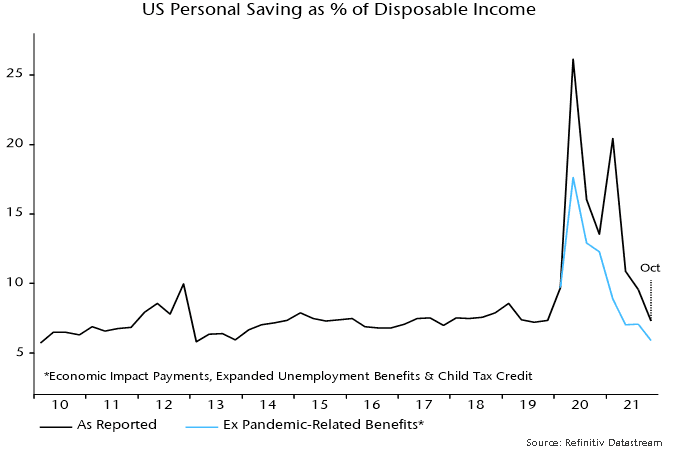
The personal saving ratio has now fully reversed its 2020 surge, with October’s 7.3% reading the same as in December 2019 – see chart 1.
Chart 1
The ratio, moreover, continues to be inflated by temporary pandemic-related benefits, which are winding down and will expire at year-end. Excluding such benefits from the income definition, the saving ratio was 5.9% in October, close to a post-GFC low of 5.8% reached in 2013.
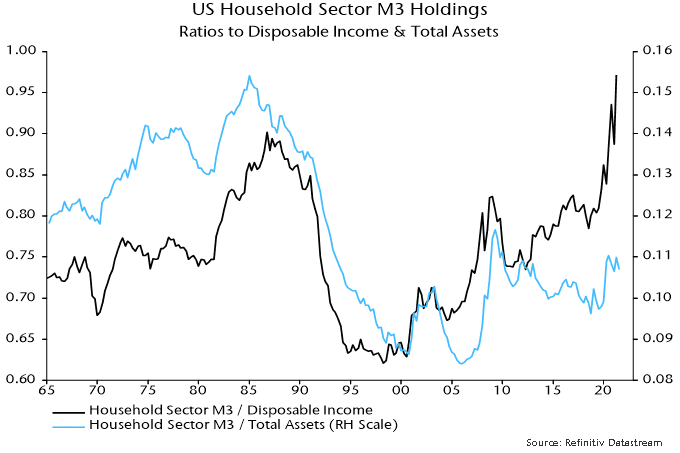
Bulls argue that the saving ratio will remain low or fall further as supply shortages and pandemic disruption fade, allowing consumers to spend accumulated money balances. According to the Fed’s financial accounts, households’ broad money (M3*) holdings surged by 29.9% between end-2019 and mid-2021, pushing their ratio to disposable income to a record – chart 2.
Chart 2
The demand for money, however, depends on portfolio considerations as well as income / spending. With household wealth – housing as well as financial – growing strongly before and during the pandemic, the ratio of money holdings to total assets remains within its post-GFC range and below the long-term historical average.
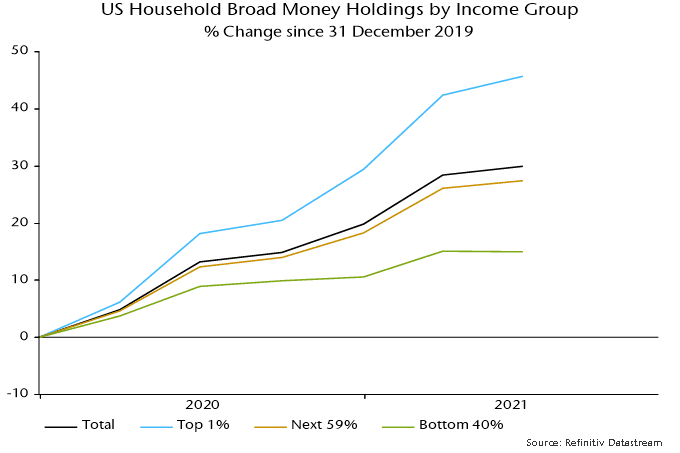
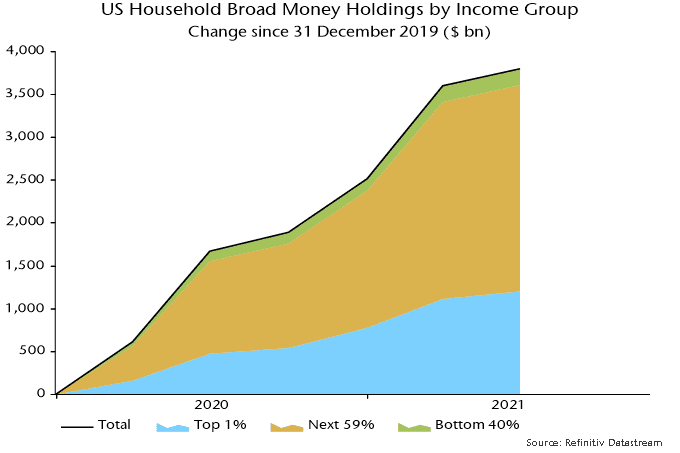
The suggestion that much of the money surge reflects portfolio demand rather than unsatisfied consumer spending is supported by Fed data breaking down money holdings by income level.
M3 holdings of the top 1% of income-earners rose by 45.7% between end-2019 and mid-2019, accounting for 9.5 pp of the 29.9% increase in total household money balances over this period – charts 3 and 4.
Chart 3
Chart 4
The bulk of the remaining increase in money holdings was absorbed by other households in the top 60% of the income distribution – their money balances grew by 27.4%. The bottom 40% of income-earners accounted for only 1.5 pp of the 29.9% increase in household M3, their holdings growing by 15.0%.
The money growth ranking of the three groups mirrors relative increases in wealth: total assets of the top 1% of income-earners rose by 30.6% between end-2019 and mid-2020 versus growth of “only” 12.4% for the bottom 40% – chart 5
Chart 5
Independent of portfolio money demand considerations, the marginal propensity to consume out of money balances is likely to be lower for higher-income households.
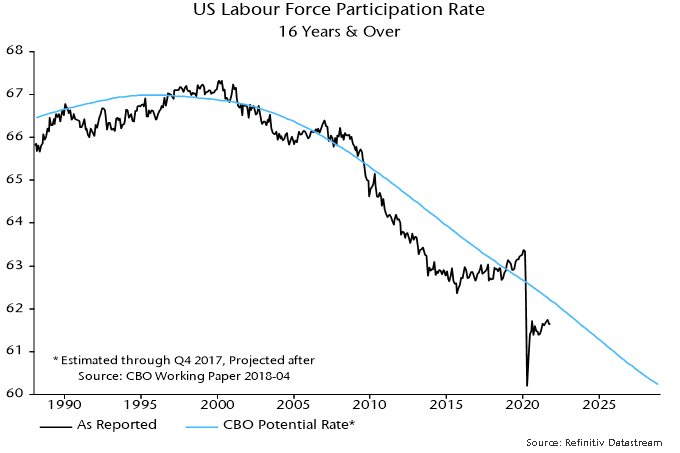
If the above argument – that high money balances may not signal further consumer spending strength – is correct, the consensus forecast for spending growth in 2022 is likely to require strong expansion of employment incomes. This, in turn, may depend on a significant recovery in labour force participation.
A CBO study in 2018 contained a long-term projection for the “potential” (i.e. cyclically-adjusted) labour force participation rate based mainly on demographic factors (i.e. the changing age structure of the population). This projection suggests that most of the recent decline is “structural”, in which case Fed / consensus assessments of labour market slack (and possible employment growth as this is absorbed) may be overoptimistic – chart 6.
Chart 6
*Checkable deposits and currency, time and savings deposits, and money market fund shares.
These are the views of the author at the time of publication and may differ from the views of other individuals/teams at Janus Henderson Investors. Any securities, funds, sectors and indices mentioned within this article do not constitute or form part of any offer or solicitation to buy or sell them.
Past performance does not predict future returns. The value of an investment and the income from it can fall as well as rise and you may not get back the amount originally invested.
The information in this article does not qualify as an investment recommendation.
The term “excess money” describes a monetary backdrop in which growth of the stock of money exceeds the rate necessary to support economic expansion. Excess money is associated with increased demand for financial assets and upward pressure on their prices, other things being equal.
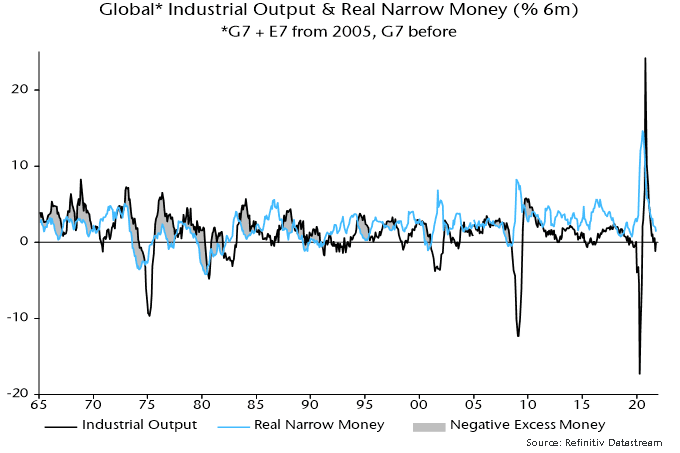
Excess money cannot be measured directly. Two global proxies are followed here: the gap between six-month growth rates of real narrow money and industrial output; and the deviation of 12-month real narrow money growth from a slow moving average.
These measures have been strongly correlated with equity market performance historically. Between 1970 and 2020, global equities outperformed US dollar cash by 17.9% pa on average when the two measures were positive (allowing for reporting lags). They underperformed by an average 3.6% pa when one of the measures was negative and by 9.2% when both were.
The first measure remains positive despite a large fall in six-month real narrow money growth because of offsetting weakness in industrial output – see chart 1. Output growth has been held back by supply constraints and is likely to bounce back temporarily as these ease.
Chart 1
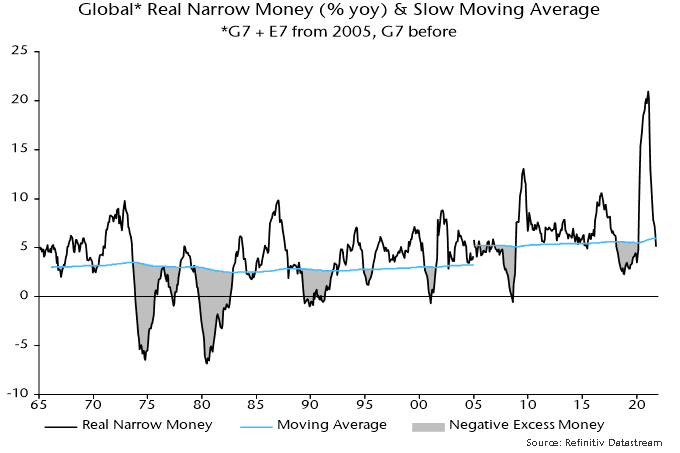
12-month real narrow money growth is estimated to have fallen below the slow moving average in October, turning the second measure negative – chart 2.
Chart 2
The long-term performance of equities / cash switching rules based on the individual measures has been similar. The second measure, however, has outperformed in the recent past – the associated rule recommended cash at the start of 2020, switched to equities in April and now suggests a move back into cash.
The rule associated with the first measure recommended equities in 2020 but switched to cash for several months in early 2021, reflecting a spike rebound in industrial output growth. Equities continued to climb during this period.
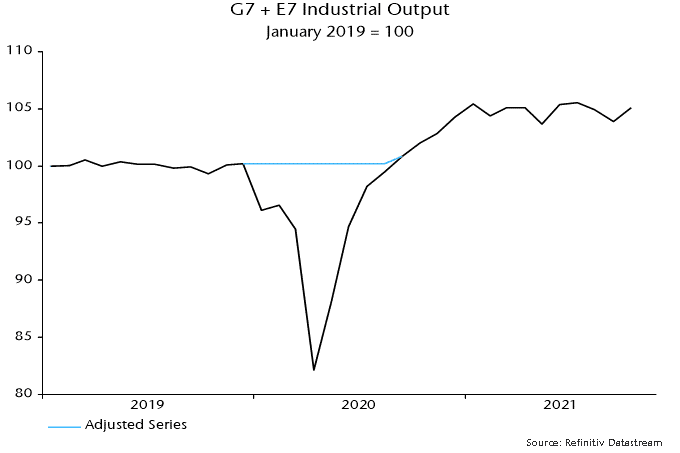
The lesson from this experience is that output volatility due to temporary non-cyclical factors – in this case the covid shock – should be discounted when using this measure. For example, the V-shaped fall and rebound in global industrial output during 2020 could (should) have been removed from the measure by using the alternative series shown in chart 3. An excess money measure incorporating the adjusted series indicated that the monetary backdrop remained favourable in early 2021.
Chart 3
These are the views of the author at the time of publication and may differ from the views of other individuals/teams at Janus Henderson Investors. Any securities, funds, sectors and indices mentioned within this article do not constitute or form part of any offer or solicitation to buy or sell them.
Past performance does not predict future returns. The value of an investment and the income from it can fall as well as rise and you may not get back the amount originally invested.
The information in this article does not qualify as an investment recommendation.