The “monetarist” rule of thumb that broad money growth leads inflation by two years suggests a rapid fall in G7 CPI inflation in 2023 and an undershoot of targets by H2 2024.
Annual growth of the G7 broad money measure calculated here is likely to have fallen below 3% in October, based on US and Japanese data. The money stock appears to have stagnated in the latest three months, with a contraction in the US offsetting weak growth elsewhere*.
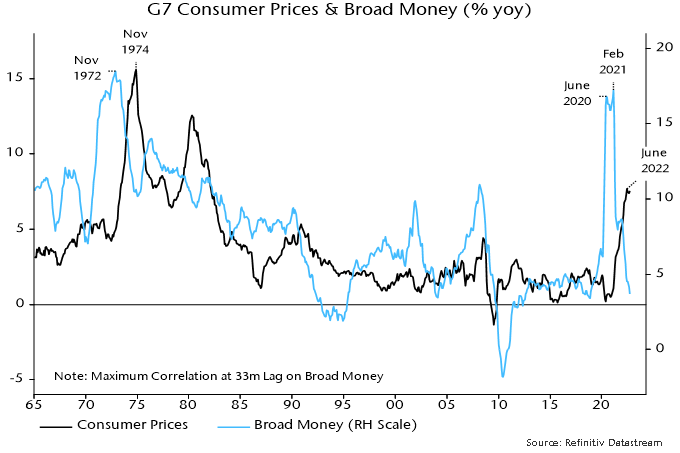
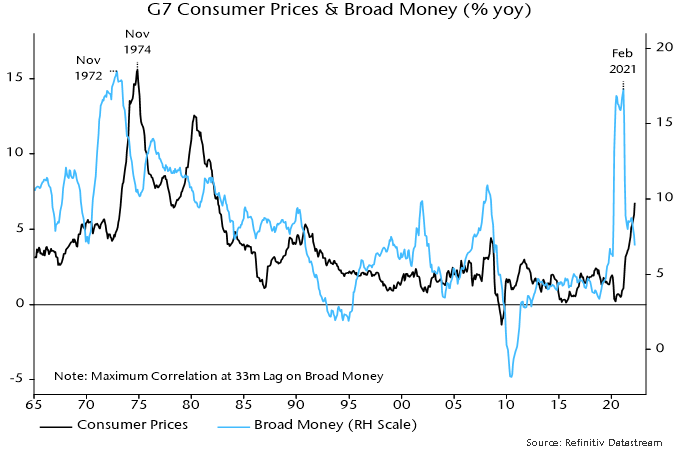
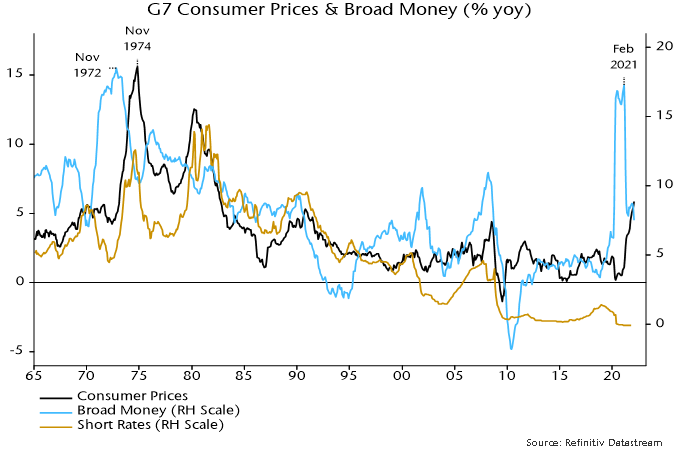
The monetarist rule worked perfectly in the early 1970s, when a surge in annual money growth to a peak in November 1972 was followed by a spike in annual CPI inflation to a high exactly two years later – see chart 1.
Chart 1
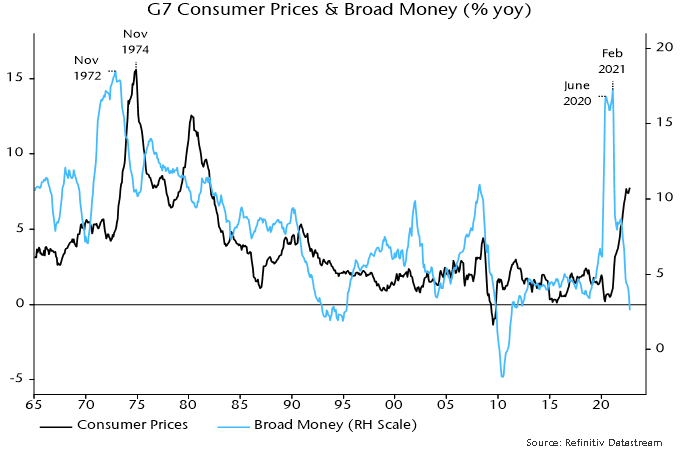
Inflation fell sharply from its 1974 peak, mirroring a big decline in money growth in 1973-74. The difference from now is that annual money growth bottomed above 10%, resulting in inflation stalling at a still-high level.
The money growth surge in 2020-21 was almost complete by June 2020 but a final peak was delayed until February 2021. Consistent with the two-year rule, CPI inflation spiked into June 2022, since moving sideways. It may or may not make a final peak but the rule suggests that a major decline will be delayed until after February 2023.
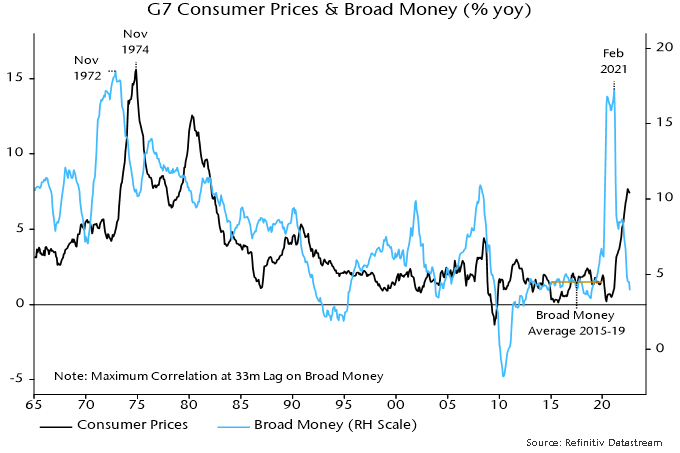
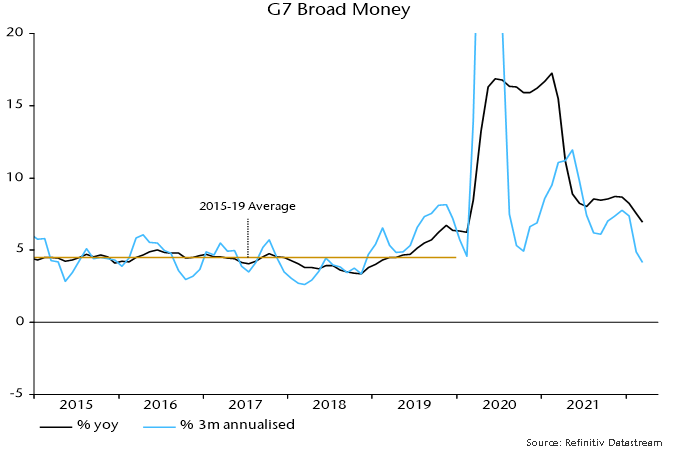
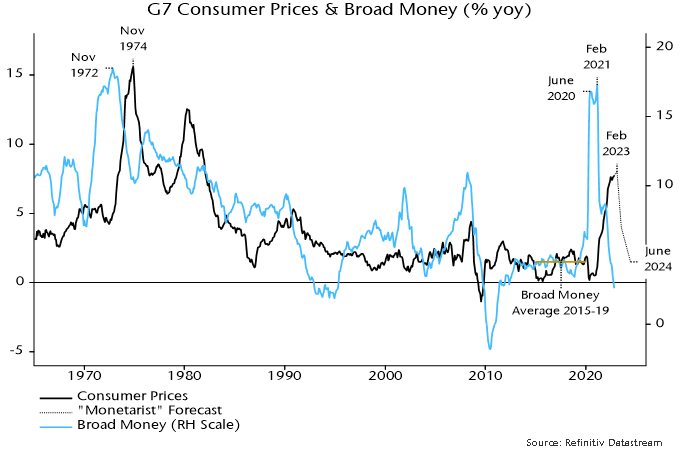
Broad money growth averaged 4.5% in the five years to end-2019. CPI inflation averaged 1.9% in the five years to end-2021 (i.e. allowing for the two-year lag). Money growth returned to the 2015-19 average in June 2022 (4.4%). The monetarist rule, therefore, suggests that inflation will be back below 2% by mid-2024 and will continue to move lower later in the year, reflecting the further decline in money growth since June.
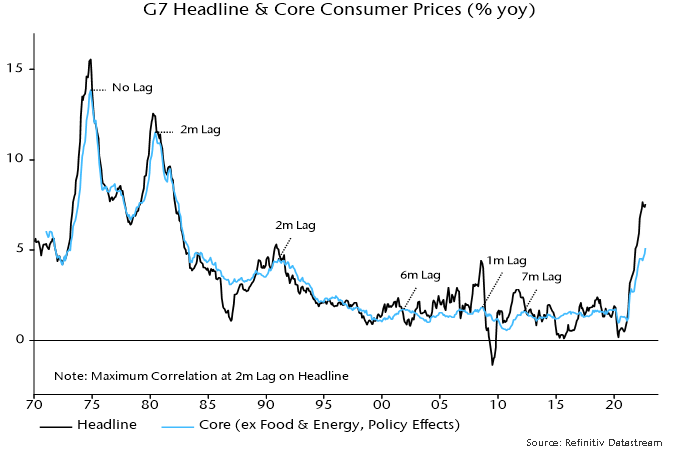
How fast will inflation fall? A reasonable assumption is that its decline will mirror the rapid drop in money growth two years earlier, consistent with the 1970s experience. An illustrative projection is shown in chart 2. Inflation, currently at 7.8% (October estimate), falls to 4% in July 2023 and below 3% by December.
Chart 2
Some monetarist economists expect inflation to be stickier in 2023. They argue that there is still a monetary “overhang” from the growth surge in 2020-21. Inflation, according to this view, will remain high into H2 2023 to “absorb” this excess. The impact of current monetary weakness will be delayed until 2024-25.
The assessment here is that the overhang is much reduced and its removal is consistent with the optimistic inflation projection shown in chart 2 as long as money trends remain as weak as currently, which is likely.
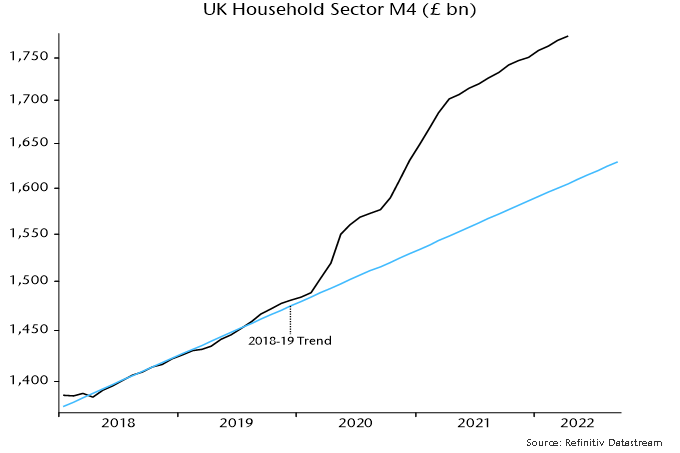
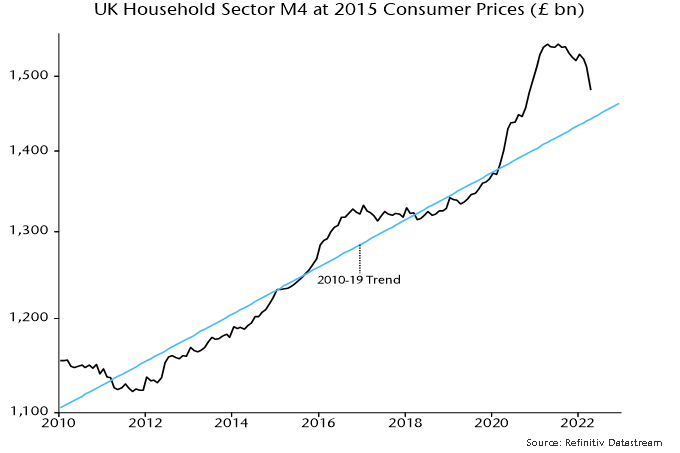
One measure of the monetary overhang is the deviation of the real broad money stock from its 2010-19 trend. This deviation peaked at 16% in May 2021 and has since narrowed to 6% as inflation has overtaken slowing nominal money growth – chart 3.
Chart 3
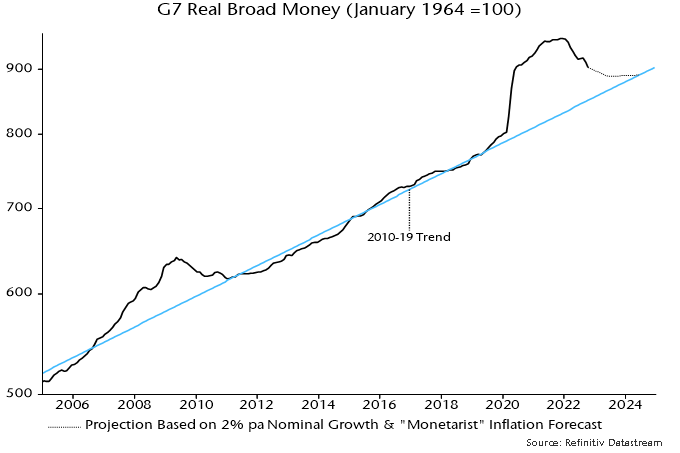
The projection in chart 3 is based on the inflation profile in chart 2 and an assumption that broad money grows by 2% pa. The deviation of the real money stock from trend falls below 2% in H2 2023 and is eliminated by mid-2024.
Is the assumption of 2% money growth realistic? As noted, there has been no expansion in the latest three months.
As the chart shows, there was a larger deviation of real money from trend than currently at the end of the GFC in 2009. The adjustment back to trend was driven by nominal money weakness rather than high inflation – the money stock contracted by 1.9% between July 2009 and June 2010.
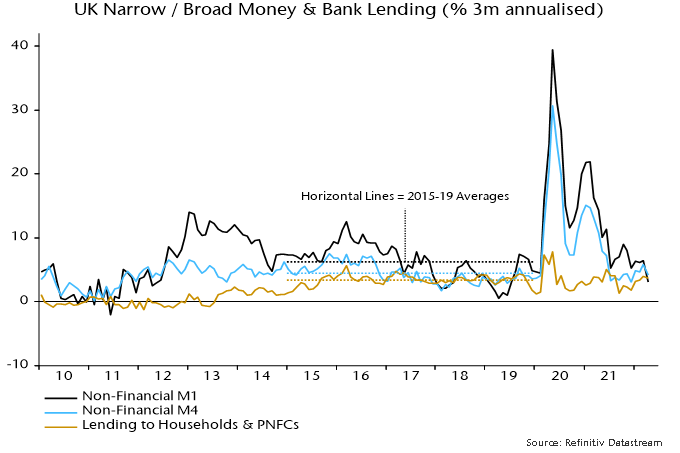
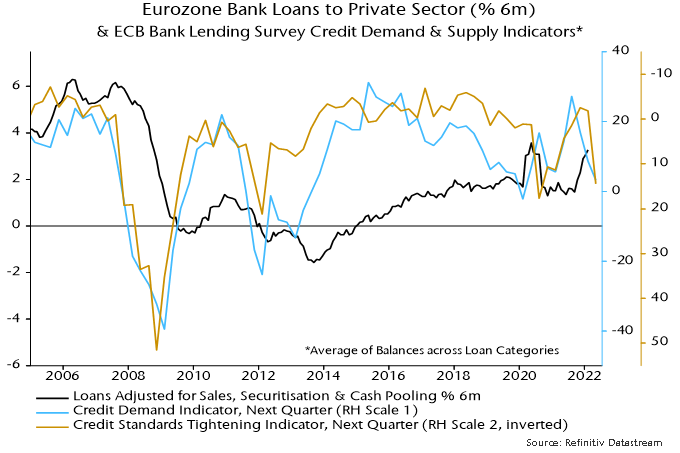
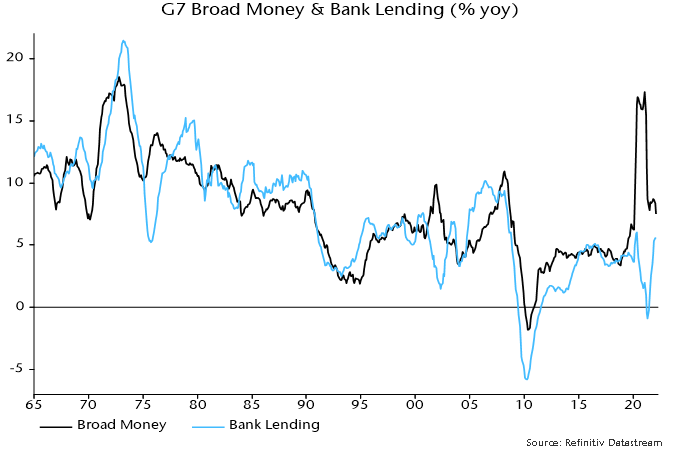
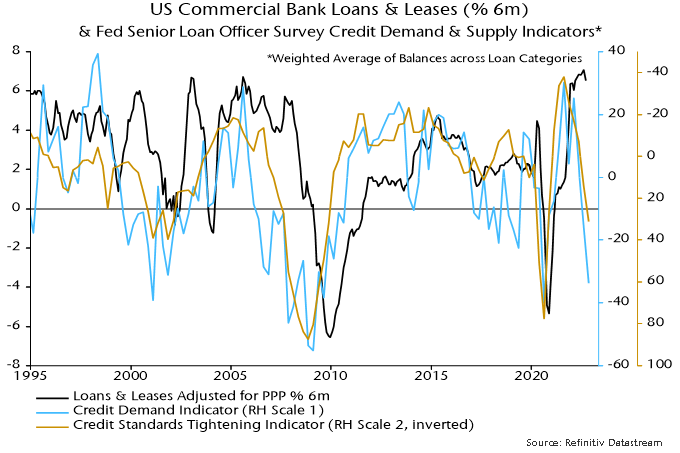
Bank lending has been supporting money growth but central bank loan officer surveys suggest a sharp slowdown ahead: October Fed survey results released this week echo weakness in earlier ECB and BoE surveys – chart 4.
Chart 4
Continued monetary stagnation – or worse – would confirm that G7 central banks, with the honourable exception of the BoJ, have overtightened policies, compounding their 2020-21 policy error.
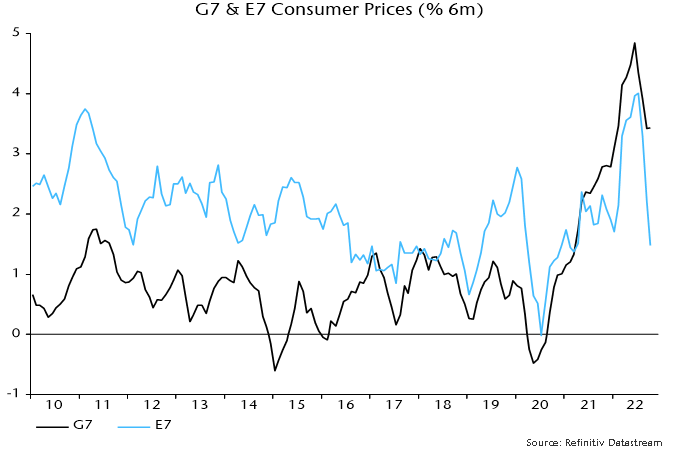
G7 monetary gyrations may be contrasted with relative stability around trend in E7** real broad money – chart 5. E7 central bank eased policies conventionally in 2020 and were quick to reverse course as economies rebounded and / or inflationary pressures emerged. This has been reflected in lower average inflation than in the G7 and a faster turnaround – chart 6.
Chart 5
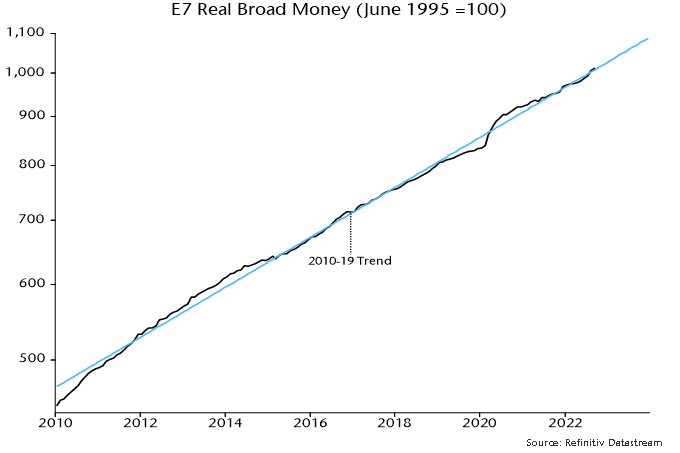
Chart 6
*Money measures used: US M2+ (M2 plus large time deposits and institutional money funds), Japan M3, Eurozone non-financial M3, UK non-financial M4, Canada expanded M2+ (M2+ plus non-personal time deposits).
**E7 defined here as BRIC plus Korea, Mexico and Taiwan.