The term “excess money” describes a monetary backdrop in which growth of the stock of money exceeds the rate necessary to support economic expansion. Excess money is associated with increased demand for financial assets and upward pressure on their prices, other things being equal.
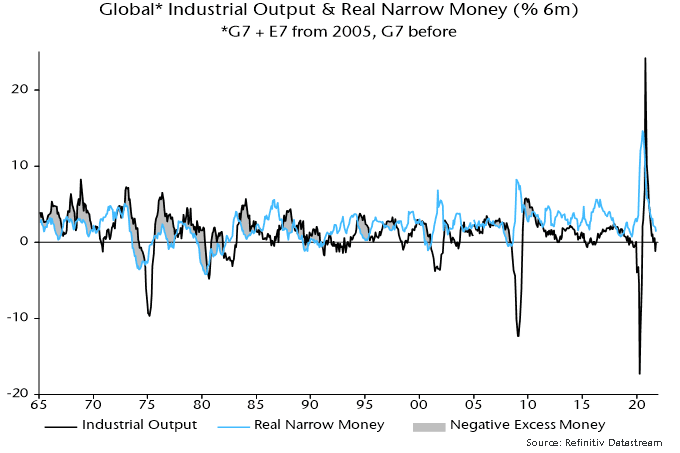
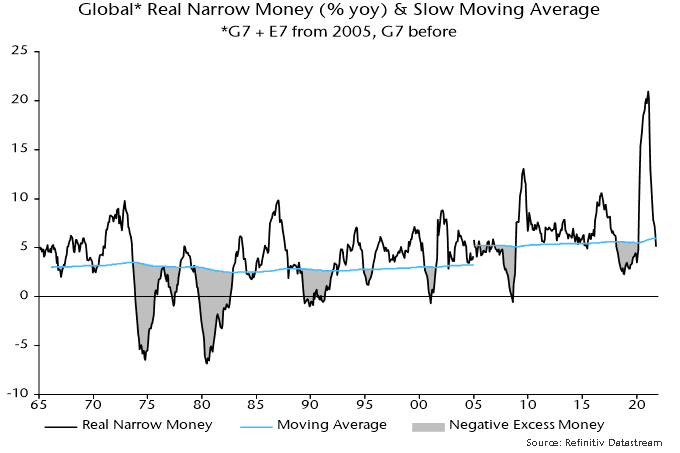
Excess money cannot be measured directly. Two global proxies are followed here: the gap between six-month growth rates of real narrow money and industrial output; and the deviation of 12-month real narrow money growth from a slow moving average.
These measures have been strongly correlated with equity market performance historically. Between 1970 and 2020, global equities outperformed US dollar cash by 17.9% pa on average when the two measures were positive (allowing for reporting lags). They underperformed by an average 3.6% pa when one of the measures was negative and by 9.2% when both were.
The first measure remains positive despite a large fall in six-month real narrow money growth because of offsetting weakness in industrial output – see chart 1. Output growth has been held back by supply constraints and is likely to bounce back temporarily as these ease.
Chart 1
12-month real narrow money growth is estimated to have fallen below the slow moving average in October, turning the second measure negative – chart 2.
Chart 2
The long-term performance of equities / cash switching rules based on the individual measures has been similar. The second measure, however, has outperformed in the recent past – the associated rule recommended cash at the start of 2020, switched to equities in April and now suggests a move back into cash.
The rule associated with the first measure recommended equities in 2020 but switched to cash for several months in early 2021, reflecting a spike rebound in industrial output growth. Equities continued to climb during this period.
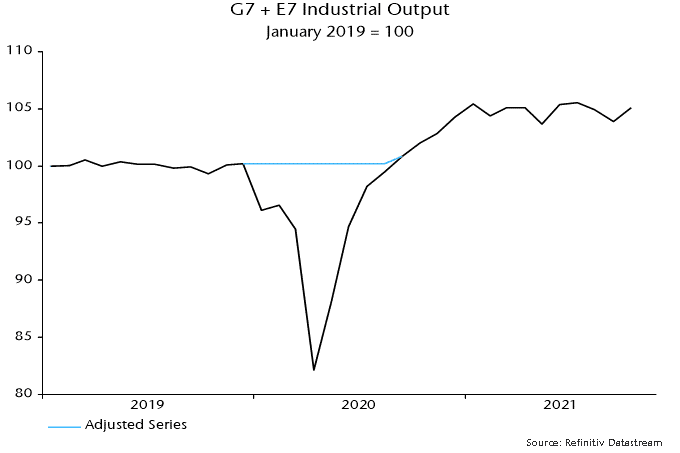
The lesson from this experience is that output volatility due to temporary non-cyclical factors – in this case the covid shock – should be discounted when using this measure. For example, the V-shaped fall and rebound in global industrial output during 2020 could (should) have been removed from the measure by using the alternative series shown in chart 3. An excess money measure incorporating the adjusted series indicated that the monetary backdrop remained favourable in early 2021.
Chart 3
These are the views of the author at the time of publication and may differ from the views of other individuals/teams at Janus Henderson Investors. Any securities, funds, sectors and indices mentioned within this article do not constitute or form part of any offer or solicitation to buy or sell them.
Past performance does not predict future returns. The value of an investment and the income from it can fall as well as rise and you may not get back the amount originally invested.
The information in this article does not qualify as an investment recommendation.
Marketing Communication.
Bank of England Governor Andrew Bailey is under fire for miscommunication in the run-up to this week’s MPC meeting. A much bigger error was the Committee’s decision a year ago to boost QE by a further £150 billion at a time when annual broad money growth – as measured by non-financial M4 – was running at 11.7%.
The extra QE contributed to annual money growth rising further to a peak of 16.1% in February 2021, with the additional monetary excess to be reflected in a higher inflation peak in 2022 and a slower subsequent decline than would otherwise have occurred.
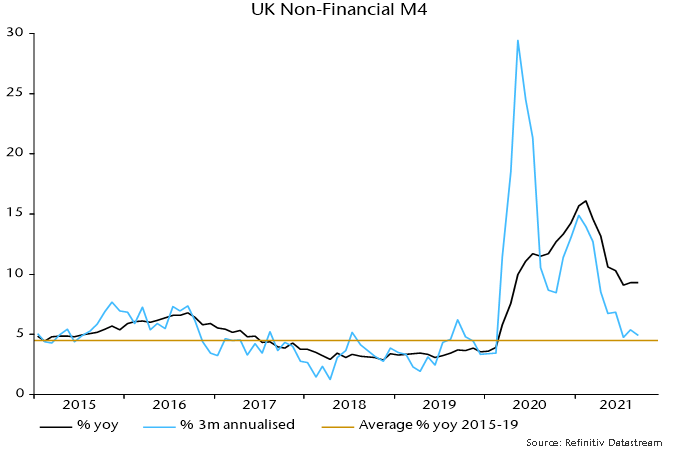
So should the MPC have hiked this week? Annual non-financial M4 growth was still 9.3% in September but the three-month pace of expansion has moderated to an annualised 4.9%, not far above a 2015-19 average of 4.5% – see chart 1.
Chart 1
The view here has been that the MPC should move rates back to 0.5-0.75% to reinforce the recent monetary slowdown and then wait for guidance from the numbers. Sustained sub-5% expansion would be consistent with (core) inflation returning to target, though probably not before H2 2023.
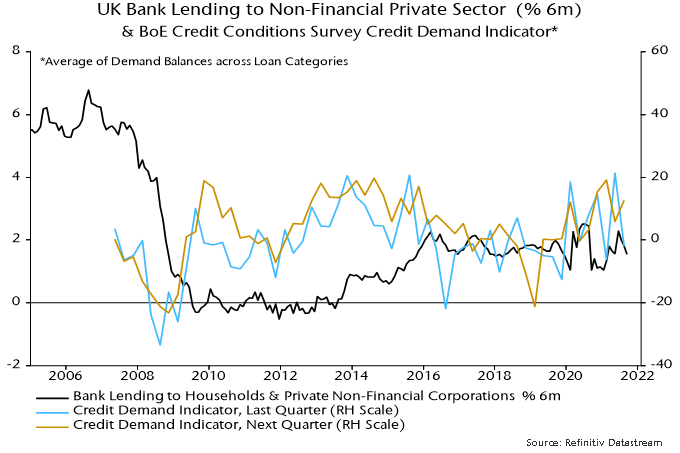
Higher rates would be needed in the event of a credit-driven rebound in money growth. Bank lending expansion has weakened recently, partly reflecting the ending of the stamp duty holiday, but expected loan demand balances mostly improved in the latest Bank of England credit conditions survey – chart 2.
Chart 2
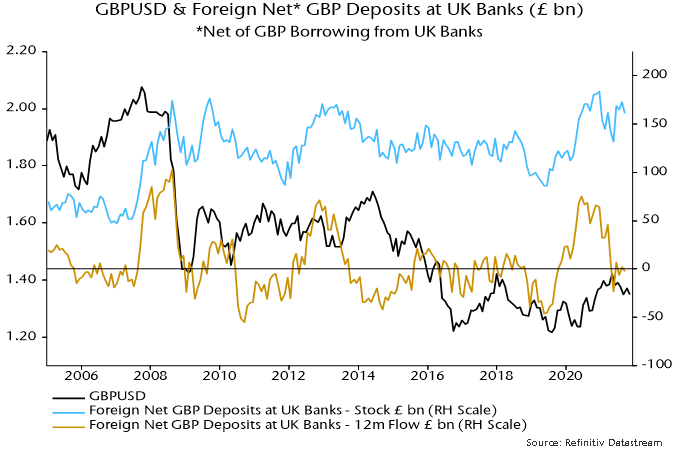
The MPC’s miscommunication / delay risks triggering a fall in sterling, which would magnify near-term inflation difficulties. The exchange rate appears to have been boosted in 2019-20 by overseas investors increasing their net sterling deposits at UK banks – chart 3. These inflows stopped in 2021 but a large stock position could be liquidated if investors lose faith in UK policy-making.
Chart 3
While the focus of inflation is typically centered on rising raw material costs and wage increases, we are seeing transportation costs become an additional and significant part of the inflation problem, and one that is not as easily passed on to consumers.
Transportation affects every aspect of a company’s supply chain and the rising costs are unavoidable. Further, it has been a recent topic of conversation for our own holdings, as well as some of the largest companies in the world. At a recent conference, Molson Coors, the fifth largest brewer in the world, said transportation costs are the main contributing factor to inflation, while Proctor and Gamble warned that an announced price increase will not be enough to offset higher commodity and transportation costs due to not only the size, but the speed of the increases. Multinational conglomerate 3M is a good barometer, as it is seeing “a lot of pressure on logistics costs.” Dollar Tree is one of the largest retail importers in the United States (US) and at their recent quarterly earnings presentation, they spent a considerable amount of time discussing the global supply chain and higher freight costs, saying they were “not counting on material improvements in 2022, especially in the first portion of the year.”
The recovery from the pandemic has seen a huge increase in demand, but with continued quarantine controls, distancing measures at ports and labour shortages are causing severe backlogs. The Suez Canal blockage and summer typhoons off the Chinese coast did little to ease the problem. Another consideration is the consolidation of ocean shipping lines’ key shipping routes being dominated by a handful of companies, causing fewer vessels in general to be travelling between ports.
The ocean carriers have responded to the high demand by increasing container capacity by 22%, but this does not solve the problem of logjams and the waiting lines reaching record levels at some of the ports.[1]The order book for container ships has doubled in 2021, but the majority won’t be delivered until 2023.
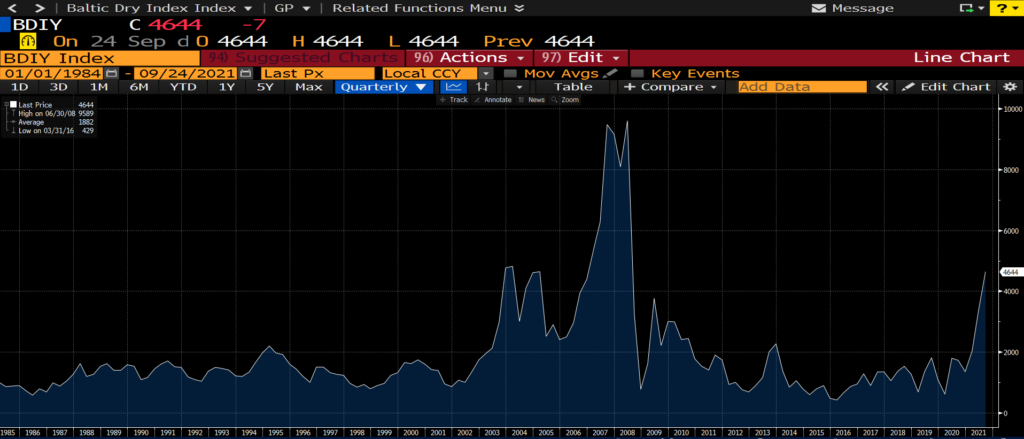
So what does all this mean? Container rates seem to be stabilizing, yet remain extremely elevated. Freightos, a digital booking platform for international shipping, published containerized freight rates. The cost of a container from Asia to the US East Coast is over $20,000, an increase of 415% compared to last year. Shipping from Asia to the US West Coast is slightly less, but the cost is up 452% in comparison to a year ago. Shipping from Asia to North Europe has seen the largest year-over-year increase, up 714% to $13,855. Freight rates from Northern Europe to the US East Coast have been the least affected, up “only” 238% from the period last year to $5,929. In view of these rates, shipping companies are focusing on the most profitable trade routes, meaning reduced volumes crossing the Atlantic. The Baltic Dry Index is a benchmark for the price of shipping major raw materials by sea and is at its highest level since before the Great Financial Crisis.
Source: Bloomberg
The majority of companies are struggling to solve this logistical headache, but our portfolios contain two names that have been natural beneficiaries.
Clipper Logistics (CLG.LN) is a leading provider of value-added logistics solutions, e-fulfilment, and returns management services to the retail sector, primarily in the United Kingdom (UK), but with an expanding presence in Europe. Sales are comprised of the following: 60% of sales come from e-fulfilment and returns management, supporting the online activities of customers; 28% of sales come from non e-fulfilment businesses, supporting traditional brick and mortar customers; and the remaining 12% of sales comes from commercial vehicles sales. Of the logistics related revenues, 85% comes from the UK. Over 90% of Clipper’s contracts are on an open book basis (i.e. cost plus), or hybrid contract, protecting them from increasing costs. However, they are not immune to labour shortages, as they recently flagged the impact that a shortage of HGV drivers is having.
Kerry Logistics (636.HK) is a third-party logistics service provider based in Hong Kong with global exposure. The company provides many supply chain solutions, including integrated logistics, international freight forwarding (air, ocean, road, rail, and multimodal), industrial project logistics, cross-border e-commerce, last-mile fulfilment, and infrastructure investment. Revenue mainly comes from Asia-Pacific, which accounts for 74% of sales (Mainland China 32%, Hong Kong 13%, Taiwan 7%, and other Asia 21%). The Americas accounts for 16% and Europe about 10%. Their customers are mainly big multinational companies, across many industries, including fashion, electronics, food and beverages, FMCG, industrial, automotive, and pharmaceutical.
Perhaps the best advice we could give readers is that with supply chain and transportation issues showing little signs of abating, you would be wise to start your holiday shopping sooner, rather than later.
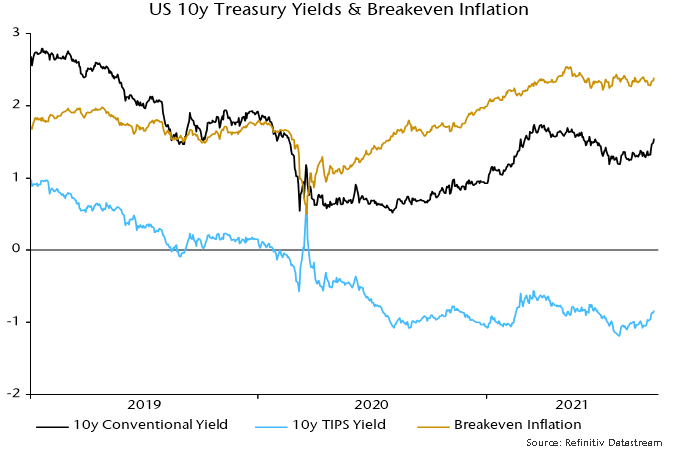
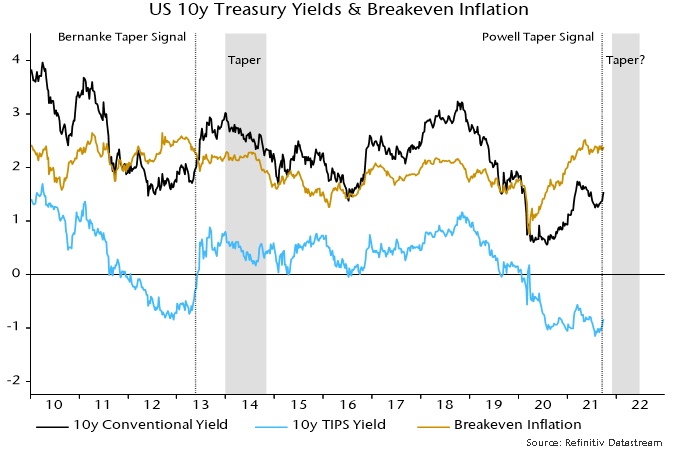
US Treasury yields have risen sharply since Fed Chair Powell’s signal last week of a likely tapering decision at the November or December FOMC meeting. The move higher mainly reflects an increase in real yields, with inflation break-evens range-bound – see chart 1.
Chart 1
The reaction recalls a surge in nominal and real yields when former Chair Bernanke signalled that the Fed was considering tapering in Congressional testimony on 21 May 2013. Inflation breakevens, which had been falling into the announcement, declined further before recovering – chart 2.
Chart 2
Bernanke’s signal was a catalyst for real yields – which had reached negative levels similar to recently – to return to positive territory. The yield surge triggered a short-lived “risk-off” move in markets, focused on emerging markets and credit (the “taper tantrum”).
The market response spooked the Fed, causing the taper decision to be delayed until December 2013. When tapering finally started in January 2014, nominal and real yields embarked on a sustained decline. Inflation breakevens moved sideways but also fell later in 2014.
Cyclical sectors of equity markets outperformed defensive sectors between Bernanke’s May announcement and the start of tapering in January.
The view here, though, is that investors should be cautious about drawing parallels between 2013-14 and now.
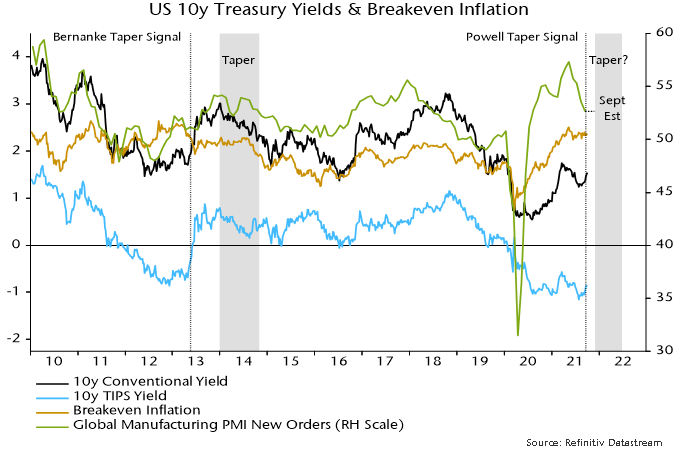
The economic backdrop is a key difference. The global manufacturing PMI new orders index was about to embark on a significant rise as Bernanke gave his taper signal in May 2013 – chart 3. So it is difficult to disentangle the taper effect on yields from the usual correlation with cyclical momentum.
Chart 3
Economic momentum is slowing currently, with money trends suggesting a further PMI decline into early 2022.
This suggests that 1) the yield increase won’t mirror 2013 because the taper announcement effect is offset by a weakening cyclical backdrop, and 2) any rise in real yields could be dangerous for cyclical assets because – in contrast to 2013 – a higher discount rate is unlikely to be balanced by positive economic / earnings news.
An FTarticle lists “Five big questions facing the Bank of England over rising inflation”. The most important one is missing: will broad money growth return to its pre-covid pace?
The current inflation increase, from a “monetarist” perspective, is directly linked to a surge in the broad money stock starting in spring 2020. Annual growth of non-financial M4 – the preferred aggregate here, comprising money holdings of households and private non-financial corporations (PNFCs) – rose from 3.9% in February 2020 to a peak of 16.1% a year later.
The monetarist rule of thumb is that money growth leads inflation with a long and variable lag averaging about two years. This is supported by research on UK post-war data previously reported here – turning points in broad money growth preceded turning points in core inflation by 27 months on average.
The lead time is variable partly because of the influence of exchange rate variations. For example, the disinflationary impact of UK monetary weakness after the GFC was delayed by upward pressure on import prices due to sterling depreciation.
The exchange rate has been relatively stable recently but the rise in inflation has been magnified by pandemic effects, which may mean that a peak occurs earlier than suggested by the February 2021 high in money growth and the average 27 month lag. The working assumption here is that core inflation will peak during H1 2022.
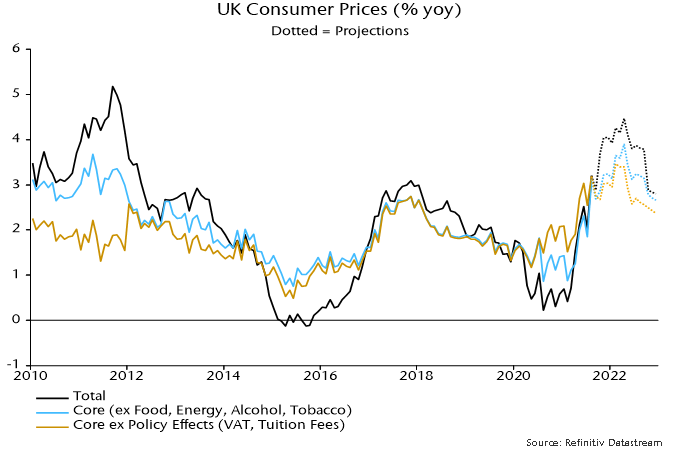
CPI inflation, however, is likely to overshoot the current Bank of England forecast throughout 2022 – chart 1 shows illustrative projections for headline and core rates.
Chart 1
The past mistakes of monetary policy are baked in. The MPC should focus on current monetary trends in assessing how to respond to its current / prospective inflation headache.
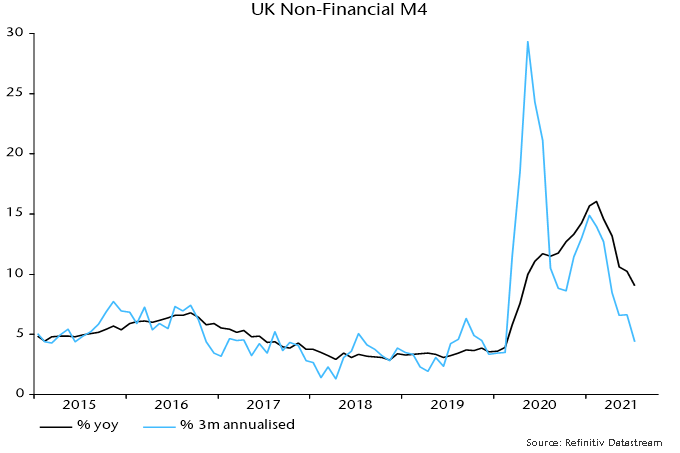
Annual broad money growth has fallen steadily from the February peak but, at 9.0% in July, remains well above the 4.2% average over 2010-19, a period during which CPI inflation averaged 2.2%. So monetary data have yet to support the MPC’s assertion that the inflation overshoot is “transitory”.
The pace of increase, however, slowed to 4.4% at an annualised rate in the three months to July – chart 2. Household M4 rose by 5.8% with PNFC holdings little changed. In terms of the credit counterparts, bank lending to households and PNFCs grew modestly (4.1%) while a continued QE boost was offset by negative external flows, suggesting balance of payments weakness.
Chart 2
With QE scheduled to finish at end-2021 (if not before), and a temporary boost to mortgage lending from the stamp duty holiday over, money growth couldbe gravitating back to its pre-covid pace.
An early interest rate rise, on the view here, is advisable to reinforce the recent monetary slowdown and push back against rising inflation expectations. It is premature, however, to argue that a sustained and significant increase in rates will be needed to return inflation to target beyond 2022 – further monetary evidence is required.
It would be unfortunate if, having fuelled the current inflation rise by questionable policy easing, the MPC were now to raise expectations of multiple rate hikes at a time when monetary growth could be returning to a target-consistent level.
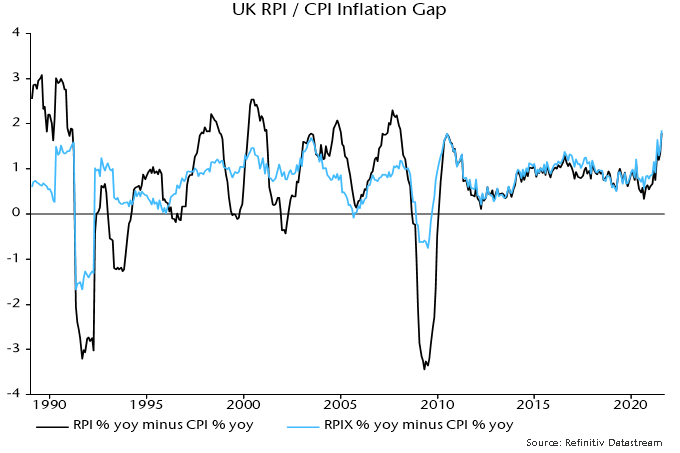
The fall in UK CPI inflation in July reported this week will be of limited comfort to policy-makers – a decline had been expected because of a large base effect and will be more than reversed in August. A bigger story was the further widening of the RPI / CPI inflation gap to an 11-year high. RPI inflation could top 5.5% in Q4 2021, boosting interest payments on index-linked gilts by a whopping £15 billion relative to the OBR’s Budget forecast.
CPI inflation fell from 2.5% in June to 2.0% in July but RPI Inflation eased by only 0.1 pp to 3.8%. RPIX inflation – excluding mortgage interest – was stable at 3.9%.
The RPI / CPI inflation gap, therefore, widened to 1.8 pp, its largest since June 2010. The RPIX / CPI inflation gap of 1.9 pp is the biggest on record since the inception of CPI inflation data in 1989 – see chart 1.
Chart 1
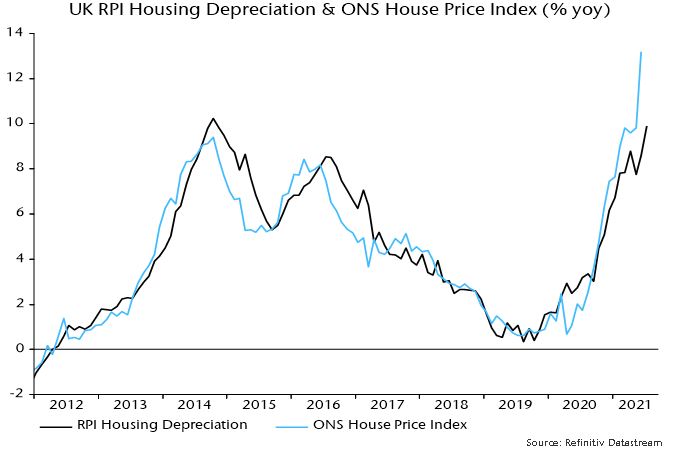
The widening gaps mainly reflect surging house prices, driven partly by Chancellor Sunak’s stamp duty holiday. House prices enter the RPI via the housing depreciation component*, which is linked to ONS house price data with a short lag – chart 2. This component has a 9.0% weight and rose by 9.9% in the year to July, contributing 0.9 pp to RPI inflation of 3.8%. The CPI omits owner-occupier housing costs.
Chart 2
Note that the housing depreciation weight has risen from 5.8% in 2014, i.e. the sensitivity of the RPI to house prices has increased by more than 50% since then.
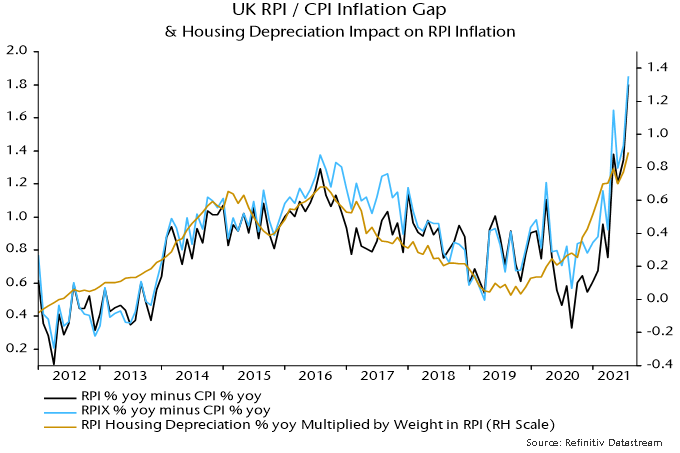
The RPI / CPI and RPIX / CPI inflation gaps, however, have widened by more than implied by house prices alone – chart 3.
Chart 3
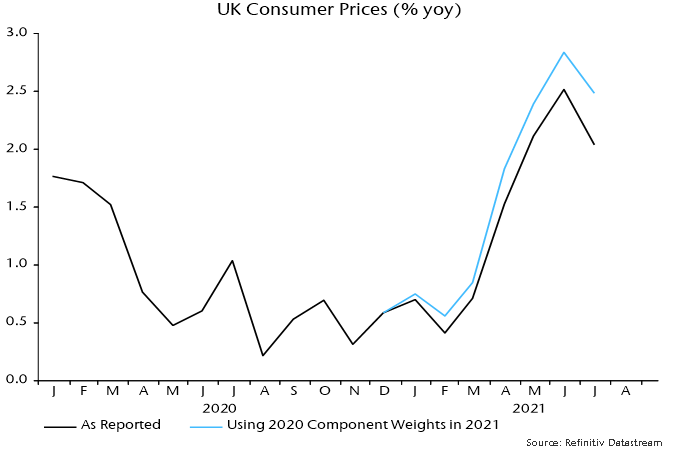
A likely additional influence has been the ONS decision to depart from its normal procedure and base 2021 CPI weights on 2020 rather than 2019 expenditure data. As previously explained, this has lowered the weight of categories hit hardest by the pandemic but now experiencing a rebound in demand and prices. An alternative calculation carrying over 2020 weights (based on 2018 expenditure data) to 2021 produces an annual inflation number for July of 2.5% rather than 2.0% – chart 4.
Chart 4
The RPI has been less affected because the normal procedure was followed of basing weights on expenditure shares in the 12 months to June of the previous year. 2021 weights, therefore, reflect spending in the year to June 2020 – the impact of the pandemic was smaller over this period than in calendar 2020.
So weighting effects are likely to have had a larger negative impact on CPI than RPI inflation.
The phase-out of the stamp duty holiday is being reflected in a slowdown in housing market activity but estate agents expect a shortage of supply to support prices, according to the RICS survey. Recent strength may not yet have fed through fully to the RPI housing depreciation component – the annual rise in the latter of 9.9% in July compares with a 13.2% increase in the ONS house price index in the year to June.
Assume, as a reasonable base case, that that the annual increase in the housing depreciation component moderates to 8.0% in Q4 2021 while other influences on the RPI / CPI inflation gap are stable. This would imply a decline in the gap from the current 1.8 pp to 1.6 pp. The Bank of England’s August forecast of CPI inflation of 4.0% in Q4 would then read across to RPI inflation of 5.6%.
The OBR’s March Economic and fiscal outlook projected a 2.4% rise in the RPI in the year to Q4 2021. According to its debt interest ready reckoner, a 1% rise in the RPI boosts interest costs on index-linked gilts by £4.8 billion in the following year. The suggested Q4 overshoot of 3.2 pp, therefore, implies a spending increase of £15.2 bn – or 0.6% of annual GDP – relative to Budget plans.
*House prices also feed into the mortgage interest component, as well as estate agents’ fees and ground rent.
The economic / market view here remains cautious based on 1) an expected slowdown in global industrial momentum through H2 (already apparent in Chinese data) and 2) recent less favourable “excess” money conditions.
Global six-month real narrow money growth, however, may have bottomed in May / June. A Q3 rebound would signal a stronger economy in H1 2022. An associated improvement in excess money could reenergise the reflation trade in late 2021.
The issue can be framed in cycle terms: does the recent top in the global manufacturing PMI new orders index mark the peak of the stockbuilding cycle (implying a shortened cycle) or will the peak be delayed until H1 2022?
Possible drivers of a real money growth rebound include Chinese policy easing, a slowdown in global consumer price momentum and a pick-up in US / Eurozone bank loan expansion.
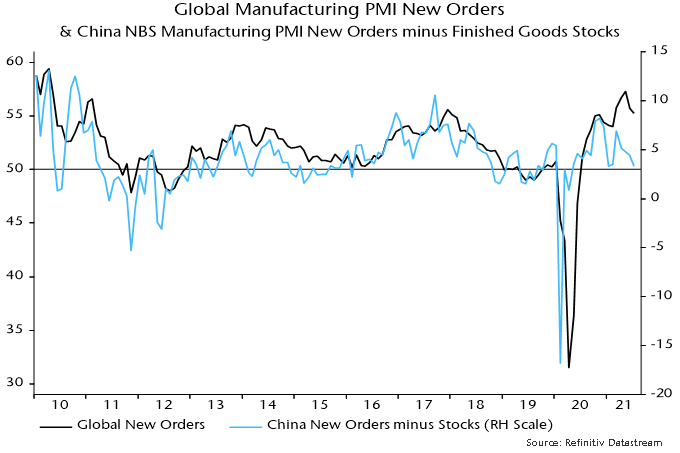
The H2 industrial slowdown view remains on track. The global manufacturing PMI new orders index fell further in July, confirming May as a top. Chinese orders were notably weak and have led the global index since the GFC – see chart 1.
Chart 1
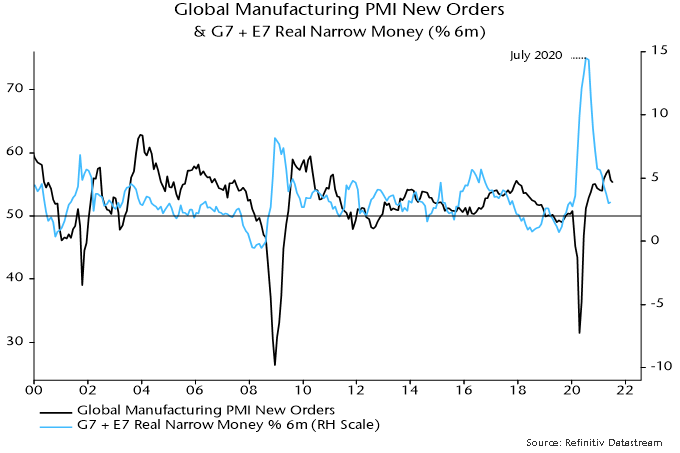
Global six-month real narrow money growth fell steadily between July 2020 and May but a stabilisation in June has been confirmed by additional monetary data released over the last week – chart 2.
Chart 2
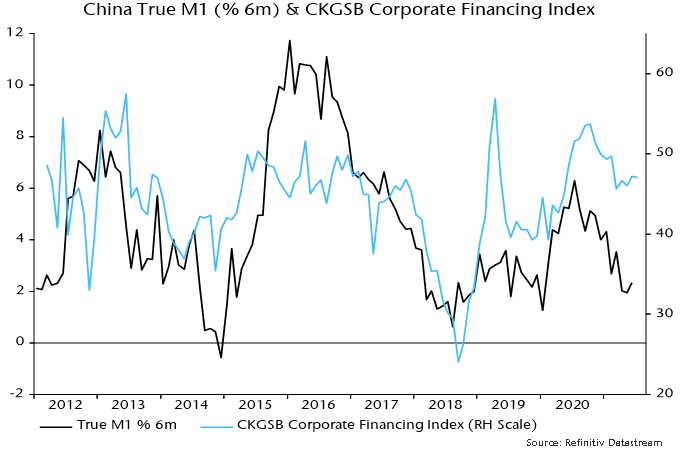
Will PBoC policy easing drive a recovery in Chinese / global money growth? The hope here was that the 15 July cut in reserve requirements would be reflected in an early further fall in money market interest rates and easier credit conditions. Three-month SHIBOR, however, has moved sideways while corporate credit availability is little changed, judging from the July Cheung Kong Graduate School of Business survey – chart 3. July money data, therefore, could show limited improvement.
Chart 3
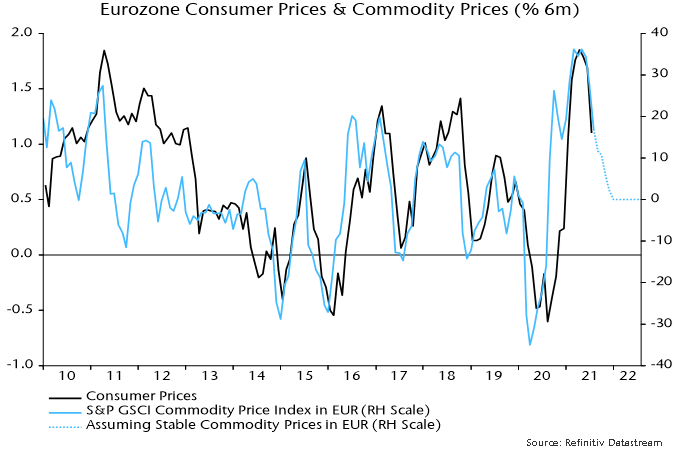
Global six-month real money growth should receive support from a slowdown in consumer price momentum as commodity price and bottleneck effects fade. Eurozone six-month CPI inflation eased on schedule in July, with further moderation suggested and the move lower likely to be mirrored in other countries (Tokyo July numbers also showed a slowdown) – chart 4.
Chart 4
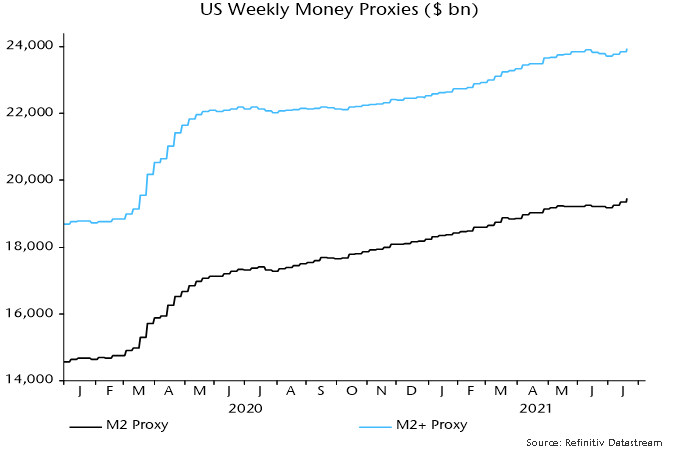
US monetary prospects are foggy. Disbursement of stimulus payments boosted nominal money growth over March-May but there was a sharp slowdown in June. Weekly data indicate a reacceleration in July as the Treasury ran down its cash balance at the Fed to comply with debt ceiling legislation – chart 5. This effect, however, will be temporary and an improving fiscal position suggests a reduced contribution from monetary financing during H2 and into 2022.
Chart 5
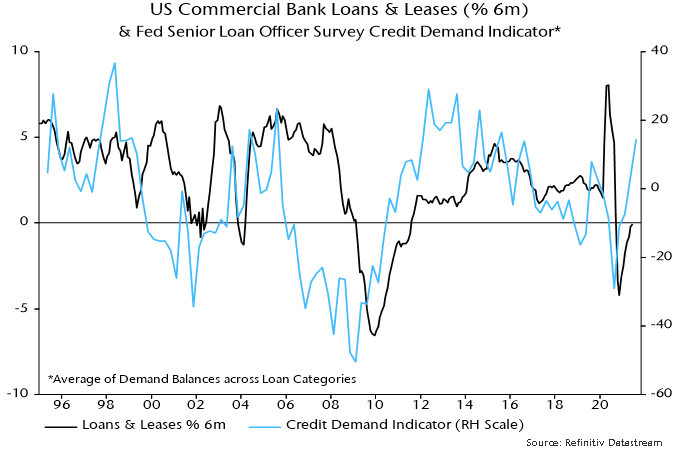
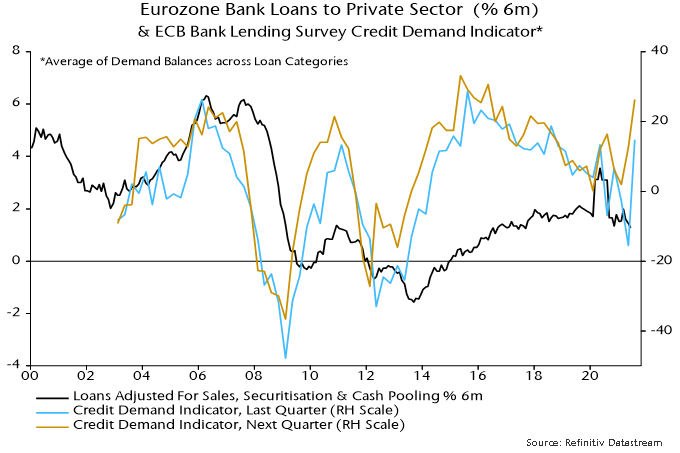
Stable or higher US money growth, therefore, may require a pick-up in bank loan expansion. The Fed’s July senior loan officer survey, released yesterday, is hopeful, showing a further improvement in demand balances across most loan categories (not residential mortgages) – chart 6. The ECB’s July lending survey gave a similar message – chart 7. The survey indicators, however, are directional and the magnitude of a likely loan growth pick-up is uncertain. Actual lending data remained soft through June.
Chart 6
Chart 7
Failure of global real money growth to recover in Q3 – and especially a further slowdown – would suggest that the stockbuilding cycle is already at or close to a peak. The cycle bottomed in Q2 2020 and – based on its average historical length of 3.33 years – might be expected to reach another low in H2 2023, in turn implying a peak no earlier than H1 2022. As previously discussed, however, the current upswing could be short to compensate for a long (4.25 years) prior cycle.
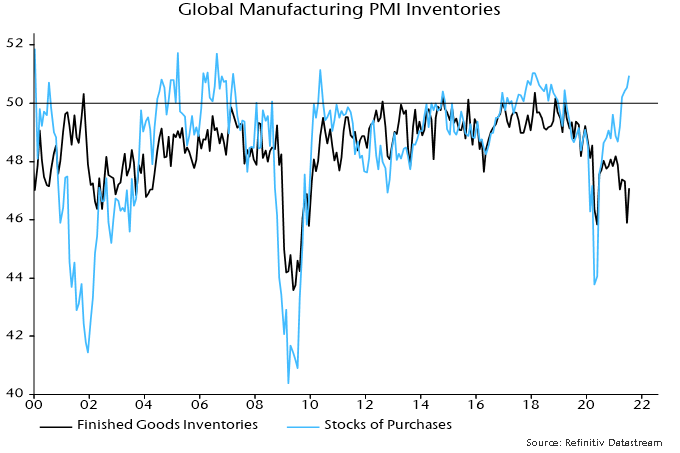
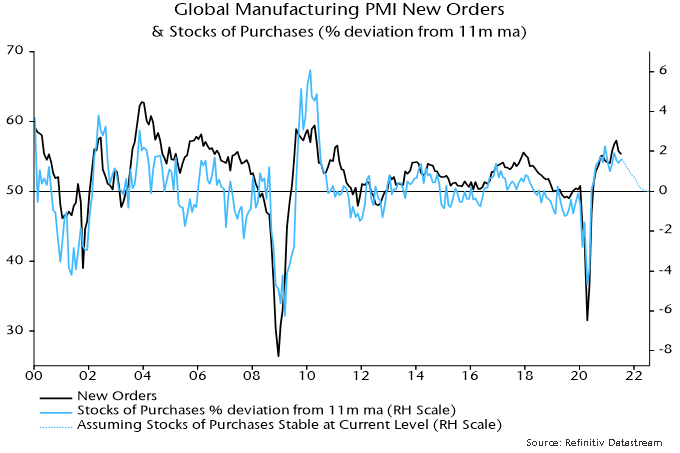
Proponents of the consensus view that replenishment of stocks will underpin solid industrial growth in H2 cite the still-low level of the global manufacturing PMI finished goods inventories index – chart 8. Research conducted here, however, indicates that the stocks of purchases index (i.e. raw materials / intermediate goods) is a better gauge of the stockbuilding cycle and tends to lead the finished goods index. The former index is already at a level consistent with a cycle top and the rate of change relationship with the new orders index is another reason for expecting orders to weaken significantly during H2 – chart 9.
Chart 8
Chart 9
As we write this commentary, the first half of the year is behind us and most stock indices are at all-time highs. Earlier in the year, an inflation scare drove the United States (US) 10-year Treasury yield to 1.74% with a small correction in growth assets like those listed on the Nasdaq. It seems the market has decided to follow the cues of the US Federal Reserve (Fed) that inflation will be transitory, once the effects of the pandemic, the pent-up demand and the disruptions to the supply chain are behind us. Since March 5, equity markets have been roaring back and the 10-year Treasury yield is now range-bound at around 1.5%. Inflation numbers, however, continue to rise.
What do we think at Global Alpha? Unfortunately, we do not have a crystal ball, nor have we reached a consensus amongst ourselves. However, we believe the risk that inflation will be sustainably higher than the target of 2% established the Fed and many central banks is high.
The table below shows the prices of various commodities. Many would argue that 2020 was an outlier. That is why we based our comparison on 2019, which was a normal year with a strong economy. The numbers are self-explanatory. In many cases, prices are at multi-year highs. Copper is now at its highest level since 2011, and reached an all-time record this quarter, as did lumber.
Price of (in US$)
June 28, 2019
June 30, 2020
June 30, 2021
% increase over 2019
Oil (Bbl)
58.47
39.27
73.90
26%
Natural Gas (Mcf)
2.31
1.75
3.65
58%
Gasoline (gallon)
1.77
1.26
2.26
27%
Corn (Bushel)
414
373
585
41%
Pork (lb)
0.87
0.75
1.04
20%
CRB Food Index
348
290
488
40%
Copper (MT)
5993
6015
9335
56%
Aluminium (MT)
1820
1620
2552
40%
Lumber (MBF)
379
436
718
89%
CRB Index
408
360
557
37%
Baltic Freight Sea shipping
1381
1799
3418
247%
Sources: USDA, CRB
The broadest measure of commodity prices, the CRB Index, is at its highest since 2011, when it reached an all-time high. Its component, the CRB Food Index, is also at its highest since 2011, near its record high.
Many observers will brush off commodity price inflation, arguing that it is caused by an imbalance between demand and supply that normally reverts within a few quarters. Although true, the supply response can take a lot longer than expected. Oil and gas companies are under enormous pressure and are not increasing exploration. Political uncertainty in South America may slow the supply growth for copper. The effects of weather events seem to have a more permanent effect on the inflation of agricultural commodities. For now, let’s assume that supply will come back and prices will come down. The example of lumber, which has recently retreated from above $1700/mbf to just over $700 may prove this point. In our opinion, what may drive a more sustainable inflation will be wage increases, which are driven by inflation expectations.
What we are witnessing currently, particularly in North America, is a wage inflation between 5% and 10% for the lowest earners. Inflation expectations are running close to 4%. There is a risk that the situation becomes a self-feeding mechanism, like in the 70s. Another big component of inflation is rent. The median asking rent in the US has increased almost 18% from the end of March 2020 to the end of March 2021, reaching $1,226 per month. It is up 22% since March 2019.[1]
Many have stated that a big reason for the low-inflation of the last twenty years was the emergence of China and its vast labor pool of migrant workers as the factory of the world. In May of this year, China’s producer price index reached 9%, its highest level since the summer of 2008. China will no longer be the deflationary force it has been in the last two decades. Between the aging of its population, its internal needs and increasing trade frictions, we can expect price increases from China.
Inflation numbers will continue to be very high, one might even call them scary for the next twelve months. How the Fed, politicians, unions, consumers and investors will react to these numbers will be important to watch, and our job is to forecast. We are already starting to see some divergence between central banks, like those of Norway, New Zealand and Canada, and even within the ranks of the Fed.
How will the market react to increasing signs that inflation will be more than transitory and that rates will rise?
Past episodes have shown that long-duration assets like long-term bonds and high growth stocks will be most affected. US large caps, particularly technology companies, are selling at important premiums versus other markets. They will be most vulnerable. Europe does not have the same labor inflation pressures. That said, inflation in the region may be more contained.
Smaller companies have generally outperformed in periods of inflation. From January 1979 to July 1983, the Russell 2000 Index outperformed the S&P 500 Index by 77%. During this time, inflation rose to as high as 13% and the economy suffered a double-dip recession in 1980 and 1981-82, before staging an extremely strong recovery in 1983 with growth rates as high as 8.5%.[2]
Our portfolio is well positioned for a strong recovery accompanied by higher inflation. With less debt, a rise in interest rates will have a minimal impact. With a more important exposure to the consumer and industrial sectors, economic growth will translate into earnings growth.
As mentioned in last week’s commentary, our companies have been able to maintain their margin despite rising input costs through a combination of price increases and efficiency gains.
[1] www.census.gov
[2] http://www.cmegroup.com/
Monetary trends continue to suggest a slowdown in global industrial momentum in H2 2021, with a rising probability that weakness will be sustained into H1 2022 – contrary to the prior central view here that near-term cooling would represent a pause in a medium-term economic upswing. Pro-cyclical trends in markets have corrected modestly but reflationary optimism remains elevated, indicating potential for a more significant setback if economic data disappoint. Chinese monetary policy easing is judged key to stabilising global prospects and reenergising the cyclical trade.
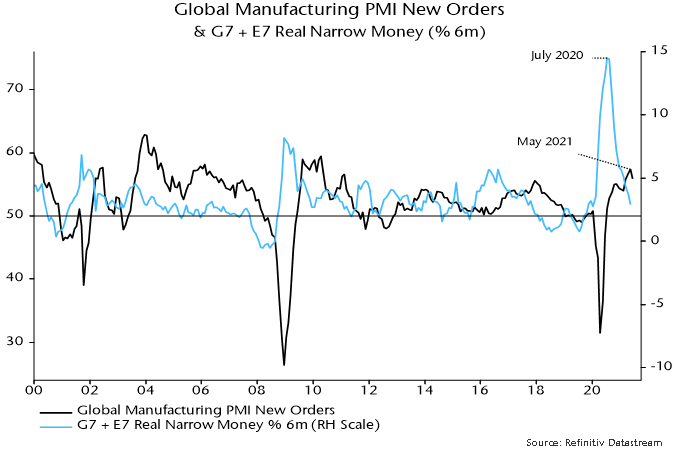
Global six-month real narrow money growth – the “best” monetary leading indicator of the economy – peaked in July 2020 and extended its fall in May, dashing a previous hope here of a Q2 stabilisation / recovery. This measure typically leads turning points in the global manufacturing PMI new orders index by 6-7 months but a PMI peak was delayed on this occasion by a combination of US fiscal stimulus and economic reopening. A June fall in new orders, however, is expected to mark the start of a sustained decline, confirming May as a significant top – see chart 1.
Chart 1
The magnitude of the fall in global real narrow money growth and its current level suggest a move in the manufacturing new orders index at least back to its long-run average of 52.5 during H2 (May peak = 57.3, June = 55.8).
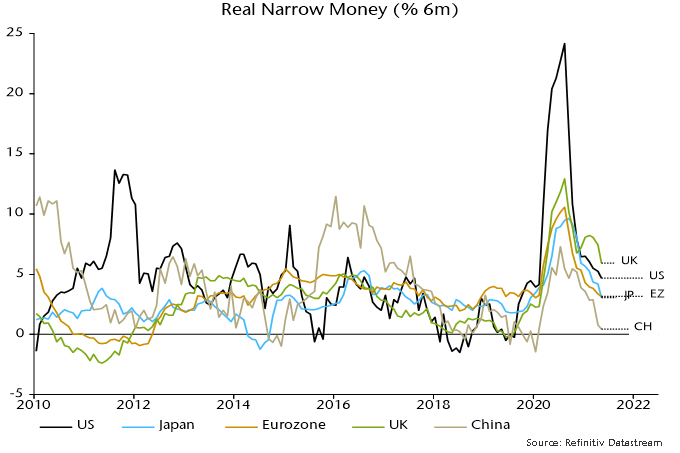
China continues to lead global monetary / economic trends, as it has since the GFC. A strong recovery in activity through 2020 prompted the PBoC to withdraw stimulus in H2, resulting in a money / credit slowdown that has fed through to weaker H1 2021 economic data. The central bank, however, has been reluctant to change course, partly to avoid fuelling house and commodity price speculation, and six-month real narrow money growth has now fallen to a worryingly low level, suggesting rising risk of a “hard landing” in H1 2022 – chart 2.
Chart 2
Real narrow money growth remains above post-GFC averages in other major economies but has also fallen significantly, reflecting both slower nominal expansion and a sharp rise in consumer price inflation. Six-month inflation is likely to fall back during H2 but nominal trends could weaken further in response to higher long-term rates and as money-financed fiscal stimulus moderates.
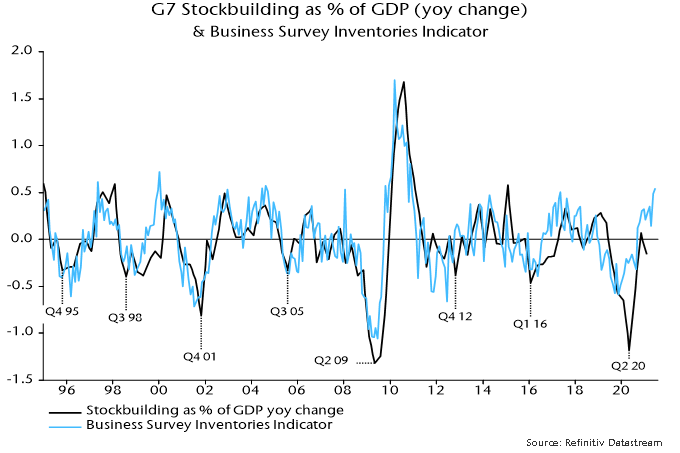
The suggestion from monetary trends of a deeper and more sustained economic slowdown could be argued to be inconsistent with cycle analysis. In particular, the global stockbuilding or inventory cycle bottomed in Q2 2020 (April) and, based on its 40-month average length, might be expected to remain in an upswing through early 2022, at least. This understanding informed the previous view here that a cooling of industrial momentum in mid-2020 would prove temporary.
A reassessment, however, may be warranted to take account of the distorting impact of the covid shock, which stretched the previous cycle to 50 months. A compensating shortening of the current cycle to 30 months would imply a cycle mid-point – and possible peak – in July 2021.
This alternative assessment is supported by a rise in the business survey inventories indicator monitored here to a level consistent with prior cycle peaks – chart 3.
Chart 3
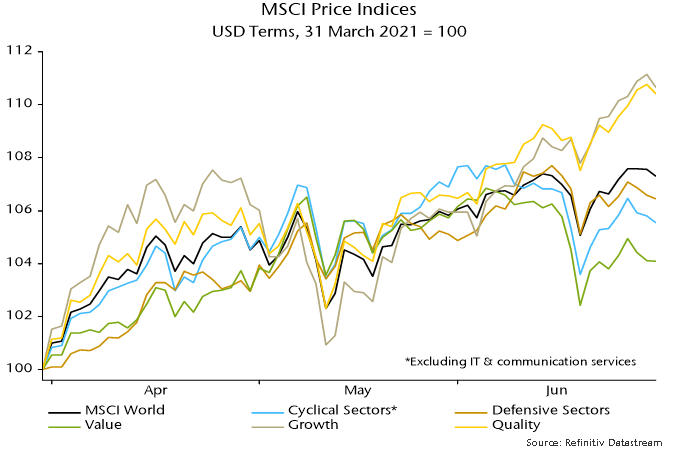
The previous quarterly commentary suggested that cyclical equity market sectors and value were less attractive in the context of an approaching PMI peak, while quality stocks had potential to rally. MSCI World non-tech cyclical sectors lagged defensive sectors during Q2, with quality and growth outperforming value – chart 4. These trends could extend if the slowdown scenario described above plays out. Chinese policy easing would support the cyclical / value trade but the impact could prove temporary unless the Chinese shift resulted in an early rebound in global real narrow money growth.
Chart 4
Counter-arguments to the relatively pessimistic economic view outlined above include the following:
1. Fiscal policy remains highly expansionary and will offset monetary weakness.
Response: Economic growth is related to the change in the fiscal position and deficits, while large, are falling in most countries. Even in the US, President Biden’s stimulus package served mainly to neutralise a potential drag as earlier measures expired. The US fiscal boost peaked with the disbursement of stimulus cheques in March / April.
2. Household saving rates and money balances are high, implying pent-up consumer demand.
Response: Savings rates have been temporarily inflated by government transfers and will normalise as these fall back and consumption recovers to its pre-covid level. High money balances probably reflect “permanent” savings. US households planned to spend only 25% of the most recent round of stimulus checks, according to the New York Fed, using the rest to increase savings and reduce debt. The implied spending boost has already been reflected in retail sales, which may fall back in Q3.
3. Services strength as economies reopen will offset any industrial slowdown.
Response: The services catch-up effect is temporary and momentum is likely to reconnect with manufacturing in H2. Industrial trends dominate economic fluctuations and equity market earnings.
4. Profits are rising strongly, with positive implications for business investment and hiring.
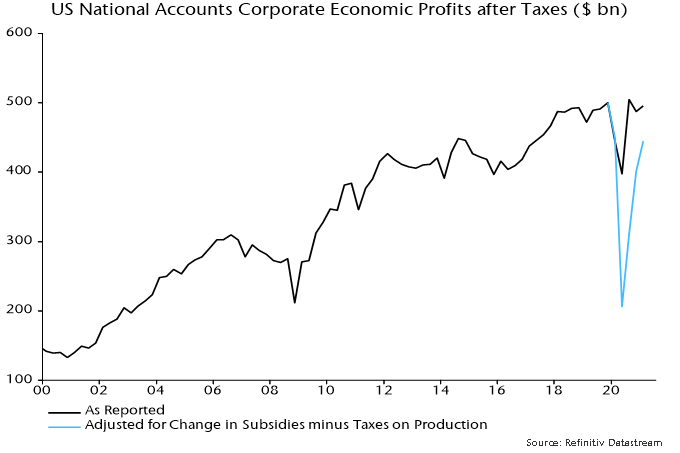
Response: Profits are still receiving substantial support from government subsidies, withdrawal of which will offset much of the additional boost from economic normalisation. An increase in net subsidies relative to their Q4 2019 level accounted for 10% of US post-tax corporate economic profits in Q1, according to national accounts data – see chart 4.
Chart 5
5. Inventories to shipments ratios remain low, implying that the stockbuilding cycle is far from peaking.
Response: Economic growth is related to the change in stockbuilding, not its level. Stockbuilding is highest when inventories are low – the subsequent fall is a drag on growth even though stockbuilding usually remains high until inventories normalise. Low inventories to shipments ratios, therefore, are consistent with a cycle peak.
6. Industry has been held back by supply constraints – output and new orders will surge as these ease.
Response: Supply difficulties have probably resulted in firms placing multiple orders for inputs, inflating PMI readings – this effect will unwind as bottlenecks ease. Historically, manufacturing PMI new orders have fallen, not risen, following a peak in supply constraints.
7. Rising inflation will boost bond yields, supporting cyclical / value outperformance.
Response: Last year’s global money surge was expected here to be reflected in high inflation in 2021-22 but six-month broad money growth has moved back towards its pre-covid average, suggesting that medium-term inflation risks are receding. Bond yields usually track industrial momentum more closely than inflation data so would probably remain capped in a slowdown scenario even if inflation news continues to surprise negatively.
Closeup side view of a mid 50’s couple going grocery shopping during coronavirus pandemic. They are in an empty aisle, wearing face masks and choosing some frozen foods.
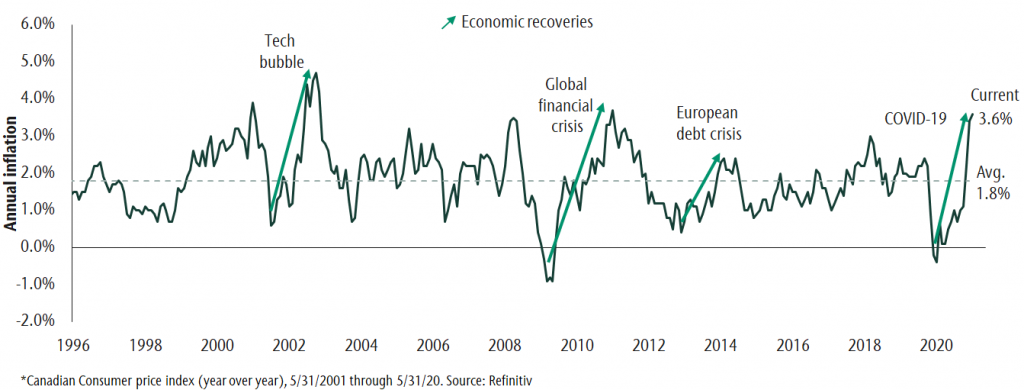
Inflation has moved to its highest level in ten years. Higher prices result from strong economic growth led by pent-up demand for goods and record levels of government spending. At the same time, strong demand is leading to supply shortages. This dynamic is normal and has occurred after every recession. Further, when we look at the components of inflation, we see that recent price increases are largest in industries hurt the most during the pandemic, e.g. energy and travel. These industries are cyclical and are pulling inflation readings higher as prices recover after a period of decline.
We don’t believe investors should be worried about longer-term secular inflation. Higher prices in the short term are expected to be tempered as supply adjusts and demand returns to more normal levels. And while policy actions such as higher spending and larger debt levels have increased short-term inflation, the same forces are deflationary long-term. This is because more money goes to paying down debt as opposed to future investment. The caveat is that higher debt levels encourage policymakers to allow inflation to move higher than it has been in recent cycles. Considering these forces, we believe inflation will be higher but not at the disruptive levels we saw in the 70s and 80s. Our long-term inflation expectation is for a 2.1% increase in prices. This is higher than the last 25 years but still moderate.
While we don’t think inflation will be disruptive in the long term, inflation is higher now and likely to be higher during the coming cycle. Now is a good time to consider the effect of inflation on different asset classes that make up your portfolio. Stocks can generally do well in a period of moderate inflation, whereas fixed income is hurt the most. Alternative asset classes also have some natural protection from inflation. Here follows our inflation perspective on each major asset class:
Equities
Moderate inflation is a double-edged sword for stocks. On the one hand it increases corporate cash flows and on the other it decreases the real value of investment returns. Companies with high valuations tend to underperform as their valuations are based on future earnings growth long into the future. In a period of higher inflation, these future earnings are now worth less today. Companies with lower valuations, companies we call value stocks, do better in a period of above-average inflation. Strategically we think it makes sense to hold both growth and value styles within your equity allocation.
In this environment we also want to own companies that can maintain their profit margins and offer specialized goods or services. These companies are more likely to be able to pass on rising business costs to consumers.
Fixed Income
The bond allocation of a portfolio is the one that is hardest hit by inflation. This is because most bond coupon payments do not increase with inflation. In addition, bond yields tend to rise when inflation is moving higher. The result is both a temporary decline in the price of bonds and lower long-term real return.
The negative effects of rising inflation and yields can be managed by holding short-term bonds and higher coupon bonds. The former are less sensitive to changes in inflation and yields. This protects capital when inflation is rising. The latter have more income to offset price declines. Having a view of the economic backdrop and managing a bond portfolio’s sensitivity to changes in yields and inflation is important to delivering risk-adjusted returns. This is particularly true when inflation is on the rise.
Alternatives
The alternative asset classes in a portfolio are attractive since they generate strong levels of income relative to traditional equities and bonds. They also tend to be the least sensitive to risks in the broader economy, including inflation. Each of our private market investments (real estate, infrastructure and private loans) have natural inflation stabilizers. For real estate, rental income tends to rise with inflation and most of our infrastructure contracts have ongoing inflation adjustments. Finally, the coupon payment on private loans are variable and income rises as yields and inflation move higher.
Hedge strategies are a liquid alternative asset class. They don’t directly hedge against inflation, but when allocating to strategy within a portfolio, we reduce bond exposure which is most negatively affected by inflation.
Planning for different investing environments
A well-diversified portfolio by its nature has many offsets to inflation. As active managers we also make investment decisions to improve portfolio returns or mitigate inflation risk. While it’s been a long time since we have had to worry about inflation, we are positioned for higher but moderate price increases. When reviewing your asset allocation, a key point to keep in mind is that inflation does not affect all portfolios equally. More conservative investors with a larger percentage of their portfolio in fixed income are more susceptible to lower returns as inflation rises. As such, it’s important to review the asset allocation on an ongoing basis to see how trends like inflation may impact the ability of a portfolio to meet your objectives. We have many tools to assess the tradeoffs you face as an investor under different market and economic conditions. While the future is uncertain, we can assist you in making informed decisions that consider risks like inflation, among others.
This post is for information only and is not intended as investment advice. The views expressed are those of the author at the time of publication and are subject to change at any time.