Equity markets have continued to reach new highs despite a backdrop that, on the surface, should be far less supportive. War in the Middle East, elevated oil prices, tighter financial conditions and policy uncertainty have done little to derail risk appetite. There have been periods of volatility along the way, but none have meaningfully disrupted the broader trend higher. Instead, equities have rallied, credit markets have remained firm, and investors have repeatedly looked through shocks that, in prior cycles, may have triggered a more meaningful repricing.
The engines behind the rally
The strength in equity markets is being driven by an alignment of two forces that are both unusually powerful and highly concentrated.
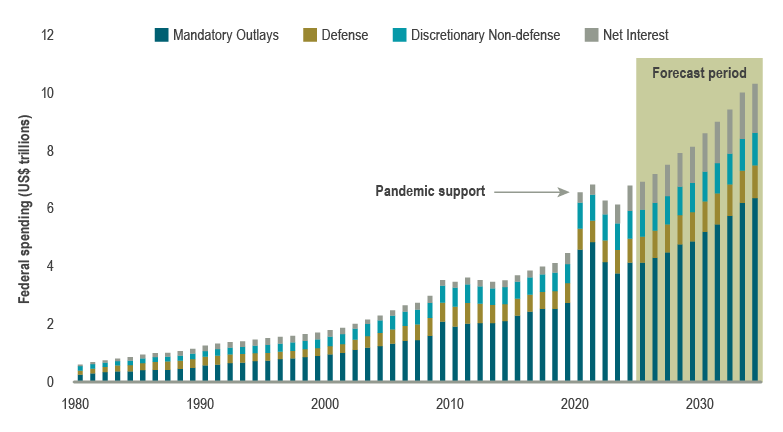
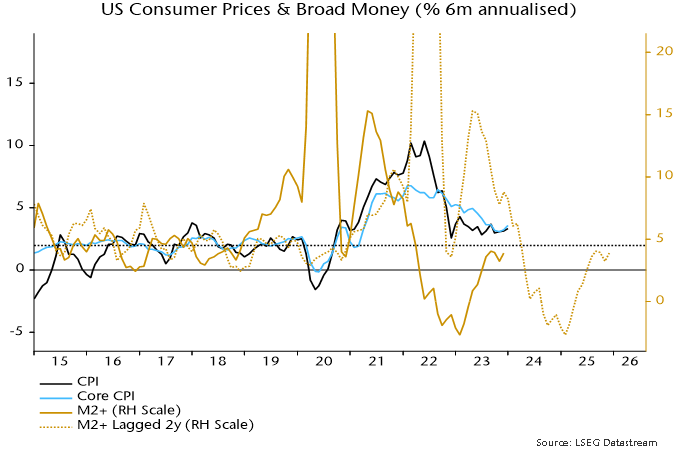
At the centre is the AI-led investment cycle, which stands out not simply due to the scale of the capex cycle (Chart 1), but its structure. Investment is being driven by a small group of hyperscalers committing unprecedented sums to data centres and supporting infrastructure that by some estimates could reach USD$5 trillion over the next five years; increasingly, companies are tapping global credit markets to fund it. Credit markets, notably, are not acting as a constraint. Heavy issuance has been readily absorbed, with strong demand keeping spreads tight even as supply increases. In Canada, Alphabet’s inaugural maple bond issue amounted to a record CAD$8.5 billion and was very well absorbed. In effect, funding conditions are enabling, not limiting, the economic expansion.
Chart 1: US tech investment has surged
 Source: US Bureau of Economic Analysis, Macrobond
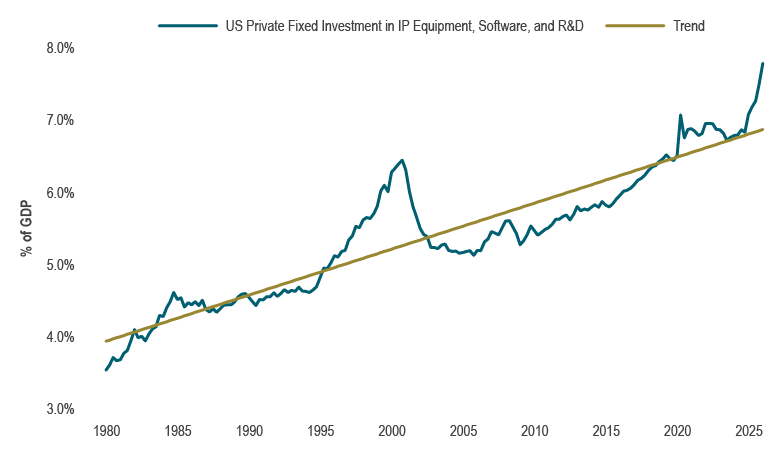
At the same time, corporate earnings have been unequivocally strong. The S&P 500 is on track to deliver approximately 28% year-over-year earnings growth in Q1, the fastest pace since 2021. More importantly, this strength has been broad-based. Ten sectors are reporting earnings growth, with seven sectors posting double-digit gains, spanning technology, financials, industrials and materials (Chart 2).
Chart 2: US earnings growth strong and broad-based
 Source: FactSet. Note: As of May 21, 2026
While earnings are broad, what is driving revisions, sentiment and capital allocation is a relatively small group of AI and AI-adjacent companies. Yet despite the scale of investment, its direct contribution to GDP growth is still limited. What makes the current environment unusual is that the rally is not purely speculative, as earnings are delivering. So long as the combination of broad earnings resilience holds alongside a concentrated growth engine, the path higher can remain intact.
Disappearing downside risks
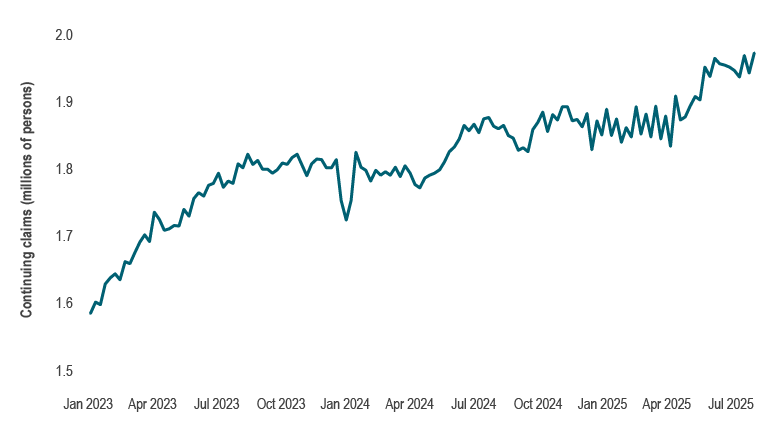
If the engine explains the direction of markets, the persistence of the rally reflects the repeated failure of risks to materialize. Geopolitics is the clearest example, with the disruption in the Strait of Hormuz raising oil prices significantly, but not to levels consistent with the scale of the shock. Meanwhile, other macro risks are also being largely looked through. Labour markets continue to soften, though this appears to be bottoming, leaving employment and income growth still sufficient to sustain consumption.
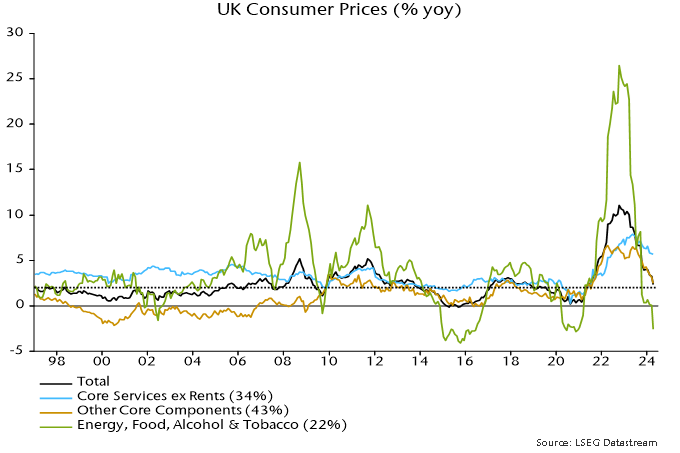
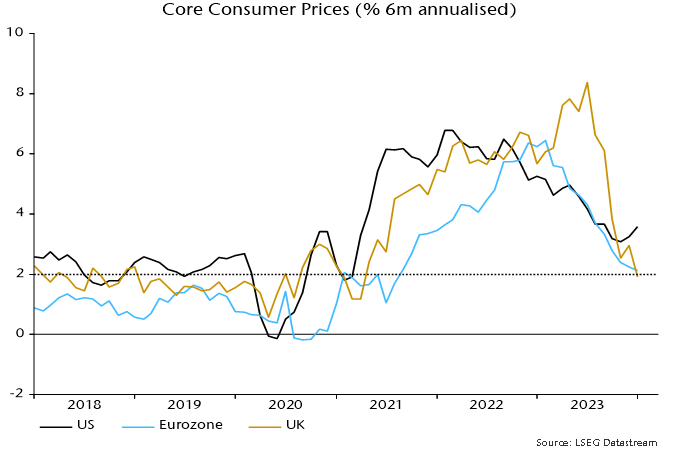
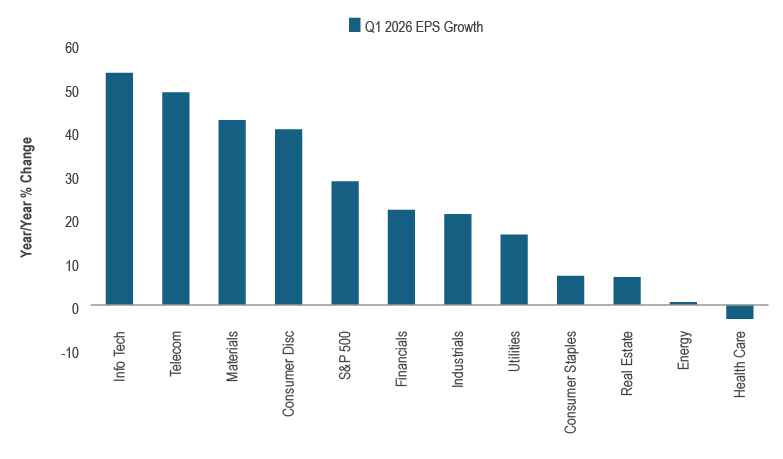
Importantly, inflation has proven persistent. April US producer prices rose sharply, with headline PPI increasing 1.4% month over month, reflecting a surge in energy-related components. Beneath the surface, however, the picture appears benign. Core consumer goods prices in the April CPI report were flat on the month, and core services, while sticky, have not accelerated meaningfully (Chart 3). Additionally, the transmission mechanism appears weaker than in prior cycles – including the post-pandemic period – when rapid wage gains and highly stimulative fiscal and monetary policy reinforced inflation across the economy.
Chart 3: Core services prices relatively contained
 Source: US Bureau of Labor Statistics, Macrobond
Markets are not ignoring risks – they are observing that those risks are not translating into negative earnings or growth outcomes and are adjusting accordingly. With each risk that passes without consequence, markets grow more conditioned to look through shocks. Concern fades faster, and positioning rebuilds more quickly.
What could break this positive risk sentiment?
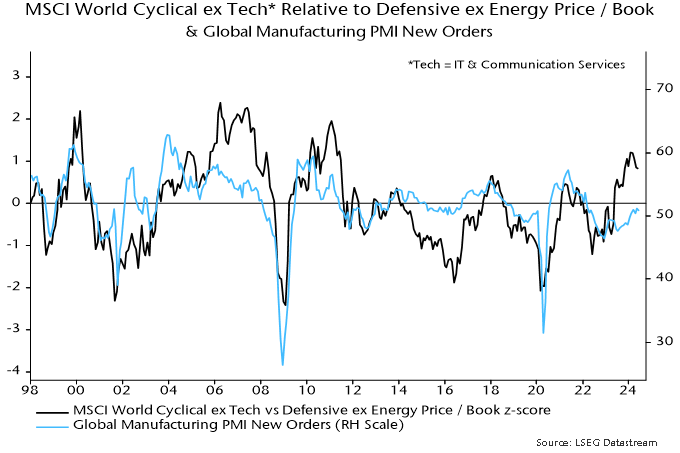
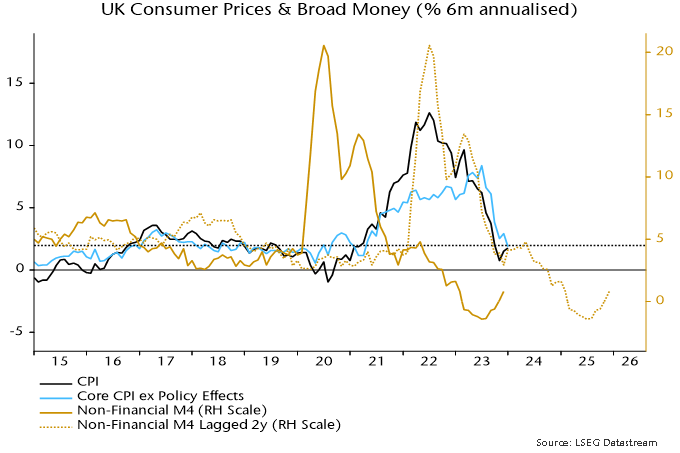
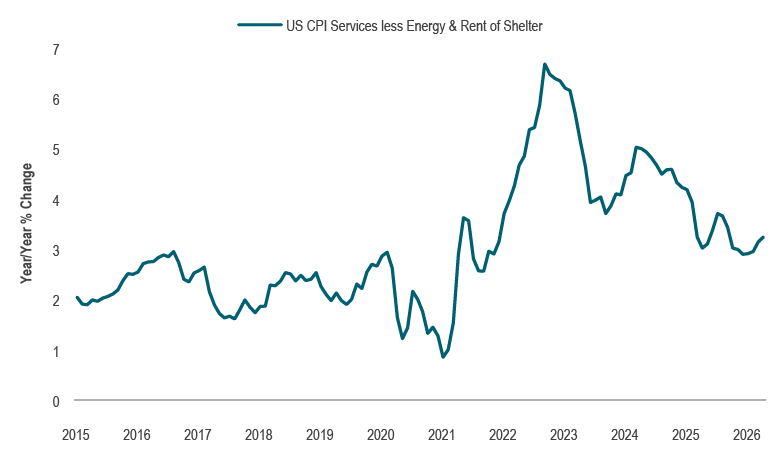
Bond yields have been moving higher, with front-end rates rising sharply and yield curves flattening, a combination typically associated with tightening financial conditions. Since the start of the conflict, US 10-year yields have risen materially, and 30-year yields have breached the psychologically important 5% threshold. Front-end rates have risen even more aggressively, reflecting both inflation pressure and resilient growth. At the same time, risk assets have continued to rally alongside this move, an unusual late-cycle dynamic that is resulting in a system drifting toward ever higher interest rates. Interestingly, the same forces supporting risk assets are also contributing to this tightening. The AI-driven investment cycle is sustaining demand, reinforcing inflation pressures (Chart 4), and keeping policy more restrictive than markets might otherwise expect. In that sense, the optimism driving the rally is also what prevents policy from easing.
Chart 4: Near-term inflation pressures building
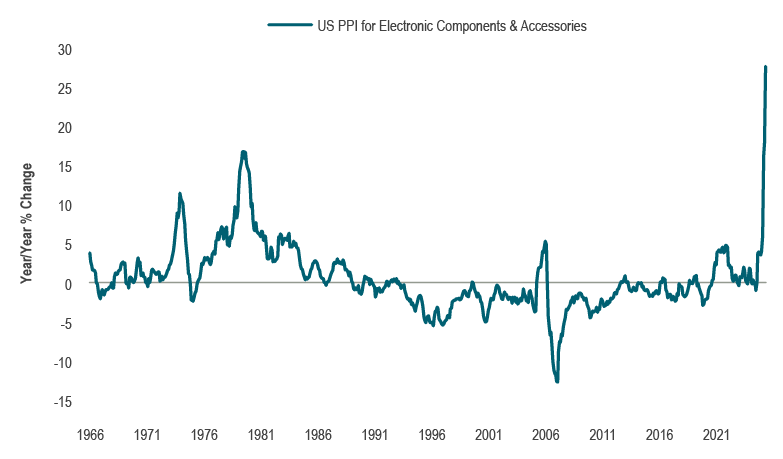 Source: US Bureau of Labor Statistics, Macrobond
This creates a growing tension. Historically, higher discount rates and tighter financial conditions have weighed on equity valuations. Policy adds another layer of uncertainty. Central banks are moving away from an easing bias, with growing inflation risks. They are concerned about allowing inflation expectations to become unhinged from their target levels, should the narrow commodity price shock pass through into a reacceleration of core inflation (although the current assumption is that energy disruptions are temporary and manageable). Additionally, in the US, the transition to a new Federal Reserve Chair introduces another unknown that could reverse the previous regime’s flexibility.
Portfolio strategy
In balanced portfolios, positioning remains modestly underweight equities and fixed income. This stance was implemented at the end of the first quarter as markets entered an “inflation shock first, growth risk later” phase. Recession risks have since moderated, leading equities to now trade near all-time highs, embedding relatively optimistic growth assumptions. As a result, patience and flexibility remain important. We look to add risk opportunistically during periods of market weakness or positioning-driven selloffs. We favour Canadian equities over US equities, with a secular positive view on Canada.
Within fixed income portfolios, the environment remains challenging as strong growth, sticky inflation and higher energy prices continue to put upward pressure on bond yields. Markets have steadily reduced expectations for interest rate cuts and begun to price the possibility of rate hikes in both Canada and the US. This has resulted in yield curve flattening and higher rates. We expect this trend to continue, though not in a linear fashion. Duration exposure will continue to be managed tactically with a bias to be shorter-than-benchmark, with an emphasis on flexibility rather than large directional positions.
Fundamental equity portfolios remain positioned around businesses with resilient earnings. While the broader recovery remains intact, we have paused further increases in cyclical exposure to help mitigate downside risk. We have also reduced exposure to business models most vulnerable to AI-driven disruption, while selectively increasing exposure to sectors positioned to benefit from the broader AI-related capex and infrastructure cycle, including commodity-linked industries.
The current environment continues to favour an opportunistic approach, and we look to add to risk cautiously.