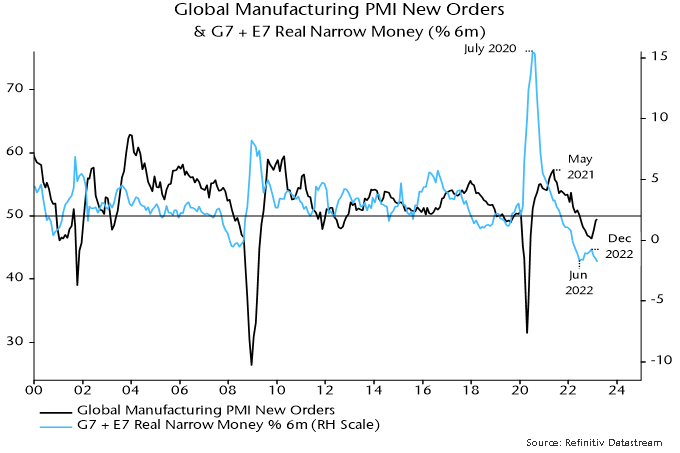
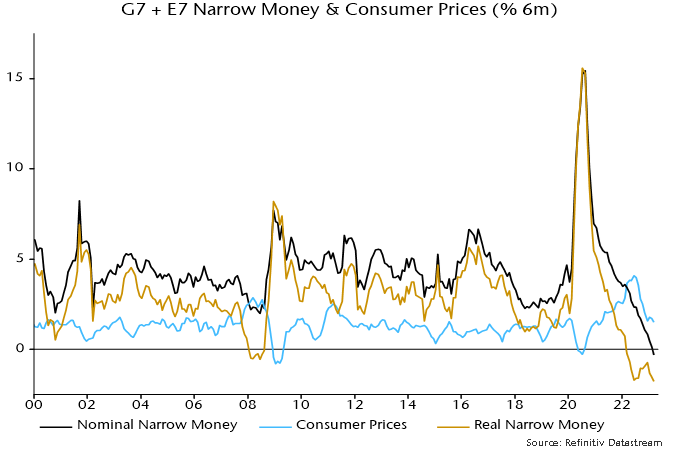
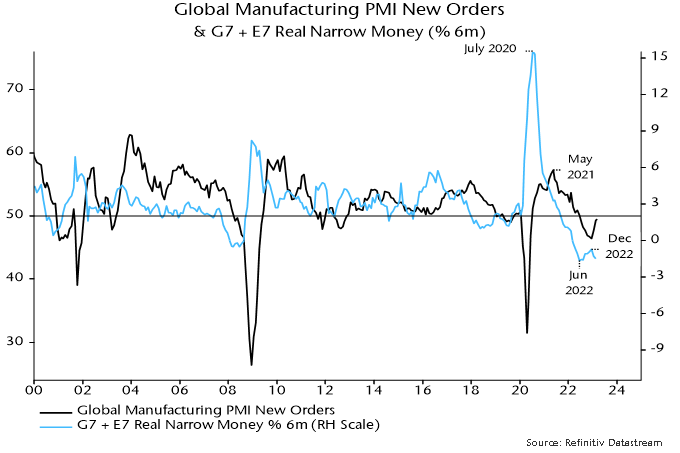
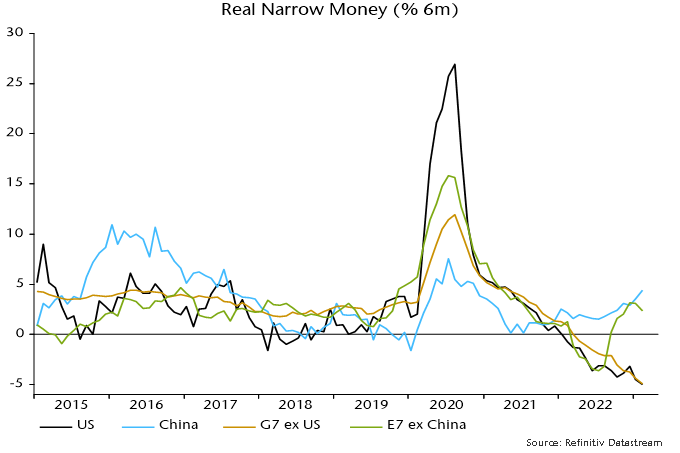
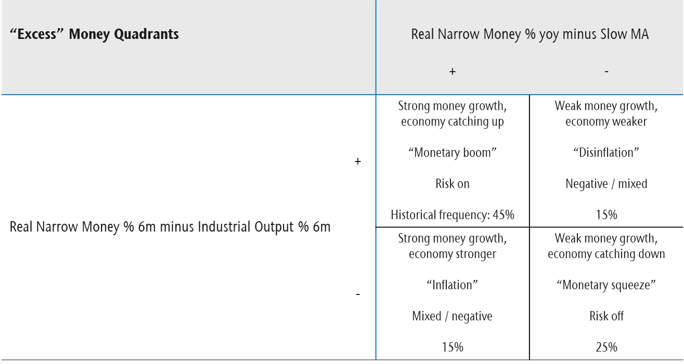
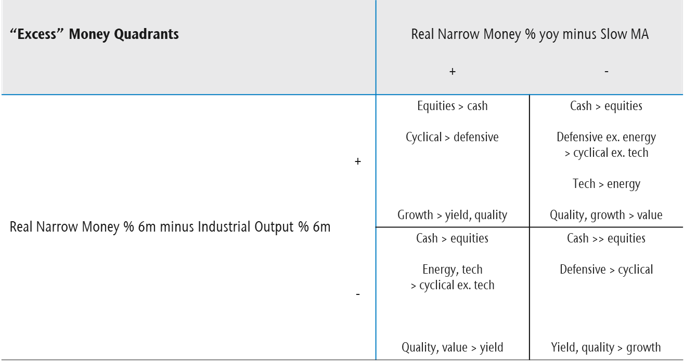
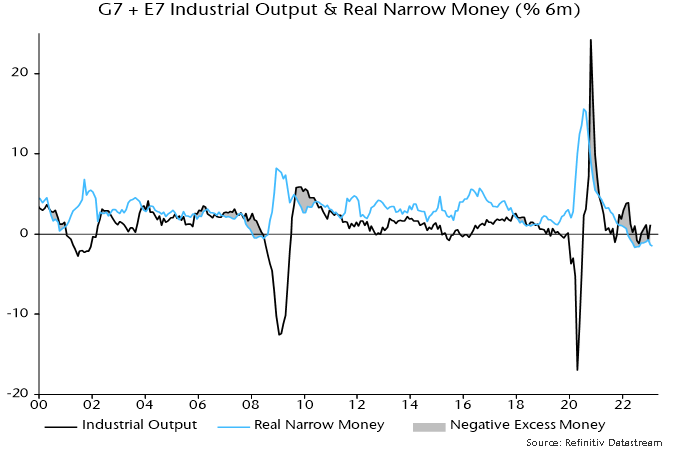
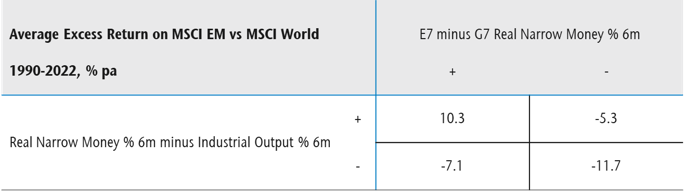
Current monetary stagnation implies that policy-makers’ worries about a sustained inflation overshoot are as misplaced as their deflation panic in 2020 when money growth was surging.

UK annual broad money growth peaked in February 2021. It should be no surprise that annual inflation was still riding high in February 2023, based on the “monetarist” understanding of a roughly two year lead. 

Annual money growth, however, collapsed after February 2021. Non-financial M4 rose by 2.4% in the year to January and by only 0.9% annualised in the latest three months. 

A consensus concern is that a coming inflation decline will fail to return it to target – one informed commentator expects stickiness at about 4%. No explanation is offered of how such a scenario is compatible with barely growing broad money. Is velocity expected to pick up, against its long-term downtrend? Or is 4% inflation projected to coexist with economic contraction of 3% pa – the implication if money growth runs at 1% pa and velocity is stable? 

The collapse in annual money growth closely resembles a decline over 1990-93, following which annual core RPI inflation fell below 2% in H2 1994, consistent with a core CPI rate (unavailable then) of about 1% – see chart 1. 

Chart 1

Chart 1 showing UK Core Consumer / Retail Prices & Broad Money (% yoy)

The push-back to a similar scenario now is that the unemployment rate is much lower than at the start of the 1990-92 recession. Average earnings growth, however, was significantly higher then – the annual increase in total pay was above 10% (three-month moving average) when the recession started versus below 6% now. Private pay momentum is already slowing despite limited labour market cooling to date – chart 2. 

Chart 2

Chart 2 showing UK Average Weekly Regular Earnings (% 6m annualised)

The 1991-1994 inflation plunge, moreover, occurred despite upward pressure on import prices from a 12% drop in the effective exchange rate between 1990 and 1993 (calendar year averages). There is no such currency headwind to an inflation decline now. 

Annual core CPI inflation rose in February but three-month momentum remains well down from its May 2022 peak – chart 3. Commodity prices signal a coming slowdown in food inflation – chart 4 – while energy prices will soon be falling year-on-year. The February inflation result is irrelevant for assessing 2024-25 prospects and the MPC should ignore it. 

Chart 3

Chart 3 showing UK Core Consumer Prices ex Policy Effects* *Ex Energy, Food, Alcohol, Tobacco & Education Adjusted for VAT Changes

Chart 4

Chart 4 showing UK Producer Input Prices of Imported Foods & FAO Food Price Index (% yoy)
Selamat Datang Monument in central Jakarta, Indonesia.

We believe emerging markets (EMs) offer a multitude of benefits to equity investors, including: 

  • High growth potential. EMs typically follow rapid economic growth trajectories, which can be reflected in the performance of companies operating within these markets. 
  • Undervalued quality assets. EMs are home to many high-quality companies not yet recognized by the broader investment community. As these companies grow, they gain awareness and appreciate. 
  • Diversification. Investing in EMs can help diversify portfolios concentrated in more developed markets, enhancing their risk-return profile. 
  • Favourable demographics. Most EMs have young and growing populations that can drive economic growth and provide opportunities for companies catering to these markets. 

Small-cap (SC) companies can often have significantly more room for growth than their larger peers, as they launch new products and expand into new markets, providing substantial upside potential. Also, because they are typically less known outside of their domestic market and inadequately covered by sell-side analysts, they can present “hidden gem” opportunities that the market maybe be overlooking. The EM SC investable universe comprises over 11,000 companies offering a wide variety of investment ideas across 24 countries and 11 sectors. 

For a company to be included on our shortlist, it must be run by an outstanding management team and have a sustainable competitive advantage and defined growth strategy within what we believe is an attractive market. Although we are bottom-up investors, we are also macro aware and acknowledge secular investment themes in the EM middle-class consumer space. Notably, EM countries have nearly four times the middle-income households as their developed market counterparts.  

Indonesia, which we last wrote about in August 2021, is the largest economy in Southeast Asia, the world’s fourth most populous country and home to more than 50 million consumers in the middle-income bracket. Amid gloomy economic projections for many countries globally, Indonesia is expected to experience only a mild slowdown and actually grow 4.8% in 2023. Its economy is supported by strong exports, investment (with foreign direct investment having consistently posted new records every quarter last year) and household spending (being the most significant GDP contributor). Even with the possibility of a global recession and a tight global financial environment threatening Indonesia’s momentum, our view is that companies with sustainable business models, pricing power and appealing product offerings can nevertheless extract meaningful benefits. We believe that one of our Emerging Markets Small Cap portfolio’s core holdings offers the best exposure to Indonesia’s middle-income consumers.

Business overview

Mitra Adiperkasa (MAPI IJ) is Indonesia’s leading multi-format lifestyle retailer catering primarily to middle- and high-income earners. Since its establishment in 1995, the company has managed to build a diversified portfolio of franchise agreements with more than 150 world-class brands (e.g., Zara, Marks & Spencer, Footlocker, Converse, Starbucks, Subway, Krispy Kreme, Tissot, Pandora, Sephora, Samsonite). Mitra Adiperkasa has cultivated long-term relationships with its principals and secures exclusive rights from virtually all brands it partners with. Supported by a veritable army of 23,000 employees, the company runs an omnichannel network of nearly 3,000 physical and 20 online stores. In 2016, Mitra Adiperkasa started its overseas expansion venturing into Vietnam, followed by the Philippines in 2020, and Malaysia and Singapore in 2022.

Competitive advantages

  • Diversified portfolio of exclusive brands and long-term relationships with principals.  
  • Unmatched scale and store network. 
  • Strong reputation and track record of execution. 
  • Focus on target customers with resilient purchasing power. 
  • Solid balance sheet with net cash position. 

Growth strategy

  • Same-store sales growth and store network expansion, with a focus on higher-profit specialty stores. 
  • Addition of new brands and optimization of existing ones. 
  • Expansion in Vietnam, the Philippines and Malaysia. 

A combination of target demographics with more resilient purchasing power, a diverse portfolio of exclusive brands and a robust omnichannel strategy in our view make Mitra Adiperkasa one of the best-positioned consumer companies in the EM SC universe.

Lending by the Fed to depository institutions jumped from $15 billion to $318 billion between 8 and 15 March – see chart 1 (red line). The emergency loans – mostly via the discount window and via the FDIC rather than under the new Bank Term Funding Program – were the main driver of a $441 billion surge in banks’ reserves at the Fed. 

Chart 1 

Chart 1 showing US Federal Reserve Balance Sheet ($ bn)

These developments do not represent an easing of monetary conditions, except relative to a much tighter baseline that would have resulted from the Fed failing to accommodate increased demand for monetary base due to the banking crisis. 

  • Unlike QE, Fed lending to the banking system has no direct impact on money stock measures (i.e. money held by households and non-bank firms). (QE has an impact to the extent that securities are purchased from non-banks.) 
  • Unlike QE, the reserves rise is temporary and will reverse if the crisis abates and lending is repaid. 
  • The emergency / temporary nature of the lending / reserves rise implies no incentive for banks currently experiencing inflows to expand assets. (QE can have secondary monetary effects by encouraging lending / securities purchases.) 

Resolution of the crisis requires the authorities to arrest broad money contraction. A run-down of the Treasury’s cash balance at the Fed won’t be sufficient; QT needs to be suspended / reversed to offset a cutback in lending by troubled banks. Consideration should also be given to limiting the drain of deposits to money funds, e.g. by capping their access to Fed’s overnight reverse repo facility.

L.F. Wade International Airport

Connor, Clark & Lunn Infrastructure (CC&L Infrastructure) today announced the acquisition of a 49.9% minority interest in Bermuda Skyport Corporation Limited (Skyport) from Aecon Group Inc. (Aecon), the concessionaire for the L.F. Wade International Airport (the Bermuda International Airport). Aecon is a leading Canadian construction and infrastructure development company, which will continue as majority owner and operator of the airport. The purchase price for the acquired interest is USD$128.5 million, and the transaction remains subject to a number of closing conditions which the parties expect will be satisfied in the coming weeks.

The Bermuda International Airport provides sole aviation access to the island for both international travelers and Bermudians alike. This modern, world class airport with a new state-of-the-art passenger terminal building is supportive of Bermuda’s growing tourism industry and its status as a global financial center. The facility was constructed with environmentally efficient lighting, cooling, and wastewater systems, and was built to withstand extreme weather conditions common to island nations.

The redevelopment of the Bermuda International Airport was completed in 2020 under a concession agreement between Skyport, a wholly-owned subsidiary of Aecon, and the Bermuda Airport Authority. Skyport is responsible for the operation, maintenance, and commercial functions of the airport and coordinates the overall airport redevelopment project under the concession agreement, which has 24 years remaining on its original 30-year term.

“We are excited to expand to a new sector and geography with the addition of this interest in a world-class airport,” said Matt O’Brien, President of CC&L Infrastructure. “This investment is consistent with our strategy of investing in high-quality, long-duration assets in creditworthy jurisdictions. The L.F. Wade International Airport is an excellent example of a resilient, durable asset with potential for growth as passenger traffic recovers in the wake of COVID-19 – providing an attractive complement to our existing, well-diversified portfolio of infrastructure assets.”

“We believe that Bermuda is a strong jurisdiction for investment and are excited to be partnered with Aecon and the team at Skyport in the delivery of a high-quality airport offering to the people and Government of Bermuda,” added Ryan Lapointe, Managing Director of CC&L Infrastructure. “As a long-term investor, we look forward to working with our partners at Aecon and the Government of Bermuda in the continued successful operation of the Bermuda International Airport for many years to come.”

CIBC Capital Markets is serving as exclusive financial advisor and Torys LLP is serving as legal counsel to CC&L Infrastructure on the transaction.

About Connor, Clark & Lunn Infrastructure

CC&L Infrastructure invests in middle-market infrastructure assets with attractive risk-return characteristics, long lives and the potential to generate stable cash flows. To date, CC&L Infrastructure has accumulated over $5 billion in assets under management diversified across a variety of geographies, sectors, and asset types, with over 90 underlying facilities across over 30 individual investments. CC&L Infrastructure is a part of Connor, Clark & Lunn Financial Group Ltd., a multi-boutique asset management firm whose affiliates collectively manage more than CAD$100 billion in assets. For more information, please visit www.cclinfrastructure.com.

Contact

Vrushabh Kamat
Connor, Clark & Lunn Infrastructure
(437) 928-5184
[email protected]

TORONTO, ON, March 14, 2023 – Crestpoint Real Estate Investments Ltd. (Crestpoint) today announced the acquisition of a new industrial property, Coastal Heights Distribution Centre.

This newly constructed 428,000 square foot facility features best-in-class industrial warehouse characteristics including a clear height of 36 feet, 49 dock doors accessed through a secured loading courtyard, an efficient layout, excellent ingress, and egress provided through four access points, and ample parking. Situated on a 19 acre site in the Campbell Heights industrial area in Surrey, B.C., the property is strategically located near several key highway series and provides easy access to the Canada-U.S. border. The building is 100% leased for 10 years to a Fortune 500 company. Crestpoint acquired a 100% interest in the property on behalf of the Crestpoint Core Plus Real Estate Strategy, its open-end Fund, along with two institutional clients of Crestpoint’s.

The closing of this acquisition brings Crestpoint’s total assets under management to over $9.7 billion and 36.0 million square feet.

About Crestpoint

Crestpoint Real Estate Investments Ltd. is a commercial real estate investment manager dedicated to providing investors with direct access to a diversified portfolio of commercial real estate assets. Crestpoint is part of the Connor, Clark & Lunn Financial Group, a multi-boutique asset management company that provides investment management products and services to institutional and high net-worth clients. With offices across Canada and in Chicago, London, and Gurugram, India, Connor, Clark & Lunn Financial Group, and its affiliates are collectively responsible for the management of approximately $104 billion in assets. For more information, please visit: www.crestpoint.ca.

Contact

Elizabeth Steele  
Director, Client Relations  
Crestpoint Real Estate Investments Ltd.  
(416) 304-8743  
[email protected]

A welder working on steel plates.

Summary

Emerging market equities fell in February (the MSCI EM Index was down 6% in USD terms) as investors took profits in China, and with strong wage, consumption and services data in the U.S. fuelling fears of persistent inflation and risks that the US Federal Reserve would press on with monetary tightening for longer than anticipated. This supported a modest bounce back in the dollar after a sharp decline through Q4 last year, which was an added headwind for EM.

The reopening trade was the catalyst for the biggest rebound for Chinese equities outside of the Global Financial Crisis. Higher beta H-share names were beneficiaries of extreme flows buying into laggards. These stocks were softer through February, with Alibaba and China Education Group leading portfolio detractors.

We wrote last month that A-shares across a number of sectors were attractive given their underperformance relative to H-shares since November. Despite posting slightly negative returns in February, it was pleasing to see A-share names like heavy equipment maker Sany Heavy, industrial automation leader Shanghai Baosight, and Spring Airlines post positive relative performance at the country level.

Investors are now looking to the two sessions in March, namely the National People’s Congress and the Chinese People’s Political Consultative Conference, for major announcements and key government appointments to gauge policy direction. Brazil and Saudi Arabia continued to underperform with South Africa joining them, reflecting our view that poor global liquidity data signals a deteriorating economy that is set to drag on more cyclical markets. Reopening in China will not match the boom we saw in the West as monetary and fiscal policy remains conservative. Weak global demand will also weigh on China’s export markets. Therefore, while we are encouraged by the recovery in China’s economic activity, we are not playing derivatives of the reopening through commodities.

Modi silent on Adani

Last month we flagged that the fallout from allegations of fraud and stock manipulation levelled against the Adani Group would test India’s ascent up the development ladder. Prime Minister Narendra Modi has been the driving force for a number of crucial reform initiatives, including the electrification of poor villages, providing better sanitation in rural areas, the introduction of a bankruptcy code, a nationwide goods and services tax, and establishing digital land records and biometric identification which together underpin a virtuous circle of development. With general elections approaching in 2024, it was hard to see how Modi would lose, particularly given weak and fragmented opposition.

The fallout from Hindenburg’s short report on the Adani Group presents a key test for PM Modi, as his rise, along with that of Adani and India itself are in many ways intertwined. Modi forged his reputation as a pro-business Chief Minister of the Gujarat province in the early 2000s, with rapid economic modernisation and growth propelling rising industrialists such as Adani to the forefront of India’s growth story. As Modi rose to the office of PM, Adani was a key supporter and beneficiary of the government’s nation-building plans, enabling him to build an industrial empire across ports, power plants, resources, renewable energy and airports. India’s opposition parties, who have accused Modi of crony capitalism through helping Adani secure lucrative projects across a host of sectors, have seized on the report as evidence of corruption. Modi on the other hand has kept quiet while his spokespeople characterise the accusations as an attack by elites in Congress and the media on the BJP’s pro-growth agenda. Our view at this early stage is that the risks appear unlikely to be systemic. Hindenburg’s report outlines what looks to be a stock “ramp,” with shell entities buying up stock to lock up free float while hiding this from index providers. Ostensibly meeting liquidity and market-capitalisation requirements enabled index inclusion with a disproportionately large weighting for thinly traded Adani stocks, which was in turn fuel for a massive rally across the Adani Group. While high debt levels are a concern, the collateral tied to many of the loans are high-quality infrastructure assets, with state banks and foreign lenders bearing much of the counterparty risk. Should fallout be contained, the controversy could present a buying opportunity in some of our favoured names while encouraging better corporate governance in India.

Globalisation is not over

While globalisation is clearly changing, we can’t see it reversing. China’s export machine continues to power ahead, while developed countries wisely diversify supply chains to the benefit of other rising export players such as Vietnam, Indonesia and India. Indeed, the combination of incredibly tight labour markets in the West (the U.S. in particular) and extremely cheap real effective exchange rates across a number of emerging markets make these countries incredibly attractive investment destinations in our view. Real effective exchange rates incorporate relative levels of inflation and “trade weights” to account for a country’s largest trading counterparties. As per the following chart, some EMs are more competitive than they have been for a decade or more.

Real Effective Exchange Rate

Chart showing the real effective exchange rate of emerging markets from 2010 to 2022.

Source: Refinitiv Datastream

Chinese EVs are beginning to go global

Leading Chinese electric vehicle (EV) stocks have been sold heavily over the past 12 months, with the pandemic disrupting supply chains and sapping consumer demand. Premium EV manufacturers were hit particularly hard as sentiment soured on reports of missed delivery targets in late 2022, along with a soft outlook for the next quarter or so. Despite the setbacks, the industry’s long-term prospects remain bright. The core investment case revolves around the following factors:

  • EVs are approaching purchase-cost parity with internal combustion vehicles (ICEs); 
  • a long runway for EVs to take share from ICEs;
  • increasing battery density and longer-range;
  • build out of charging infrastructure; and
  • domestic EV players successfully positioning themselves as leading premium brands in China.

What makes this a particularly attractive opportunity is the potential for Chinese EV companies to scale up in a continental-sized market. As this plays out, industry leaders will emerge within China that possess the scale and technology to go global and potentially dominate foreign markets. This is starting to play out now from a low base, with China becoming a net exporter of autos for the first time in 2022, led by EV manufacturers (HSBC Research, February 2023).

Share of NEVs as a % of China passenger vehicle exports

Source: CAAMM, QIANHAI Securities

2022 global EV volume mix

Source: EV-Volumes, HSBC Qianhai Securities

China exported 2.5 million EVs in 2022, up 57% year-on-year. Chinese brands are in the early stages of establishing themselves in foreign markets (particularly in Europe), which are less competitive than China. While a compelling story, investors need to keep expectations in check. It is likely to take years for Chinese EV players to build meaningful traction through increased brand familiarity, localising some production and distribution as well as navigate growing protectionism. If brands like NIO and BYD can manage these risks, they will be set to challenge foreign rivals by drawing on the largest EV production market in China and the strongest battery supply chain globally.

Markets are moving towards the view that the Fed will be forced to suspend or reverse interest rate hikes in response to the SVB crisis but a cessation of QT is a more important requirement for restoring banking system stability. 

QT also caused the 2019 repo rate crisis, which ended only after the Fed restarted securities purchases (Treasury bills) – portrayed, of course, as a “purely technical” measure rather than a return to QE. 

The US weekly broad money proxy calculated here has contracted since April 2022. Weakness initially reflected the US Treasury “overfunding” the federal deficit to rebuild its cash balance at the Fed. QT has been the driver more recently – see chart 1. 

Chart 1

Chart 1 showing US Weekly Broad Money Proxy* (% 26w) & Fed Securities Holdings as % of Broad Money (26w change) *Currency in Circulation + Commercial Bank Deposits + Money Funds

The drain of deposits from commercial banks has been magnified by competition from money market funds, which are able to place overnight funds with the Fed at an interest rate (currently 4.55%) within the Fed’s target range for the Fed funds rate (4.5-4.75%). 

Balances in retail and institutional money funds grew by 5.5% (11.3% at an annualised rate) in the latest 26 weeks, while commercial bank deposits contracted by 2.2% (4.4% annualised) – chart 2. 

Chart 2

Chart 2 showing US Weekly Broad Money Proxy* (% 26w) *Currency in Circulation + Commercial Bank Deposits + Money Funds

In combination, Treasury overfunding, QT and outflows to money funds have resulted in a 30% decline in banks’ reserve balances at the Fed from a peak in December 2021 – chart 3. 

Chart 3

Chart 3 showing US Federal Reserve Balance Sheet ($ bn)

The deposits / reserves drain has caused banks to sell securities and, more recently, restrict loan supply – chart 4. 

Chart 4

Chart 4 showing US Commercial Bank Loans & Securities Holdings (% 6m)

The new Bank Term Funding Program will allow banks to avoid selling securities at a loss but fails to address the system-wide loss of deposits due to QT. The Fed facility, moreover, is more expensive than the deposits it may replace. 

Fortuitously, downward pressure on broad money has recently been relieved by a run-down of the Treasury’s cash balance at the Fed, reflecting the debt ceiling impasse. The decline, indeed, may have been accelerated to inject liquidity into the banking system – the balance fell from $345 bn to $247 bn between Wednesday and Friday last week. 

Such relief, however, is temporary. The authorities’ actions to date may be sufficient to avert another bank collapse but the banking system will remain under pressure, with negative economic implications via rising deposit / lending rates, until QT-driven monetary contraction ends.

Aerial view of hotels on the waterfront in Hollywood, Florida, USA.

With COVID-19 restrictions behind us, our team has been hitting the road, meeting over 300 companies in the past two months at conferences and onsite, from India to Chile, from Florida to Whistler. One of the conferences we attended was the 32nd BMO Global Mining & Critical Minerals Conference that took place in Florida from February 26 to March 1.

The largest conference of its kind, it brings together over 350 companies including all the majors: Rio Tinto, BHP, Vale and Freeport-McMoRan. We met over 30 companies and attended various panels.

New this year was inviting critical minerals companies that explore and produce lithium, cobalt, graphite, and other metals. These will be key on the journey to decarbonization, either via battery-electric vehicles or renewable power.

It is always interesting to attend a mining conference. The optimistic nature of management teams, the promotional aspect of companies trying to raise billions to find metal in a pile of rock in a remote area and then building the mines, roads and infrastructure to bring it to production. There are many interesting characters to say the least.

What were some observations and how does it relate to our commentary this week about the battle against inflation? One main takeaway is that the two megatrends of urbanization and the need to reduce carbon emissions to limit the temperature rise are very much intact. China at 64% is probably two-thirds of the way in terms of people moving to cities. As a comparison, the U.S. is at 83% whereas countries like India are only at 36%.

Share of urban population worldwide in 2022, by Continent

Northern America: 83%.
Latin America and the Caribbean: 81%.
Europe: 75%.
Oceania: 67%.
Worldwide: 57%.
Asia: 52%.
Africa: 44%.
Source: United Nations

Urbanization comes with the need to build new infrastructure as well as replace aging infrastructure, some dating as far back as the 19th Century.

An interesting fact is that since the beginning of the Copper Age around 4500 BC, almost 7,000 years ago, 700 million tons of copper has been mined until today. In the next 25 years alone, the world will need another 700 million tons.

Where will we find it? How much will it cost to bring it into production? We can assume it will be a lot more, in other word, inflationary.

Copper price 1989 to today

Graph showing the dramatic increase of the price of copper from 1989 to 2023.
Source: LME and CRU

This is a long introduction to this week’s commentary. Are the central banks winning the war on inflation?

Earlier this year, market participants thought we had made good progress as we started to see inflation numbers come down from their peaks. We started assuming interest rates had peaked and would even start to decline in the second half of 2023.

Since then, economic data out of the US, Canada, Europe and China has shown:

  • a resilient economy,
  • a confident consumer,
  • strong job creation. And surprise!
  • an increase in inflation from December to January.

US Personal Consumption Expenditure Core Price Index YoY

Graph showing the increase of US Personal consumption expenditure core price index year over year from 2018 to 2023.
Source: Bureau of Economic Analysis

Obviously, bond and stock markets have retraced much of their positive returns.

Where is inflation headed now?

Let’s focus on the US.

Components and weight in CPI calculation (source Bureau of Labor Statistics)

Food and beverages 14.40%
Housing 44.4% of which owner equivalent rent of residence is 25.4%
Apparel 2.50%
Transportation 16.7% of which 8.1% is new and used vehicle
Medical Care 8.10%
Recreation 5.40%
Education and Communication 5.80%
Other good and service 2.80%

In aggregate, commodities including food and beverage is approximately 41% and services is 59% (includes rent).

Graph of US CPI Owner Equivalent Rent YOY

Graph of US CPI owner equivalent rent year over year from 1985 to 2023.
Source: Bureau of Labor Statistics

So, as can be seen from the weight of the various components and the chart above, rent will go a long way in terms of determining the direction of inflation. Although we have recently heard of rent peaking, we are still looking at high single-digit increases on a year-over-year basis. Since this data normally lags about six months, we do not expect a large decrease in this measure to bring down inflation. Furthermore, looking at the graph above, it has mostly been above 3%, except the period following the global financial crisis of 2008.

Last December, we were of the view that inflation would still be above 5% at the end of 2023, a view that was not widely shared. Now in March, the data seems to validate our view.

The Fed needs to continue raising rates. How high will they go?

The market now expects a terminal rate at around 5.5% and many funds are buying options where rates may reach 6%.

We still believe the only way to break inflation expectations — which is what the Fed is focused on — is to see slack in the labour market.

That probably means an unemployment rate above 6% and we are far from that level.

With Delta Airlines announcing this week there will be an increase of 34% for its pilots for the period 2023-2026, we are far from seeing wage increases at 2%.

We also need to see home prices decline by 20% or more. Prices are still going up year-on-year and should register their first modest decline by April of this year.

As we wrote last week, the recent rally has been of poor quality. Like in the summer of 2020, unprofitable companies with weak balance sheets have been the best performers.

Our portfolio is well positioned for a more difficult environment in 2023, i.e., much lower economic activity and even a recession combined with higher interest rates.

Toward the end of the first quarter of 2023, we expect a rotation to higher quality companies with little or no debt and the ability to gain market share. We are already seeing green shoots with small cap and international markets outperforming this year.

Luminated office buildings at Canary Wharf, London at night.

Connor, Clark & Lunn Funds Inc. (CC&L Funds) is excited to announce the recent launch of a prospectus qualified version of the NS Partners International Equity Focus portfolio, which is now available to individual Canadian investors. The NS Partners International Equity Focus Fund is based on a similar portfolio, previously available only to institutional and internal investors.

The Fund seeks to provide investors with long term capital appreciation by investing in a portfolio comprised primarily of non-North American equities, including up to 20% in emerging markets.

To manage the fund, CC&L Funds has retained NS Partners Ltd (NS Partners) a London, UK-based manager with over 30 years of experience in managing international equity portfolios, including developed and emerging markets. NS Partners combines a bottom-up quality/growth framework to analyze companies with a unique top-down global liquidity analysis to help identify regions, countries and sectors that are expected to out and underperform, as well as whether to position the portfolio for a ‘risk-seeking’ or ‘risk averse’ environment.

“For investors allocated to large-cap global equity portfolios, there is a compelling case to make a stand-alone allocation to international equities, given the valuation and concentration issues in the large-cap U.S. equity market, and the headwind of a strong U.S. dollar. By introducing our NS Partners International Equity Focus portfolio in fund format, we can offer a compelling solution for individual investors, managed by a proven, institutional caliber investment team with a differentiated approach” said Tim Elliott, President and CEO of CC&L Funds.

“We’re excited that our International Equity Focus portfolio is being made accessible to a broader group of Canadian investors. With our proven process, a strong record on the institutional side and our talented and committed investment team, we believe this portfolio will provide an attractive solution for those seeking long-term growth from international equity markets.” said Tim Bray, President and Chief Investment Officer at NS Partners.

Both CC&L Funds and NS Partners are affiliates of Connor, Clark and Lunn Financial Group (“CC&L”), whose multi-affiliate structure brings together the talents of diverse investment teams who offer a broad range of traditional and alternative investment solutions. CC&L is one of Canada’s largest independently owned asset managers, responsible for over $104 billion in assets on behalf of institutional and individual investors.

About the fund

Available in A and F Series, the fund conforms with the regulatory framework related to conventional mutual funds offered by Simplified Prospects. The fund will be offered through licensed investment dealers, priced daily, with daily liquidity, and available through FundServ.

About Connor, Clark & Lunn Funds Inc.

Connor, Clark & Lunn Funds Inc. (CC&L Funds) partners with leading Canadian financial institutions and their investment advisors to deliver unique institutional investment strategies to individual investors through a select offering of funds, alternative investments and separately managed accounts.

By limiting the offering to a focused group of investment solutions, CC&L Funds is able to deliver unique and differentiated strategies designed to enhance traditional investor portfolios. For more information, please visit www.cclfundsinc.com.

About NS Partners Ltd

NS Partners Ltd is an independent investment management firm specializing in actively managed global equity portfolios on behalf of major companies, pension funds, foundations, endowments and sovereign wealth funds. NS Partners Ltd is part of the Connor, Clark & Lunn Financial Group, a multi-boutique asset management firm. For more information, please visit www.ns-partners.co.uk.

About Connor, Clark & Lunn Financial Group Ltd.

Connor, Clark & Lunn Financial Group Ltd. (CC&L Financial Group) is an independently owned, multi-affiliate asset management firm that provides a broad range of traditional and alternative investment management solutions to institutional and individual investors. CC&L Financial Group brings significant scale and expertise to the delivery of non-investment management functions through the centralization of all operational and distribution functions, allowing talented investment managers to focus on what they do best. CC&L Financial Group’s affiliates manage over $104 billion in assets. For more information, please visit www.cclgroup.com.

Contact

Lisa Wilson
Manager, Product & Client Service
Connor, Clark & Lunn Funds Inc.
416-864-3120
[email protected]

View of Abu Dhabi Skyline at sunset, United Arab Emirates

 Gulf equity markets rolled over in the fourth quarter and materially underperformed emerging markets. This marks a stark but predictable (as we wrote in our last Q3 letter) reversal in fortunes, with tailwinds of the outperformance in the last 18 months turning to headwinds. We summarize the key drivers of the weakness in Gulf equity markets in the fourth quarter below:

  1. Lower oil price and a different transmission mechanism – Gulf economies are highly levered to oil prices. While a Brent oil price of $80 is healthy for most Gulf economies, surpluses will naturally be lower as prices come down and barrels produced and sold remain static. Moreover, and focusing on Saudi Arabia, the share of oil revenue proceeds going into the banking system has come down considerably as the government allocates an increasing proportion of oil revenue to its sovereign wealth fund where the trickle down to economic activity is seemingly less visible (for now).
  1. Higher interest rates – Gulf currencies are effectively pegged to the U.S. dollar and central banks have had to adjust to the Fed’s four rate hikes of 75 basis points in 2022. The relative attraction of owning equities with three months SIBOR rates reported at 5.59% is understandably low. Gulf investors have more alternatives than ever before to invest their money, with the recent Al Rajhi Bank Sukuk proving to be particularly popular among retail investors. Higher rates are also putting pressure on the net interest margins of banks as they compete to attract deposits. This phenomenon is likely to be especially acute in Saudi Arabia, where the liquidity environment has tightened n the fourth quarter of 2022. Saudi banks represent ~23% of most MENA indices and so the aforementioned profit margin compression has a material impact on the market’s aggregate EPS growth expectations for 2023. In other Gulf markets like the UAE and Qatar, state and quasi-state companies have been pre-paying debt at a rapid pace to avoid higher interest rates, leading to anemic corporate loan growth and further pressure on profitability.
  1. Weaker USD – Gulf equities are effectively US dollar-denominated assets and are generally more attractive for global investors when the U.S. dollar is appreciating. This relationship has become stronger since Gulf equity markets became a large component of emerging market indices. Active Global Emerging Market (GEM) investors are not incremental buyers of Gulf equities in a weaker USD environment and their current underweight exposure to the region suggests they prefer to own assets denominated in non-pegged currencies.
  1. Valuations – Gulf equity markets are coming off excessive valuation levels that reflected over-optimism on the degree and timing of the impact of reform program announcements, and robust foreign inflows following the deletion of Russia from the emerging market universe in March 2022, which we discussed in our second quarter letter.
  1. A wall of offerings – 2022 was a record year for capital raised through primary and secondary transactions and the number of deals closed in the region with 47 listings raising a total of $26.5 billion. A large number of deals and the prospect of share sales by government and quasi-government shareholders took the air out of the market. We think it is wise for government funds to reduce or float their stakes in strategically listed companies given the level of ownership is far above what is required to retain control. However, this is likely to weigh on the share prices of many of the large-cap companies in the market where those entities are key shareholders. On a lighter note, overexcited bankers salivating at the prospect of fees from investment banking deals continue to be a reliable indicator of negative future market performance.

 As for the strategy, we managed – to a large extent— to avoid the significant drawdown that the region experienced in the fourth quarter. Three factors helped us achieve this outperformance:

  1. Sticking to high conviction portfolio companies like Saudi Dairy and Food Co. (SADAFCO) where management execution and weaker competition are leading to significant earnings growth that the market has been behind on for a few quarters now. 
  1. Adding to high conviction portfolio conviction companies that we believe are likely to experience an improvement in an operating environment like the National Company for Learning & Education (NCLE). NCLE’s eleven K-12 schools are experiencing a noticeable increase in utilization as students return to in-person learning in Saudi Arabia and management’s various initiatives (which focus primarily on quality of education in existing schools, M&A and greenfield for new schools) bear fruit.
  1. Reducing or exiting portfolio companies we believe have reached valuation levels that are no longer attractive. A good example of this is Saudi Tadawul Group (STG), the country’s stock exchange which we exited at nearly peak average daily traded value. Over 60% of STG’s revenue is linked to traded values on the stock exchange and our exit decision reflected an understanding that traded values cannot just continue to go up, a view that the market is only getting around now as traded values have dropped 50% y-o-y in recent months.

 We continue to see a strong opportunity for the strategy as the market begins to reflect the “bad news” in the price of assets we like, and as investments in companies we’ve made in the last 6-12 months or earlier continue to deliver. 

 While we acknowledge that the environment has been favourable for the strategy, and decisions we made have on the whole been good ones, we are not resting on our laurels and will endeavor to continue delivering differentiated value-added returns for our clients looking to access the growing investable opportunity in the MENA region. 

Vergent Asset Management LLP