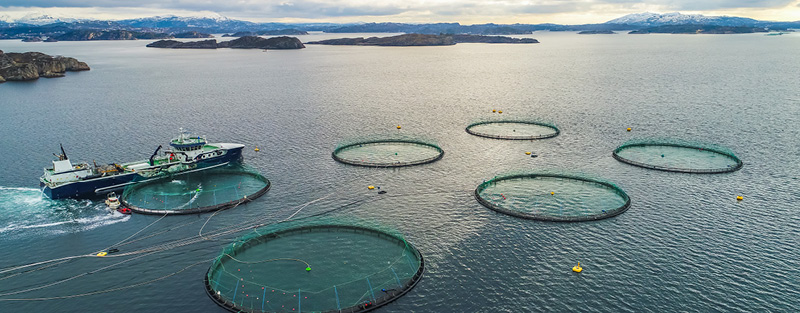
Salmon fish farm. Bergen, Norway.

This week we will be discussing a new addition to the portfolio, SalMar (Ticker: SALM NO), and the latest developments in the salmon farming industry.

The global salmon market was estimated to be a US $50 billion industry in 2020 and expected to grow at 3.7% a year to reach $76 billion by 2028. The growing disposable income in emerging countries and subsequent changes in dietary habits are some of the main drivers behind this growth. Consumers of salmon are more often from the middle- and upper middle-classes who are generally less sensitive to economic slowdowns and less likely to dramatically change their spending patterns, particularly in food purchases. In addition, the health benefits of eating salmon rich in Omega-3 over red meat are well-documented. As a protein, its feed conversion ratio (i.e., the kilograms of feed needed to increase the animal’s body weight by one kilogram) is one of the best among the protein sectors.

Global Alpha received the SalMar shares as part of the cash and share deal that SalMar made to acquire our previous holding in the portfolio, Norway Royal Salmon. The combined entity creates the second-largest salmon farmer in the world.

Both parties have operations in Northern and Central Norway. With this new acquisition, synergies will come from improved utilization of available biomass i.e. the total weight of the fish. SalMar will implement their best-in-class practices at the existing Norway Royal Salmon operations in Norway to improve biological challenges. Gaining increased access to smolt (juvenile salmon) will give SalMar additional benefits stemming from vertical integration such as increasing the quantity of harvested fish, which will optimize the utilization of the processing facility.

However, before the deal closed, the industry received some unexpected news. On September 28, 2022, the Norwegian government announced the most significant change to date to the salmon industry’s regulatory framework by imposing a 40% resource tax on salmon and trout farming in Norway. This would take the marginal tax rate of producers from 22% to 62% if implemented in the initially proposed form. A resource tax is already levied on oil and gas, hydropower operations, and profits generated using Norway’s natural resources.

The major salmon producers were quick to respond to the government’s proposal:

  • SalMar: “Earlier this year, SalMar bought its relative share available for a fixed price for the capacity adjustment in the traffic light system. 1,223 MAB tonnes for a total consideration of NOK244.6 million. SalMar has chosen to use the opportunity to terminate the purchase. This is due to the resource rent tax the Government has now announced.” 
  • Leroy Seafood (LSG NO): “In 2022 Leroy purchased 614 tonnes maximum allowable biomass under the so-called traffic light system at a total value of NOK123m. Leroy has decided to cancel this purchase. Increasing the tax rate from 22% to 62% creates unreasonable framework conditions for the industry in Norway, changing the scope and incentives for investments in areas other than maintenance capex. All major new investments in the Group’s value chain in Norway must regrettably be put on hold pending the decision of the Storting, the Norwegian parliament.” 
  • Mowi (MOWI NO): “In light of the Norwegian government’s proposal for a 40% resource tax on Norwegian aquaculture, and a resulting total tax of 62%, Mowi is cancelling its acquisition of 914 tonnes MAB for a total value of NOK183m. The government’s tax proposal means that Mowi can no longer justify the purchase price. Mowi respectfully advises the government to reconsider its resource tax proposal.” 

In addition to suspending purchases, the biggest salmon producers were notably absent from the first auction of biomass capacity since the government proposed the resource tax, even though these same producers bought capacity at the previous auction in 2020.

More recently, shares of the Norwegian salmon producers have been reacting to headlines from politicians. They first rose after Geir Pollestad, deputy leader of the Norwegian Center Party, told a local newspaper that the party was open to modifying the tax. However, finance minister Trygve Vedum said shortly afterward that the original proposal of a 40% tax should remain. With the governing parties losing popularity, and amid growing concerns about the over-reliance of regions on the salmon industry for employment, we foresee a compromise will be reached and a modified version of the original proposal will be implemented.

Supply growth should remain muted given increased biological challenges and stricter regulations. We see support for salmon prices and demand for salmon is likely to remain strong despite the challenges. These social and environmental aspects are further reasons why exposure to the salmon industry is attractive and we will continue to follow as developments unfold.

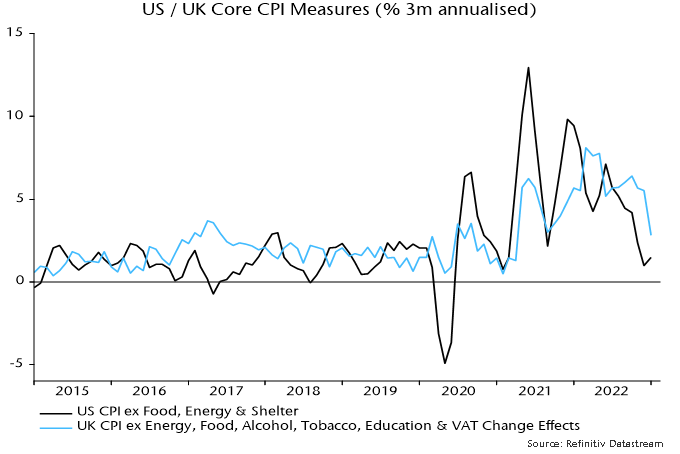
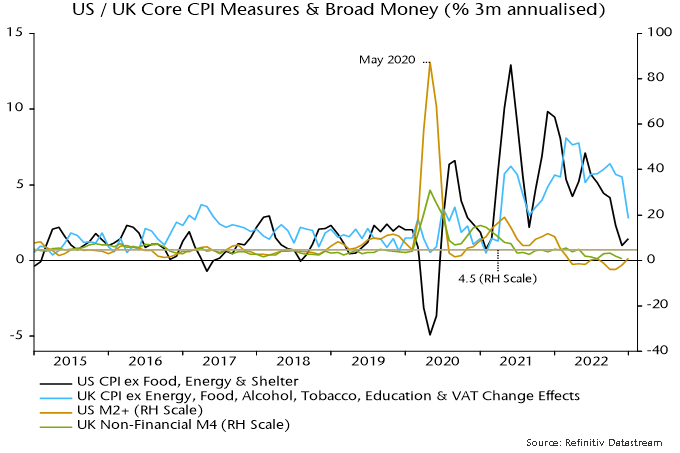
US and UK CPI data this week elicited opposite market reactions but core momentum has recently slowed notably in both cases, consistent with a moderation in money growth rates two years earlier. 

Chart 1 shows three-month annualised rates of change of preferred core measures – CPI ex. food, energy and shelter for the US and CPI ex. energy, food, alcohol, tobacco, education and VAT change effects for the UK. US three-month momentum was just 1.5% in January, while UK momentum fell sharply to 2.8%.

Chart 1

Chart 1 showing US / UK Core CPI Measures (% 3m annualised)

The ”monetarist” rule of thumb is that money leads prices by about two years. Chart 2 superimposes three-month rates of change of broad money. Growth peaked in May 2020. The recent significant declines in core CPI momentum began in June 2022 in the UK and July in the US.

Chart 2 

Chart 2 showing US / UK Core CPI Measures & Broad Money (% 3m annualised)

Average broad money growth of 4.5% pa in both the US and UK over 2010-19 was associated with sub-2% average core CPI inflation. Three-month rates of change of broad money moved below 4.5% annualised on a sustained basis in March 2022 in the US and June in the UK. A reasonable expectation, therefore, is that core CPIs will be rising at a sub-2% by mid-2024 in both cases.

The path lower in money growth from the May 2020 peak was bumpy and core CPI momentum is likely to display similar volatility around a declining trend.

Japanese monetary trends continue to argue that current inflation is “transitory” and there is no case for BoJ policy tightening. 

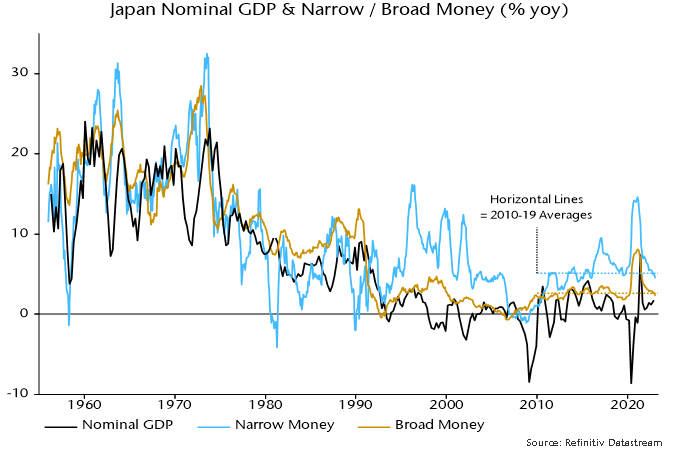
Broad money M3 rose by just 0.1% in January, pulling annual growth down to 2.3%, below a 2010-19 average of 2.6%. Annual M1 growth is also below its corresponding average – see chart 1. 

Chart 1

Chart 1 showing Japan Nominal GDP & Narrow / Broad Money (% yoy)

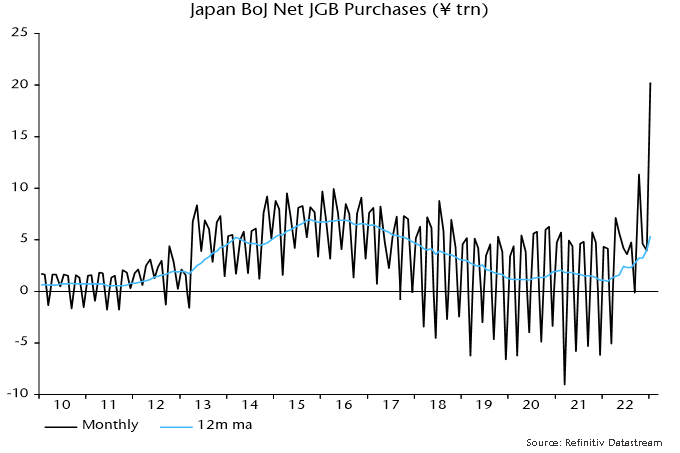
M3 showed little growth on the month despite BoJ net JGB purchases reaching a record ¥20.3 trillion, equivalent to $155 billion or 1.3% of the stock of M3 – chart 2. The modest M3 increase pushes back against claims that BoJ JGB buying has “pumped liquidity into markets”. 

Chart 2

Chart 2 showing Japan BoJ Net JCB Purchases (¥ trn)

A counterparts analysis of M3 is not yet available for January but the lack of impact of QE is probably explained by the BoJ transacting mainly with commercial banks. A purchase from a bank involves a JGB / reserves swap with no effect on deposits held by non-banks. 

A further technical point is that Japanese money definitions exclude holdings of non-bank financial institutions, so purchases from such institutions also have no direct effect on M3. 

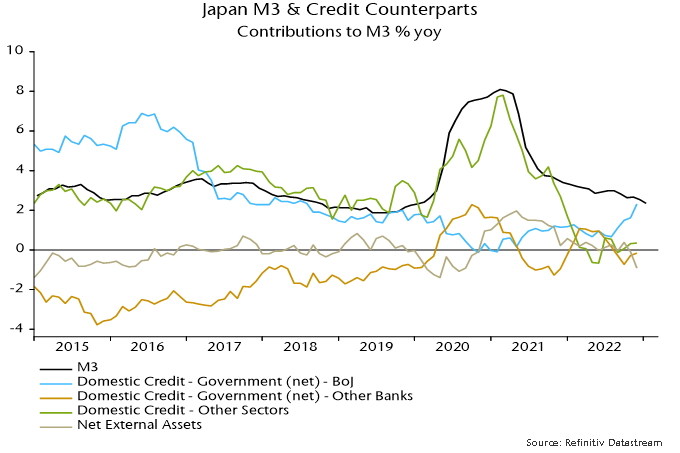
Chart 3 shows the contributions to annual M3 growth of selected credit counterparts through December. A substantial positive contribution from QE (domestic credit to government from BoJ) was offset by weakness in domestic credit to other sectors and negative contributions from commercial bank JGB sales (domestic credit to government from other banks) and net external flows. The latter drag partly reflects BoJ intervention to support the yen in late 2022. 

Chart 3

Chart 3 showing Japan M3 & Credit Counterparts Contributions to M3 % yoy

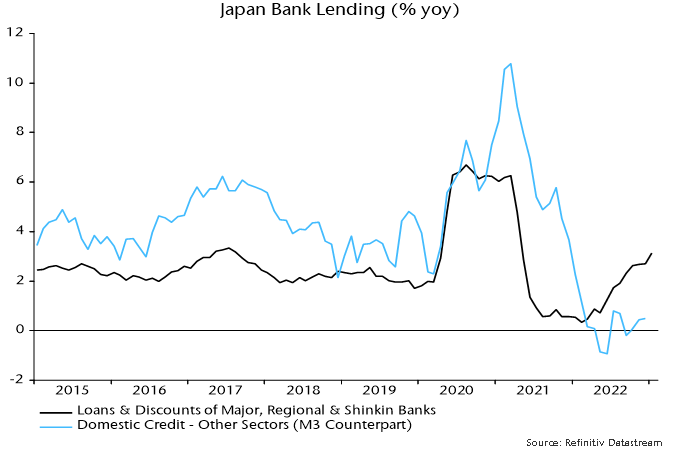
The weakness of credit expansion to non-government domestic sectors in the M3 counterparts analysis contrasts with a recent pick-up in annual growth of loans and discounts by major, regional and Shinkin banks – chart 4. The explanation for the divergence is that the M3 credit measure encompasses lending to non-bank financial institutions, including by the BoJ. Such lending surged during the pandemic but has contracted recently. 

Chart 4

Chart 4 showing Japan Bank Lending (% yoy)

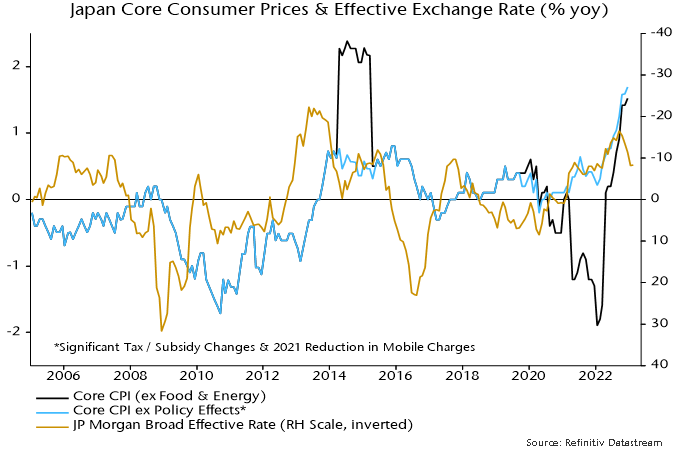
Annual all-items consumer price inflation rose to 4.0% in December, the highest since 1981, and may have reached 4.5% in January, based on Tokyo data. Core inflation adjusted for the impact of major policy changes was 1.7% in December and may have increased to 2.0-2.1% in January. The recent pick-up partly reflects yen weakness, which may be reversing – chart 5. 

Chart 5

Chart 5 showing Japan Core Consumer Prices & Effective Exchange Rate (% yoy)

Annual cash earnings growth surged to 4.8% in December as winter bonuses reflected recent strong profits. Scheduled earnings growth of 1.8% is a better guide to trend but also represents a multi-decade high. 

The reversal of the 2020-H1 2021 M3 growth surge suggests that inflation and earnings growth are at or near a peak and will return to pre-pandemic levels in 2024-25.

African American Business Data Analyst Woman Using Computer, global map and data on screen

Investors globally have embraced global small cap equities as a source of equity diversification. Despite the name, the universe is largely comprised of companies with a market capitalization greater than US $1 billion and includes a growing number of household names in many of the local markets and some having a global brand recognition.

Key merits of global small cap

Not that small Over 2,600 global small cap companies have a market capitalization greater than US $1 billion
Breadth and depth Largest stock is only 0.2% of the index and there is broader sector diversification compared to other major market indices
Alpha opportunities Global small cap markets are less researched by the analyst community compared with large cap developed equity markets, which creates added value opportunities for independent research by active managers


Background to global small cap

Global small cap stocks offer investors the ability to benefit from a unique opportunity set. The MSCI World Small Cap Index captures small cap representation across 23 developed market countries. Compared to a domestic context, the global small cap opportunities are not that small; there are 2,643 companies with a market capitalization greater than US $1 billion at December 31, 2022. There were only 209 such companies in the S&P/TSX Composite Index.

The largest individual stock in the global small cap index represents only 0.2% of the index. In contrast, the largest individual stock at the end of 2022 in the S&P/ TSX Composite Index represented 6.3% of the index.

Moreover, the largest 15 stocks in the Canadian equity market index account for 45% of the index, while the largest 15 stocks in the global small cap index represent less than 3%. It would require the largest 627 stocks to achieve 45­% index representation in the global small cap index, highlighting the much broader investment opportunity set offered by the global small cap universe.

Many of the stocks in the global small cap universe are household names in their local market, and some have a global brand recognition. For example, L’Occitane, the manufacturer, marketer, and retailer of natural and organic skincare and beauty products; Samsonite, the world’s best-known and largest travel luggage company; and IWG, which offers short-term (and long-term) workspace solutions around the world, including well-known brands such as Regus.

The diversification benefits of global small cap go beyond individual stocks. While the major Canadian indices are heavily skewed to the financial, energy, and material sectors (see Figure 1), the global small cap markets provide representation across a broader range of sectors, including higher exposure to consumer discretionary (e.g., companies in the restaurant, luxury goods and travel industries) and health care.

Figure 1 – Small Cap Sector Diversification Merits

MSCI Global Small Cap Index (%) S&P/TSX Composite Index (%)
Energy 5.0 18.1
Materials 7.6 12.0
Industrials 19.4 13.3
Consumer Discretionary 12.5 3.7
Consumer Staples 4.7 4.2
Health Care 10.7 0.4
Financials 14.3 30.8
Information Technology 10.8 5.7
Communication Services 2.8 4.9
Utilities 3.2 4.4
Real Estate 8.9 2.6
Total 100 100


Source: MSCI and Thomson Reuters Datastream. Data as at December 31, 2022

Over the last 10 years, the global small cap index has achieved the strongest return, albeit with greater volatility (Figure 2). As with all markets, it is important to understand the investment risks.

Figure 2 – 10-Year Risk and Return (Ending Dec. 31, 2022)

Source: MSCI and Thomson Reuters Datastream. Note: Index returns are in Canadian dollars.

Understanding the risks

While active managers can mitigate some of the risks through research and careful selection of individual stocks, when it comes to global small caps, investors should recognize the following:

  • Liquidity risk: It can take longer to trade a small cap stock compared to large cap stocks.
  • Information flow: While higher insider ownership associated with small cap stocks aligns with the interests of investors, it can also lead to less transparency and flow of information common with global large cap investments.
  • Credit access: Small companies do not have the same access to credit markets as larger companies, which can sometimes limit a small company from realizing its potential.

Recognizing the potential benefits

Offsetting the risks are a number of potential benefits of global small cap investments:

  • Growth opportunity: For investors who can identify the next generation of small companies that grow faster and graduate into the large cap segment, the reward is significant.
  • Greater alignment of interest: Global small cap companies tend to have a more focused line of business and higher insider ownership, resulting in greater alignment of interests between the owners and shareholders.
  • Sector opportunity: Investors can benefit from the higher consumer discretionary and health care sector representation offered by the global small cap index. For example, consumer-spending patterns indicate the consumer discretionary sector is likely to perform well over the long term. The health care sector should also benefit from demographic aging in the developed world.
  • Added value opportunity: Small cap companies also tend to be less externally researched by the analyst community. As a result, active managers have a greater opportunity to outperform their index benchmark by identifying companies whose share price does not fully reflect their intrinsic value or growth prospects. Based on the eVestment database, 71% of managers in the active global small cap universe outperformed the MSCI World Small Cap Index over the 5 years ended December 31, 2022.
  • Style offset opportunity: At the end of 2022, over 4,425 companies were in the MSCI World Small Cap Index. The broader opportunity set has led to an increased number of global small cap strategies offered by systematic (quantitative) investment managers. With a systematic approach, an investment manager is able to benefit from a breadth of understanding on a large universe of companies, compared to the depth of understanding associated with fundamental managers, who are focused on selecting a smaller number of companies to invest in. As for other equity markets, investors who can accommodate multiple managers in an asset class can benefit from the complementary systematic and fundamental styles.

Case for global small cap equities

The last several years has witnessed increased concentration in the global large cap developed equity market index. Introducing a global small cap equity component to portfolios can provide a complimentary source of diversification, a broader opportunity set of less externally researched companies, and thereby offering the potential for delivering returns above the index through active management.

Image of Banyan employees in boardroom meeting

Banyan Capital Partners, a leading Canadian middle-market private equity firm, is pleased to announce the following updates from 2022 which marked another successful year for the firm.

New Hires and Promotions

  • Scott Morrison has been promoted to Vice President, Business Development
  • Chris Luongo has been promoted to Associate
  • Marat Altinbaev joined in April 2022 as Vice President
  • Michael Tan joined in August 2022 as Senior Analyst

Banyan’s success depends on its ability to attract, develop, and retain high-quality talent.

Learn more about our team.

Portfolio Spotlight

Image of truck applying salt/solution

Innovative Surface Solutions

In Banyan’s first year of ownership, three new executives were hired:
• Mike Betts joined as VP Sales & Marketing
• Jason Bagley joined as COO
• Anand Khanzode joined as CFO

Image of mountain bike in bike rack on top of car

Rack Attack

Rack Attack added 14 new locations in Canada and the U.S. during the year, bringing the total store count to 38 across North America.

The Company’s expansion efforts are set to continue in 2023 with the opening of additional stores throughout the year.

Image of vitamins/supplements

Purity Life

Purity Life opened a new 40,000 square foot facility in Laval, QC, expanding its distribution network to over 150,000 square feet across Canada.

Image of cement truck

Newcrete

Newcrete completed the acquisition of R&L Contracting, a concrete forming business in St. John’s, Newfoundland.

Image of doctor

MIP

MIP Inc. announced the appointment of Dean Johnson to the position of President and Chief Executive Officer.

Learn more about our current investment portfolio

Launch of the Banyan Operating Partner Network and welcoming Jason Grouette

In December 2022, Banyan partnered with Jason Grouette, a former 3M executive to target investment opportunities in the safety and industrial B2B space.

Learn more about our Operating Partner Network

New Investments

We look forward to another successful year and are excited to explore new investments and partnerships with middle market businesses across North America. We continue to invest out of our $216 million committed capital fund targeting investments between $10 million and $50 million of equity per transaction in companies with EBITDA of at least $5 million.

Do you have an opportunity in mind?

Learn more about our investment criteria or reach out to us to start a conversation.

Group of Sikh pilgrims walking by the holy pool, Golden Temple, Amritsar, Pun jab state, India.

Sparked by China’s rapid reopening, emerging market equities staged a sharp recovery from the lows of last October with the MSCI EM Index up nearly 23% (in USD terms) since the end of October, led by China which is up 54%.

The Institute of International Finance reported that January flows into EM equities and debt were the second strongest on record — the strongest being post-lifting of lockdowns in late 2020.

Buoyant sentiment in India is set to be tested with the collapse of Adani Group’s follow on public offer (FPO) after a report by U.S. short seller Hindenburg Research accusing the conglomerate of “brazen stock manipulation and accounting fraud over decades.”

The news drowned out positive press on the Indian federal government’s budget, with tax relief for India’s middle class expected to boost consumption, alongside a drive to slash regulations and improve the ease of doing business across the country.

The Bank of Korea is raising rates aggressively, pressuring equities and property markets. There is also added pressure from the downswing in the semiconductor cycle hitting DRAM giants Samsung Electronics and SK Hynix. Macro in Korea is a drag but longer-term the U.S. Inflation Reduction Act will provide a meaningful tailwind for the economy, particularly for those companies operating in the EV and renewables supply chains. There is also added pressure from the downswing in the semiconductor cycle hitting DRAM giants Samsung Electronics and SK Hynix but both are guiding for a H2 recovery and a strong 2024 outlook.

Similarly in Taiwan, there are signs that the semi cycle is bottoming. TSMC reported results with management expecting a H2 rebound in demand driven by increasing demand from data centres/hyperscale servers/AI applications, along with greater penetration in EVs.

Money numbers in a number of major EM countries outside of Asia are picking up. In Brazil, inflation has fallen and there should soon be some scope for central bank easing (after pausing hikes at 13.75% last September). However, we are cautious of the impact of weakening commodities and political risk. In mid-January President Luiz Inácio Lula da Silva gave a TV interview where he stated that the formal independence of the central bank (enshrined into law in 2021) was “nonsense”. This was likely retaliation to comments from central bank governor Robert Neto that a spending boom by Lula’s government posed an inflationary risk. Tempering this political risk is a divided and right-leaning Brazilian Congress which should force Lula to moderate.

Can the EM bounce be sustained?

While 2022 was a painful year for EM equities (following a disappointing decade), the outlook is increasingly positive as a number of headwinds abate.

  • Inflation – superior monetary policy and greater fiscal discipline in EM is the foundation for falling inflation, which opens the door to policy easing as the Federal Reserve approaches the end of its tightening cycle.
  • Economic growth – global economic weakness remains a headwind. However, EM is forecast to outpace growth in the West, led by China reopening. GDP in EM economies is expected to grow by 3 ppts more than the rate in the U.S. over 2023 and 2024, versus even in 2022 (Morgan Stanley).
  • Earnings momentum – the relative profitability gap between EM and DM is set to close, as companies benefit from the end of an extended deleveraging cycle and the recent period of global monetary tightening. On the other hand, profit margins in the U.S. sit at all-time record levels, a significant hurdle in the face of higher labour and other input costs.
  • Valuations – attractive relative to history and to DM, with positioning in EM equities among global allocators currently at depressed levels (Copley Fund Research).
  • Dollar – the dollar slumping into year-end 2022 was a tailwind for EM, but we are sceptical that the slide will continue at this rate in the near-term. Positive catalysts for a weaker dollar will include inflation continuing to fall, thereby increasing the odds of a Fed pause, and improving EM growth relative to DM.

China rally – is it time for a breather?

Chinese equities have run up a long away over the last two months following Xi’s pivot to more pragmatic policy on COVID, property, tech regulation and foreign relations. Abandoned by foreign investors earlier in 2022, H-shares rallied hard while A-shares lagged.

Chart 1: CSI 300 & HSI Index P/E
Source: Bloomberg
Chart 2: CSI 300 & HSI Index (Normalised)
Source: Bloomberg

Valuations across Chinese equities remain supportive, although our view is that the “reopening trade” is now largely reflected in valuations. From here we see support for continued outperformance by Chinese stocks on an economic growth and corporate earnings recovery, along with positive money numbers. Consumption data over the Chinese New Year period were generally better than expected, with retail sales, passenger trip volumes, domestic tourism, box offices sales and restaurant sales up significantly and in many cases exceeding pre-COVID numbers.

That said, we do not expect a repeat of the reopening boom (in markets and the economy) that took place in the West when lockdowns ended. In the U.S. and Europe there were huge excess money balances and pent-up demand, to a far greater degree than what we currently see in China. On the latter, China was not subject to countrywide lockdowns, instead, harsh restrictions were applied on a regional basis to stamp out spikes in case numbers. In addition, the PBoC appears to be far less expansionary than Western counterparts, wary of setting off a wave of inflation as a result of pumping too much monetary stimulus. The weakness in the Chinese property market will also weigh on recovery as a negative wealth effect will hit consumer sentiment. Markets will be watching for additional government support to quash lingering structural risks in the sector. 

Adani to test “India Inc.”

U.S. short-seller Hindenburg released a damaging short report claiming that giant Indian conglomerate Adani Group (with businesses across healthcare, energy, food and infrastructure) has been involved in “brazen stock manipulation and accounting fraud over decades.” The report argues that the group operated an elaborate web of shell companies across numerous tax havens, which were used as instruments to inflate Adani stock which in turn would be pledged as collateral for loans and thus placed the group on a “precarious financial footing”.

Hindenburg alleges the fraud enabled founder and Chairman Gautam Adani – who rose to prominence in Gujarat at the same time Prime Minister Narendra Modi was the state’s chief minister – to amass a personal fortune of over US$120 billion. Much of the wealth is owing to an 800% appreciation in stock prices across the Group’s seven listed companies over the last three years.

The release of the short report and subsequent collapse of Adani Enterprises’ stock has scuttled plans to raise over US$2 billion via a follow on public offer. Attention now turns to the Modi government and the Securities and Exchange Board of India to investigate any wrongdoing. Given both the close ties between Modi and Gautam Adani, and a business that lies at the heart of India’s economy, this will be an important test of institutional credibility.

We have written to clients extensively on India’s steady progress up the development ladder and opportunity this presents to investors. How authorities deal with this situation will provide an indicator of this progress – they will have to catch up to the local investment industry which has viewed Adani with suspicion for years. Hindenburg notes in its report that despite the Adani Group’s size, there is a dearth of reputable sell-side coverage on the companies, and no local active funds willing to hold these stocks in any meaningful size. We will watch on with interest to see how the government and the SEBI engage with the accusations – and hope for a tough response should they hold water.

We are sanguine with respect to the potential for systemic fallout in India should Adani collapse. India’s state banks would bear the brunt, however, it is likely that the viability of projects tied to Adani loans should cushion the blow. Indeed, should the market narrative around India’s rise lose some sheen in the coming months, we may see some emerging opportunities to add exposure to some names that we believe are long-term winners.

View of Mountain Fuji at Shizuoka prefecture, Japan.

Nuclear power is a low-carbon, reliable source of energy. Yet, over the past decade, it has struggled to play a strong role in energy transition. Nuclear power generation has been around since the 1960s, and saw massive growth from the 1970s to 1990s. Since then, however, its share of global electricity production has declined from 17% in the 1990s to the current 10%, largely due to safety concerns following the tragic accidents in Chernobyl in 1986 and Fukushima in 2011.

Chart 1: Share of electricity production by source, World.

Today, nuclear energy’s role in the energy system varies by country. In 2021, for example, nuclear accounted for 69% of total domestic electricity generation in France, 51% in Belgium, 28% in South Korea, 20% in the United States, 12% in Germany, 7% in Japan, and 5% in China.

Amid the global energy crisis following the war in Ukraine, many nations have prioritized efforts to reduce their reliance on imported fossil fuels. Add the backdrop of the global climate crisis, and the search for other sources takes on increased importance. Renewable energy sources have experienced remarkable growth in recent years, yet renewables alone are not sufficient to fully decarbonize the energy grid. This opens the door to an increased role for nuclear power.

According to the International Energy Agency (IEA), global nuclear capacity needs to expand by about 10 gigawatts (GW) per year to be on track with the Net Zero Emissions by 2050 Scenario. In 2022, nuclear energy had an operational capacity of 413 GW in 32 countries, thereby helping reduce reliance on fossil fuels while also avoiding 1.5 gigatonnes (Gt) of global emissions and 180 billion cubic metres of global gas demand a year. Emerging countries accounted for almost all new nuclear capacity added in recent years, while developed economies are catching up.

The UK currently has 5.88 GW of nuclear capacity, accounting for 15.5% of energy generated in 2022. It has set a goal to reach 24 GW by 2050, about 25% of UK’s predicted energy demand.

In the U.S., meanwhile, nuclear energy has consistently provided about 20% of total electricity generated over the past 30 years, and that country’s 93 operating nuclear reactors had a combined capacity of 95 GW at the end of 2021. However, as most of the American nuclear plants are approaching their 40-year design life, capacity will need to be extended or added to achieve the 2050 net zero goal.

Before the Fukushima disaster, Japan sourced about a third of its electricity from 54 nuclear reactors, but only nine are still operational. Following the war in Ukraine and the subsequent energy crisis, Japanese citizens’ sentiment toward nuclear reactors has shifted positively. In December 2022, the Japanese government announced a new nuclear energy policy aimed at maximizing the use of existing nuclear power plants and building next-generation reactors. Nuclear currently accounts for 7% of total power generation in Japan, and their goal is to increase the percentage to 20-22% by 2030. But getting there will require about 26 to 33 operational nuclear reactors.

Two major barriers hindering the growth of nuclear power are safety concerns, and elevated construction and operating costs. However, advancing technologies can help to overcome those barriers. Small Modular Reactor (SMR), for example, can be made in factories and installed on site, reducing both initial costs and construction times. The smaller size also makes economic sense for small electric grids. It is also believed to have enhanced safety characteristics.

Most recently, scientists have achieved a breakthrough by successfully producing a nuclear fusion reaction resulting in a net energy gain, instead of just breaking even as past experiments have done. Nuclear fusion provides carbon-free energy, without the highly radioactive, long lived nuclear waste created by current nuclear reactors. The process is inherently safe as fusion is a self-limiting process, the reaction could come to a halt within seconds. However, it will take years if not decades before fusion can meaningfully contribute to energy transition. The next step is to figure out how to produce more energy from nuclear fusion on a much larger scale, and at a lower cost.

Global Alpha has some holdings in the nuclear power sector that we believe offer good investment value.

For example:

Curtiss-Wright (CW US) supports the global nuclear power industry by providing precision components and highly engineered products and services. The company has an installed base of products at all nuclear plants operating in the U.S., and many operating internationally. Curtiss-Wright designed the world’s most advanced reactor coolant pump for Westinghouse’s AP1000 reactor, one of the safest and most economical nuclear plant designs available worldwide and has been approved or planned at many nuclear plant projects globally, notably in China, India, U.S., and UK. Curtiss-Wright also works with SMR and Advanced Reactors designers to ensure its presence in the future growth of this market. It has the opportunity to secure $10 million to $100 million in content per location.

Horiba (6856 JP) manufactures measurement equipment, specializing in the analytics and measurement of small particles in the field of environment, health, safety, and energy. Among its extensive product lineups, Horiba offers a wide range of measuring instruments and sensors to measure the pH of secondary water in nuclear power plants. For example, measurement of silica is paramount in preventing the problem of scaling, which reduces the efficiency of power generation. Horiba provides silica analyzers to allow for quick and automatic measurement for boiler water, and trace amount of silica present in pure water. 

The unusually high level of job openings may be affecting the seasonality of US labour market data. An accurate read on the non-seasonal employment trend may not be possible until the spring. 

The normal seasonality of US private payrolls is captured by the difference between BLS unadjusted and seasonally adjusted stock series, shown in chart 1. The seasonal effect is roughly neutral in September, rises to a peak in November, turns substantially negative in January and recovers back to neutral in May. 

Chart 1

Chart 1 showing Seasonal Variation in US Private Payrolls (000s) Unadjusted minus Seasonally Adjusted Levels

The normal pattern of employers shedding jobs on a large scale in January but rehiring into the spring / summer could change when the labour market is unusually tight, as currently. Firms may prefer to hold onto workers as seasonal activity slackens, anticipating difficulties refilling jobs later in the year. Laid-off employees may find alternative work more rapidly than in a normal year. 

A change of behaviour may explain the blockbuster January payrolls rise, i.e. the seasonal adjustment may have significantly overestimated the seasonal drop in employment this year. 

An alternative approach to assessing the underlying jobs trend is to compare months when the seasonal effect is neutral. As noted, September and May are neutral months, while seasonal deviations are significant over October-April. The average change in unadjusted payrolls over September-May should be an undistorted measure of employment growth. 

If the suggestion of a seasonal distortion is correct, headline payrolls growth numbers for February-May could understate the underlying trend, compensating for January’s (possible) overstatement. 

Suppose, for illustration, that monthly growth in unadjusted payrolls turns out to average 150,000 between the two seasonally neutral months of September 2022 and May 2023. (This equates to an annualised growth rate of 1.4%, in line with the reported expansion of the labour force in the year to January, i.e. the assumption is consistent with a stable unemployment rate.) 

Such growth would imply a payrolls level of 132,686,000 in May 2023, with no significant seasonal element. This compares with a currently reported seasonally adjusted level of 132,684,000 for January. The headline payrolls measure, on these assumptions, would show negligible growth over February-May.

The consensus is gloomy about UK economic prospects but is it gloomy enough? 

The current debate has echoes of mid-2008. Q2 2008 was the first quarter of the most severe post-war recession. The consensus that summer was that the economy would eke out growth with a limited rise in unemployment and no need for significant policy easing. 

A recession is widely acknowledged / expected now but the majority view is that it will be shallow and short-lived, partly reflecting recent energy price relief. Labour market damage is projected to be modest and there is general approval of recent MPC policy tightening. 

Monetary trends warned of worse-than-expected outcomes in 2008 and are giving an equally negative message now. 

The six-month rate of contraction of real narrow money (i.e. non-financial M1 deflated by consumer prices) was unchanged at 5.9% (not annualised) in December, close to a 6.1% peak reached in October 2008 – see chart 1. 

Chart 1

Chart 1 showing UK GDP & Real Narrow Money* (% 6m) *Non-Financial M1 from 1977, M1 before

As in 2008, the real money squeeze reflects both high inflation and nominal money weakness. Sectoral nominal money trends are uncannily similar to mid-2008. Corporate M1 and M4 are contracting rapidly, consistent with a sharp fall in profits and suggesting cuts in employment and investment – chart 2. 

Chart 2

Chart 2 showing UK Household & PNFC* Money (% 3m annualised) *PNFCs = Private Non-Financial Corporations

Household M4 is still growing modestly but there has been a large-scale switch out of sight into time deposits in response to rising rates – a classic signal of a shift in consumer behaviour from spending to saving. 

A continued rise in employee numbers in recent months has fed a narrative of labour market “resilience” that is expected to persist. Data and complacency were similar in mid-2008. The quarterly employee jobs series rose into Q3 2008 but the stock of vacancies in June was already down by 9% from its peak, warning of trouble ahead – chart 3. The level of vacancies is higher now but the fall from the peak has been larger, at 14%. 

Chart 3

Chart 3 showing UK Employee Jobs (mn) & Vacancies* (000s) *Single Month, Own Seasonal Adjustment

Eurozone flash PMIs this week were less bad than expected, bolstering a growing consensus that economic prospects are improving. Monetary trends continue to argue the opposite. 

The preferred narrow money measure here – non-financial M1 – fell for a fourth consecutive month in December in nominal terms. Bank lending also contracted on the month, while the broad non-financial M3 measure grew by just 0.1%. 

The three-month rate of contraction in narrow money is a record in data back to 1970. Three-month growth of non-financial M3 is down to 2.3% annualised, less than half its 2015-19 average. Bank loan growth is also now below its corresponding average – see chart 1. 

Chart 1

Chart 1 showing Eurozone Narrow / Broad Money & Bank Lending (% 3m annualised)

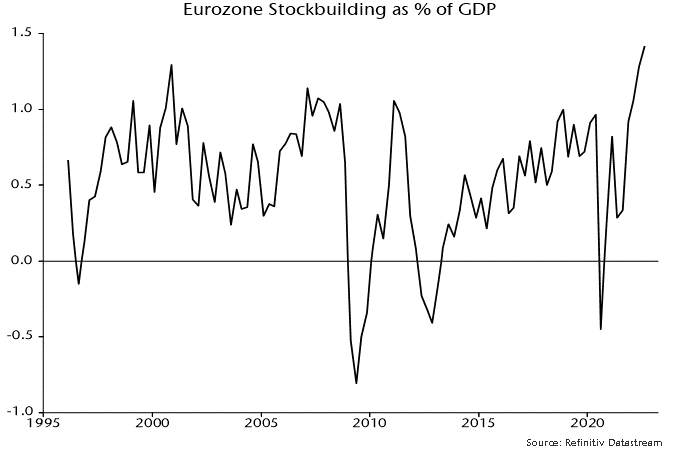
Bank lending weakness is being driven by repayment of short-term corporate loans, consistent with a violent downswing in the stockbuilding cycle – chart 2. 

Chart 2

Chart 2 showing Eurozone Stockbuilding as % of GDP (yoy change) & Short-Term* Bank Loans to Non-Financial Corporations (yoy change in % 3m) *Up to 1y Maturity

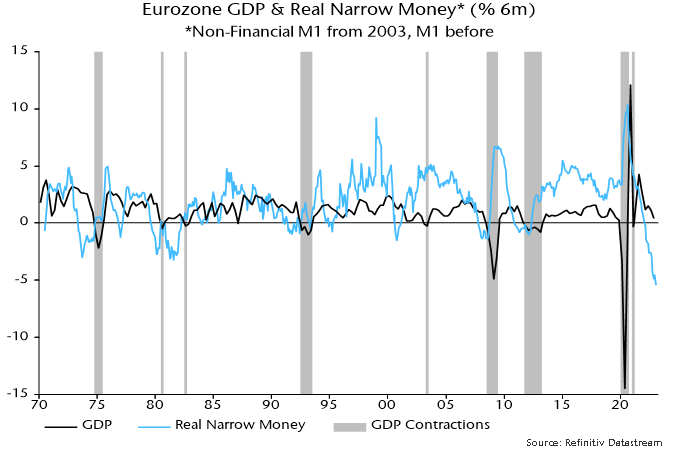
The six-month rate of decline of real narrow money was little changed from November’s record despite a sharp drop in six-month CPI momentum – chart 3. 

Chart 3

Chart 3 showing Eurozone GDP & Real Narrow Money* (% 6m) *Non-Financial M1 from 2003, M1 before

The rate of contraction of real M1 deposits remains fastest in Italy, reflecting both weaker nominal money trends and higher inflation. Spanish positive divergence is mainly due to a much sharper recent CPI slowdown. 

Chart 4

Chart 4 showing Real Narrow Money* (% 6m) *Non-Financial M1 Deposits

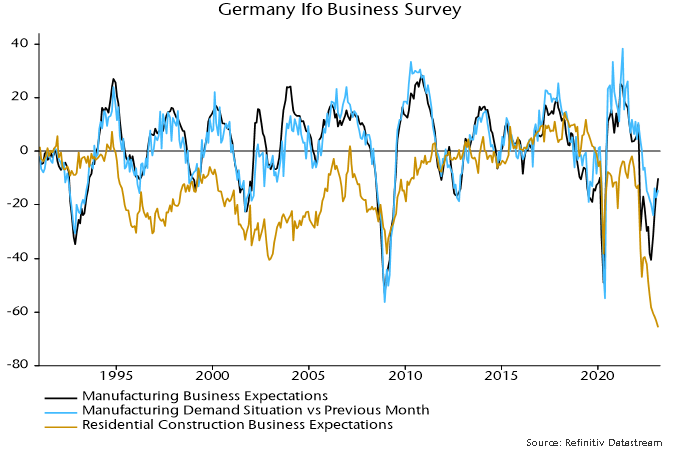
Echoing the better PMI news, German Ifo manufacturing expectations rose for a third month in January. The new demand index, however, has recovered by less and fell back this month – chart 5. European cyclical equity market sectors have outperformed on soft landing hopes and are vulnerable if business surveys now stall, as suggested by monetary trends. 

Chart 5

Chart 5 showing Germany Ifo Manufacturing Survey & MSCI Europe Cyclical Sectors ex Tech* Price Index Relative to Defensive Sectors *Tech = IT & Communication Services