Federal Reserve Bank of Chicago.

It has been an extremely busy period as we navigated the banking environment. The risk of contagion is top of mind as well as the impact on our investments. The difficulty is that for a bank, added outsized risk can come in many shapes and forms. In 1907, the crisis came from overzealous bank owners attempting to corner the copper market. Today, for SVB, it came from duration misalignment of investments and even cryptocurrencies for Signature Bank. Elevated risk taken by banks often occurs when executives allow deposits and loans to grow faster than what their specific team of lenders and investment managers can handle in relation to risk.

Elevated risk can also come from other sources, such as too much government intervention in the case of the Baoshang bank in China in 2019 or severe mismanagement at all levels in the case of Credit Suisse. That’s the bad news. With 25,000 banks globally and 4,844 in the U.S. alone, let’s expect further difficulties to the system. Outflows are at 1.9%.

The good news is this is taken with extreme attention by government and banking associations. In the last two weeks, our team has travelled extensively, especially in Japan and the U.S. We were actually in California when we noticed the SVB debacle on the Friday. During a Monday morning presentation, a non-portfolio company commented that it had a US$80 million deposit with the California bank. All access to deposits was resolved by 11 a.m., certainly a sign of quick response.

Global Alpha holds larger exposure to financial services firms than bank stocks themselves. Its largest exposure is with Rothschild & Co (Roth FP), which provides global financial advisory (mergers and acquisitions and financing advisory). The company also has a wealth division and merchant bank that account for 24% and 16% of sales, respectively. Tracing back to 1760, the company now operates with 4,200 financial specialists across 40 countries. From its strong Europe-based foothold, the company is successfully growing its operations in North America. Rothschild & Co is presently subject to a takeover bid by the founding family’s financial holding.

Another important position for us in financial services is PRA Group (PRAA US). The U.S.-based company is a leading debt collection agency servicing mostly the financial industry, acquiring debt packages from banks and credit card companies. PRA is vertically integrated, from debt acquisition all the way down to call center-based collections, giving it a strong competitive edge. Increasing regulations implemented in the debt collection industry are certainly favouring PRA in the long term. The company has global footprint, with leading operations in North America and Europe.

Our positioning in regulated banks follows our general philosophy of investing in quality assets where we assess balance sheet strength, operational excellence, competitive standing and target markets. We generally tend to be underweight in banks, as most banks have low exposure to higher-growth investment themes and/or are constrained by increasing regulations. Our holdings include: 

Seven Bank Ltd. (8410 JP): The company provides banking services mainly through automated teller machines (ATM) across Japan. Culturally, the Japanese continue to rely on cash as their preferred payment method, mostly for security and identity theft reasons. Although licensed under a bank charter, Seven Bank majorly operates as a technology company through its 26,253 ATM outlets. Services are growing rapidly supplementing cash distribution, and novel and growing additions include credit and investment services. Its balance of deposits stands at ¥578 billion while its loan book conservatively stands at ¥32.7 billion.

With over 250 banks in our index, Global Alpha has low exposure to direct commercial real estate lending, an area that is being scrutinized with the increasing vacancies in commercial downtown centers. Our direct exposures are the following:

Wintrust Financial Corp. (WTFC US): Wintrust is a financial holding company with community bank locations in and around Chicago and northern Illinois, southern Wisconsin and northwest Indiana. Branded as Chicago’s bank, its lending book is highly diversified with a low exposure (6%) to residential real estate, all else mostly being small commercial (sub US$1.5 million) suburban business loans, with downtown office commercial real estate being a small part. An additional Wintrust differentiator is that it owns 15 bank charters, providing FDIC coverage 15 times over for every customer, or up to US$3.75 million in total guaranteed deposit coverage. We believe Wintrust will gain market share as it further commercializes this service.

UMB Financial Corp. (UMBF US): UMB is a U.S.-licensed bank operating nationwide, with main branches throughout Missouri, Illinois, Colorado, Kansas, Oklahoma, Nebraska, Arizona and Texas. Its US$31 billion in deposits is only 20% exposed to the consumer market. Deposits are otherwise commercial (46%) and financial services (17%). The majority (54%) of its US$17 billion loan book is in commercial and industrial lending. UMB maintains a low loan-to-value ratio (currently at 59%). With a 54% loan-to-deposit ratio, UMB also remains at the low end of the 74% peer median.

As you can see, our investment process has led us to financial services companies and banks with differentiated offerings, competitive advantages and defendable barriers to entry. These specialty-focused organizations tend to operate outside of the core banking space where increased risk (from volatile and unpredictable deposits and loans) is taken to achieve return targets. We will continue to monitor the bank environment as well as the health of our bank investments through direct engagement.

Image of office skyscrapers with reflections in the sunlight

Connor, Clark & Lunn Funds Inc. (CC&L Funds) is excited to announce two absolute-return oriented portfolios in liquid alternative fund form, CC&L Global Market Neutral II Fund and CC&L Global Long Short Fund (the Funds).

CC&L Global Market Neutral II Fund seeks to earn a positive and attractive risk-adjusted return over the long term while demonstrating low correlation with, and lower volatility than, traditional equity markets. Risk rating: Low to Medium.

CC&L Global Long Short Fund seeks to provide long-term capital appreciation and attractive risk-adjusted returns by actively investing in a portfolio of long and short securities. Risk rating: Medium.

To manage the Funds, CC&L Funds has retained Vancouver-based Connor, Clark & Lunn Investment Management Ltd. (CC&L Investment Management), one of Canada’s largest privately-owned asset management firms, with close to 20 years of experience in managing alternative investment strategies for institutional investors.

“We have been told by our client base that they want access to institutional-caliber alternative investments, managed by a team with a demonstrated track record of success, in the convenience of a liquid alternative fund. By introducing these two new portfolios, we are meeting those objectives and providing investment advisors and their clients with two attractive risk & return profiles to choose from,” said Tim Elliott, President and CEO of CC&L Funds.

“We are excited that these alternative investment solutions are being made available to a broader group of individual Canadian investors. As we have transitioned into an environment with structurally higher interest rates and inflation, we expect market cycles to be shorter, volatility to be higher, and returns from conventional risk assets to be lower. In such an environment, we believe it will become more important for investors to incorporate sources of return that are independent of stock and bond markets to enhance portfolio outcomes,” said Martin Gerber, President and Chief Investment Officer at CC&L Investment Management.

Both CC&L Funds and CC&L Investment Management are affiliates of Connor, Clark and Lunn Financial Group (CC&L), whose multi-affiliate structure brings together the talents of diverse investment teams that offer a broad range of traditional and alternative investment solutions. CC&L is one of Canada’s largest independently owned asset managers, responsible for over $104 billion in assets on behalf of institutional and individual investors.

About the funds

Available in A and F Series, the Funds conform with the regulatory framework related to alternative mutual funds offered by Simplified Prospectus. The Funds are offered through licensed investment dealers, priced daily, with daily liquidity, and available through FundServ.

About Connor, Clark & Lunn Funds Inc.

Connor, Clark & Lunn Funds Inc. (CC&L Funds) partners with leading Canadian financial institutions and their investment advisors to deliver unique institutional investment strategies to individual investors through a select offering of funds, alternative investments and separately managed accounts.

By limiting the offering to a focused group of investment solutions, CC&L Funds is able to deliver unique and differentiated strategies designed to enhance traditional investor portfolios. For more information, please visit cclfundsinc.com.

About Connor, Clark & Lunn Investment Management Ltd.

Connor, Clark & Lunn Investment Management Ltd. (CC&L Investment Management) is one of the largest independent partner-owned investment management firms in Canada with $54.2 billion in assets under management. Founded in 1982, CC&L Investment Management offers a diverse array of investment services including equity, fixed income, balanced and alternative solutions including portable alpha, market neutral and absolute return strategies.

CC&L Investment Management is a part of Connor, Clark & Lunn Financial Group Ltd. (CC&L Financial Group), a multi-boutique asset management company whose affiliates collectively manage approximately $104 billion in financial assets. For more information, please visit cclinvest.cclgroup.com.

About Connor, Clark & Lunn Financial Group Ltd.

Connor, Clark & Lunn Financial Group Ltd. (CC&L Financial Group) is an independently owned, multi-affiliate asset management firm that provides a broad range of traditional and alternative investment management solutions to institutional and individual investors. CC&L Financial Group brings significant scale and expertise to the delivery of non-investment management functions through the centralization of all operational and distribution functions, allowing talented investment managers to focus on what they do best. CC&L Financial Group’s affiliates manage over $104 billion in assets. For more information, please visit cclgroup.com.

Contact

Lisa Wilson
Manager, Product & Client Service
Connor, Clark & Lunn Funds Inc.
416-864-3120
[email protected]

Eurozone February monetary data were extraordinarily negative, suggesting that interest rates were already at a restrictive level before the 50 bp rate hikes in February / March. 

Economic sentiment has lifted in early 2023 in response to a collapsing gas price and China’s reopening but the impact of monetary restriction has yet to kick in. 

The headline M3 broad money measure was down again in February and has fallen in four of the last five months. The six-month rate of change turned negative and is the weakest since 2010 in the aftermath of the GFC – see chart 1. 

Chart 1

Chart 1 showing Eurozone Broad Money M3 (% 6m)

Bank deposits are contracting at a faster pace than then because of a portfolio switch into money market funds and short-term bank bonds. This switch has been motivated by relative yields but the banking crisis could give a further boost to money fund inflows. 

Corporate money trends are particularly alarming. Bank deposits of non-financial corporations contracted at a 4.0% annualised pace in the latest three months, with the overnight (M1) component down by 16.6% – chart 2. Household deposits fell in February and are barely up over three months, with a shift out of overnight accounts suggesting weak spending intentions. 

Chart 2

Chart 2 showing Eurozone Household & NFC* Deposits (% 3m annualised) *NFCs = Non-Financial Corporations

Talk of households still sitting on substantial spendable “excess” savings is suspect. Allowing for inflation erosion, household M3 deposits are below their pre-pandemic trend – chart 3. 

Chart 3

Chart 3 showing Eurozone Real Household M3 Deposits (January 2003 = 100)

Country deposit data suggest that a core / periphery divergence is opening up, with Spain following Italy into year-on-year contraction – chart 4. 

Chart 4

Chart 4 showing Bank Deposits of Eurozone Residents* (% yoy) *Excluding Central Government

Monetary weakness partly reflects a collapse in credit growth: three-month loan momentum was running at an annualised 7.6% as recently as September but turned negative in February – chart 5. 

Chart 5

Chart 5 showing Eurozone Bank Loans* to Private Sector (% 3m annualised) *Adjusted for Sales, Securitisation & Cash Pooling

Corporations have been repaying short-term loans in size since November, consistent with a downswing in stockbuilding, which reached a record share of GDP in Q4. Numbers could bounce near term as firms draw down credit lines while they still can.

Downtown skyline of Toronto Canada at twilight.

Connor, Clark & Lunn Funds Inc., the manager of PCJ Absolute Return II Fund (the “Fund”) is pleased to announce a change to the liquidity terms of the Fund.

Effective immediately, Fund purchase, sale and switch orders will move from weekly at 4 pm Eastern Time on Fridays, to daily at 3 pm Eastern Time on each Business Day or before the TSX closes for the day, whichever is earlier, and all orders will be processed based on the net asset value calculated that day. Orders received after 3 pm Eastern Time will be processed on the next Business Day based on that day’s net asset value.

About Connor, Clark & Lunn Funds Inc.

Connor, Clark & Lunn Funds Inc. (CC&L Funds) partners with leading Canadian financial institutions and their investment advisors to deliver unique institutional investment strategies to individual investors through a select offering of funds, alternative investments and separately managed accounts.

By limiting the offering to a focused group of investment solutions, CC&L Funds is able to deliver unique and differentiated strategies designed to enhance traditional investor portfolios. For more information, please visit cclfundsinc.com.

Forward-Looking Information

This news release may contain forward-looking information (within the meaning of applicable securities laws) relating to the business and operations of the Manager and the Fund (“forward-looking statements”). Forward-looking statements may be identified by words such as “believe”, “anticipate”, “project”, “expect”, “intend”, “plan”, “will”, “may”, “estimate” and other similar expressions. The forward-looking statements in this news release are based on certain assumptions; they are not guarantees of future performance and involve risks and uncertainties that are difficult to control or predict. A number of factors could cause actual results to differ materially from the results discussed in the forward-looking statements, including, but not limited to, the factors discussed under the heading “What is a Mutual Fund and What Are the Risks of Investing in a Mutual Fund?” in the simplified prospectus available on the SEDAR profile of the Fund at www.sedar.com. There can be no assurance that forward-looking statements will prove to be accurate as actual outcomes and results may differ materially from those expressed in these forward-looking statements. Readers, therefore, should not place undue reliance on any such forward-looking statements. Further, these forward-looking statements are made as of the date of this news release and, except as expressly required by applicable law, the Manager and the Fund assume no obligation to publicly update or revise any forward-looking statement, whether as a result of new information, future events or otherwise.

Contact

Lisa Wilson
Manager, Product & Client Service
Connor, Clark & Lunn Funds Inc.
416-864-3120
[email protected]

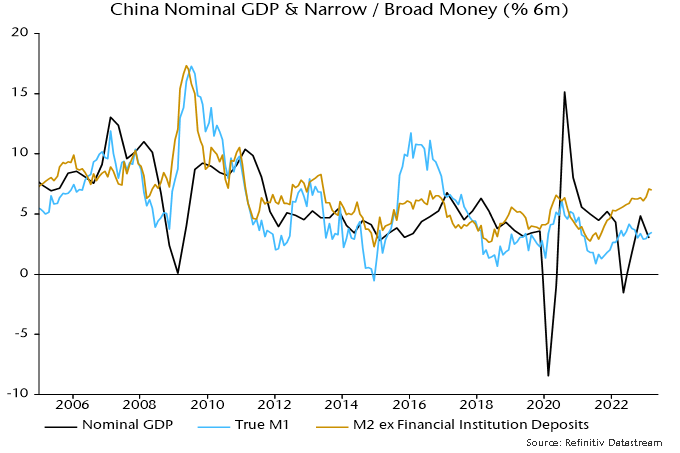
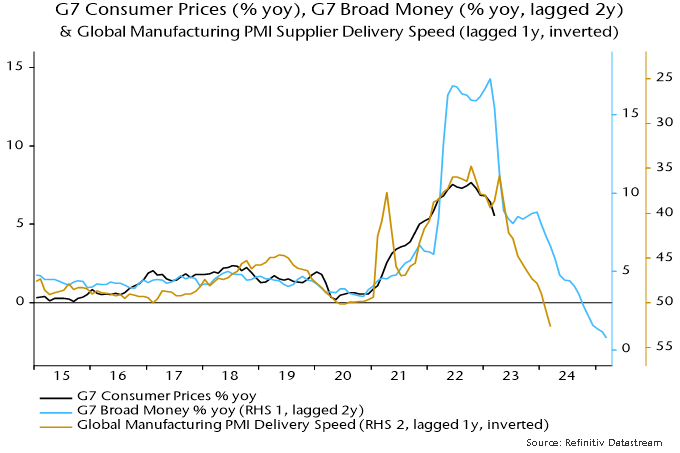
Current monetary stagnation implies that policy-makers’ worries about a sustained inflation overshoot are as misplaced as their deflation panic in 2020 when money growth was surging.

UK annual broad money growth peaked in February 2021. It should be no surprise that annual inflation was still riding high in February 2023, based on the “monetarist” understanding of a roughly two year lead. 

Annual money growth, however, collapsed after February 2021. Non-financial M4 rose by 2.4% in the year to January and by only 0.9% annualised in the latest three months. 

A consensus concern is that a coming inflation decline will fail to return it to target – one informed commentator expects stickiness at about 4%. No explanation is offered of how such a scenario is compatible with barely growing broad money. Is velocity expected to pick up, against its long-term downtrend? Or is 4% inflation projected to coexist with economic contraction of 3% pa – the implication if money growth runs at 1% pa and velocity is stable? 

The collapse in annual money growth closely resembles a decline over 1990-93, following which annual core RPI inflation fell below 2% in H2 1994, consistent with a core CPI rate (unavailable then) of about 1% – see chart 1. 

Chart 1

Chart 1 showing UK Core Consumer / Retail Prices & Broad Money (% yoy)

The push-back to a similar scenario now is that the unemployment rate is much lower than at the start of the 1990-92 recession. Average earnings growth, however, was significantly higher then – the annual increase in total pay was above 10% (three-month moving average) when the recession started versus below 6% now. Private pay momentum is already slowing despite limited labour market cooling to date – chart 2. 

Chart 2

Chart 2 showing UK Average Weekly Regular Earnings (% 6m annualised)

The 1991-1994 inflation plunge, moreover, occurred despite upward pressure on import prices from a 12% drop in the effective exchange rate between 1990 and 1993 (calendar year averages). There is no such currency headwind to an inflation decline now. 

Annual core CPI inflation rose in February but three-month momentum remains well down from its May 2022 peak – chart 3. Commodity prices signal a coming slowdown in food inflation – chart 4 – while energy prices will soon be falling year-on-year. The February inflation result is irrelevant for assessing 2024-25 prospects and the MPC should ignore it. 

Chart 3

Chart 3 showing UK Core Consumer Prices ex Policy Effects* *Ex Energy, Food, Alcohol, Tobacco & Education Adjusted for VAT Changes

Chart 4

Chart 4 showing UK Producer Input Prices of Imported Foods & FAO Food Price Index (% yoy)
Selamat Datang Monument in central Jakarta, Indonesia.

We believe emerging markets (EMs) offer a multitude of benefits to equity investors, including: 

  • High growth potential. EMs typically follow rapid economic growth trajectories, which can be reflected in the performance of companies operating within these markets. 
  • Undervalued quality assets. EMs are home to many high-quality companies not yet recognized by the broader investment community. As these companies grow, they gain awareness and appreciate. 
  • Diversification. Investing in EMs can help diversify portfolios concentrated in more developed markets, enhancing their risk-return profile. 
  • Favourable demographics. Most EMs have young and growing populations that can drive economic growth and provide opportunities for companies catering to these markets. 

Small-cap (SC) companies can often have significantly more room for growth than their larger peers, as they launch new products and expand into new markets, providing substantial upside potential. Also, because they are typically less known outside of their domestic market and inadequately covered by sell-side analysts, they can present “hidden gem” opportunities that the market maybe be overlooking. The EM SC investable universe comprises over 11,000 companies offering a wide variety of investment ideas across 24 countries and 11 sectors. 

For a company to be included on our shortlist, it must be run by an outstanding management team and have a sustainable competitive advantage and defined growth strategy within what we believe is an attractive market. Although we are bottom-up investors, we are also macro aware and acknowledge secular investment themes in the EM middle-class consumer space. Notably, EM countries have nearly four times the middle-income households as their developed market counterparts.  

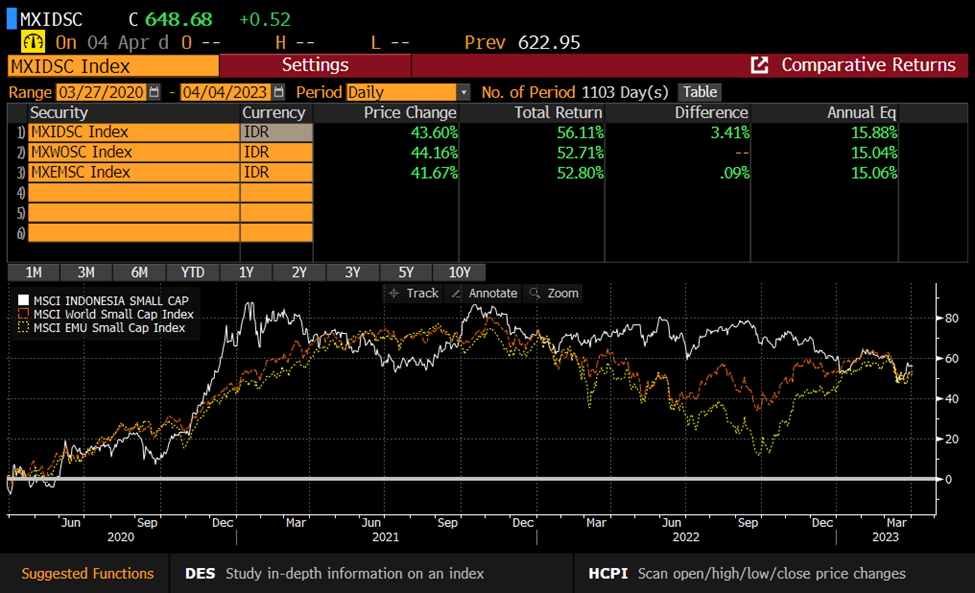
Indonesia, which we last wrote about in August 2021, is the largest economy in Southeast Asia, the world’s fourth most populous country and home to more than 50 million consumers in the middle-income bracket. Amid gloomy economic projections for many countries globally, Indonesia is expected to experience only a mild slowdown and actually grow 4.8% in 2023. Its economy is supported by strong exports, investment (with foreign direct investment having consistently posted new records every quarter last year) and household spending (being the most significant GDP contributor). Even with the possibility of a global recession and a tight global financial environment threatening Indonesia’s momentum, our view is that companies with sustainable business models, pricing power and appealing product offerings can nevertheless extract meaningful benefits. We believe that one of our Emerging Markets Small Cap portfolio’s core holdings offers the best exposure to Indonesia’s middle-income consumers.

Business overview

Mitra Adiperkasa (MAPI IJ) is Indonesia’s leading multi-format lifestyle retailer catering primarily to middle- and high-income earners. Since its establishment in 1995, the company has managed to build a diversified portfolio of franchise agreements with more than 150 world-class brands (e.g., Zara, Marks & Spencer, Footlocker, Converse, Starbucks, Subway, Krispy Kreme, Tissot, Pandora, Sephora, Samsonite). Mitra Adiperkasa has cultivated long-term relationships with its principals and secures exclusive rights from virtually all brands it partners with. Supported by a veritable army of 23,000 employees, the company runs an omnichannel network of nearly 3,000 physical and 20 online stores. In 2016, Mitra Adiperkasa started its overseas expansion venturing into Vietnam, followed by the Philippines in 2020, and Malaysia and Singapore in 2022.

Competitive advantages

  • Diversified portfolio of exclusive brands and long-term relationships with principals.  
  • Unmatched scale and store network. 
  • Strong reputation and track record of execution. 
  • Focus on target customers with resilient purchasing power. 
  • Solid balance sheet with net cash position. 

Growth strategy

  • Same-store sales growth and store network expansion, with a focus on higher-profit specialty stores. 
  • Addition of new brands and optimization of existing ones. 
  • Expansion in Vietnam, the Philippines and Malaysia. 

A combination of target demographics with more resilient purchasing power, a diverse portfolio of exclusive brands and a robust omnichannel strategy in our view make Mitra Adiperkasa one of the best-positioned consumer companies in the EM SC universe.

Lending by the Fed to depository institutions jumped from $15 billion to $318 billion between 8 and 15 March – see chart 1 (red line). The emergency loans – mostly via the discount window and via the FDIC rather than under the new Bank Term Funding Program – were the main driver of a $441 billion surge in banks’ reserves at the Fed. 

Chart 1 

Chart 1 showing US Federal Reserve Balance Sheet ($ bn)

These developments do not represent an easing of monetary conditions, except relative to a much tighter baseline that would have resulted from the Fed failing to accommodate increased demand for monetary base due to the banking crisis. 

  • Unlike QE, Fed lending to the banking system has no direct impact on money stock measures (i.e. money held by households and non-bank firms). (QE has an impact to the extent that securities are purchased from non-banks.) 
  • Unlike QE, the reserves rise is temporary and will reverse if the crisis abates and lending is repaid. 
  • The emergency / temporary nature of the lending / reserves rise implies no incentive for banks currently experiencing inflows to expand assets. (QE can have secondary monetary effects by encouraging lending / securities purchases.) 

Resolution of the crisis requires the authorities to arrest broad money contraction. A run-down of the Treasury’s cash balance at the Fed won’t be sufficient; QT needs to be suspended / reversed to offset a cutback in lending by troubled banks. Consideration should also be given to limiting the drain of deposits to money funds, e.g. by capping their access to Fed’s overnight reverse repo facility.

L.F. Wade International Airport

Connor, Clark & Lunn Infrastructure (CC&L Infrastructure) today announced the acquisition of a 49.9% minority interest in Bermuda Skyport Corporation Limited (Skyport) from Aecon Group Inc. (Aecon), the concessionaire for the L.F. Wade International Airport (the Bermuda International Airport). Aecon is a leading Canadian construction and infrastructure development company, which will continue as majority owner and operator of the airport. The purchase price for the acquired interest is USD$128.5 million, and the transaction remains subject to a number of closing conditions which the parties expect will be satisfied in the coming weeks.

The Bermuda International Airport provides sole aviation access to the island for both international travelers and Bermudians alike. This modern, world class airport with a new state-of-the-art passenger terminal building is supportive of Bermuda’s growing tourism industry and its status as a global financial center. The facility was constructed with environmentally efficient lighting, cooling, and wastewater systems, and was built to withstand extreme weather conditions common to island nations.

The redevelopment of the Bermuda International Airport was completed in 2020 under a concession agreement between Skyport, a wholly-owned subsidiary of Aecon, and the Bermuda Airport Authority. Skyport is responsible for the operation, maintenance, and commercial functions of the airport and coordinates the overall airport redevelopment project under the concession agreement, which has 24 years remaining on its original 30-year term.

“We are excited to expand to a new sector and geography with the addition of this interest in a world-class airport,” said Matt O’Brien, President of CC&L Infrastructure. “This investment is consistent with our strategy of investing in high-quality, long-duration assets in creditworthy jurisdictions. The L.F. Wade International Airport is an excellent example of a resilient, durable asset with potential for growth as passenger traffic recovers in the wake of COVID-19 – providing an attractive complement to our existing, well-diversified portfolio of infrastructure assets.”

“We believe that Bermuda is a strong jurisdiction for investment and are excited to be partnered with Aecon and the team at Skyport in the delivery of a high-quality airport offering to the people and Government of Bermuda,” added Ryan Lapointe, Managing Director of CC&L Infrastructure. “As a long-term investor, we look forward to working with our partners at Aecon and the Government of Bermuda in the continued successful operation of the Bermuda International Airport for many years to come.”

CIBC Capital Markets is serving as exclusive financial advisor and Torys LLP is serving as legal counsel to CC&L Infrastructure on the transaction.

About Connor, Clark & Lunn Infrastructure

CC&L Infrastructure invests in middle-market infrastructure assets with attractive risk-return characteristics, long lives and the potential to generate stable cash flows. To date, CC&L Infrastructure has accumulated over $5 billion in assets under management diversified across a variety of geographies, sectors, and asset types, with over 90 underlying facilities across over 30 individual investments. CC&L Infrastructure is a part of Connor, Clark & Lunn Financial Group Ltd., a multi-boutique asset management firm whose affiliates collectively manage more than CAD$100 billion in assets. For more information, please visit www.cclinfrastructure.com.

Contact

Vrushabh Kamat
Connor, Clark & Lunn Infrastructure
(437) 928-5184
[email protected]

TORONTO, ON, March 14, 2023 – Crestpoint Real Estate Investments Ltd. (Crestpoint) today announced the acquisition of a new industrial property, Coastal Heights Distribution Centre.

This newly constructed 428,000 square foot facility features best-in-class industrial warehouse characteristics including a clear height of 36 feet, 49 dock doors accessed through a secured loading courtyard, an efficient layout, excellent ingress, and egress provided through four access points, and ample parking. Situated on a 19 acre site in the Campbell Heights industrial area in Surrey, B.C., the property is strategically located near several key highway series and provides easy access to the Canada-U.S. border. The building is 100% leased for 10 years to a Fortune 500 company. Crestpoint acquired a 100% interest in the property on behalf of the Crestpoint Core Plus Real Estate Strategy, its open-end Fund, along with two institutional clients of Crestpoint’s.

The closing of this acquisition brings Crestpoint’s total assets under management to over $9.7 billion and 36.0 million square feet.

About Crestpoint

Crestpoint Real Estate Investments Ltd. is a commercial real estate investment manager dedicated to providing investors with direct access to a diversified portfolio of commercial real estate assets. Crestpoint is part of the Connor, Clark & Lunn Financial Group, a multi-boutique asset management company that provides investment management products and services to institutional and high net-worth clients. With offices across Canada and in Chicago, London, and Gurugram, India, Connor, Clark & Lunn Financial Group, and its affiliates are collectively responsible for the management of approximately $104 billion in assets. For more information, please visit: www.crestpoint.ca.

Contact

Elizabeth Steele  
Director, Client Relations  
Crestpoint Real Estate Investments Ltd.  
(416) 304-8743  
[email protected]

A welder working on steel plates.

Summary

Emerging market equities fell in February (the MSCI EM Index was down 6% in USD terms) as investors took profits in China, and with strong wage, consumption and services data in the U.S. fuelling fears of persistent inflation and risks that the US Federal Reserve would press on with monetary tightening for longer than anticipated. This supported a modest bounce back in the dollar after a sharp decline through Q4 last year, which was an added headwind for EM.

The reopening trade was the catalyst for the biggest rebound for Chinese equities outside of the Global Financial Crisis. Higher beta H-share names were beneficiaries of extreme flows buying into laggards. These stocks were softer through February, with Alibaba and China Education Group leading portfolio detractors.

We wrote last month that A-shares across a number of sectors were attractive given their underperformance relative to H-shares since November. Despite posting slightly negative returns in February, it was pleasing to see A-share names like heavy equipment maker Sany Heavy, industrial automation leader Shanghai Baosight, and Spring Airlines post positive relative performance at the country level.

Investors are now looking to the two sessions in March, namely the National People’s Congress and the Chinese People’s Political Consultative Conference, for major announcements and key government appointments to gauge policy direction. Brazil and Saudi Arabia continued to underperform with South Africa joining them, reflecting our view that poor global liquidity data signals a deteriorating economy that is set to drag on more cyclical markets. Reopening in China will not match the boom we saw in the West as monetary and fiscal policy remains conservative. Weak global demand will also weigh on China’s export markets. Therefore, while we are encouraged by the recovery in China’s economic activity, we are not playing derivatives of the reopening through commodities.

Modi silent on Adani

Last month we flagged that the fallout from allegations of fraud and stock manipulation levelled against the Adani Group would test India’s ascent up the development ladder. Prime Minister Narendra Modi has been the driving force for a number of crucial reform initiatives, including the electrification of poor villages, providing better sanitation in rural areas, the introduction of a bankruptcy code, a nationwide goods and services tax, and establishing digital land records and biometric identification which together underpin a virtuous circle of development. With general elections approaching in 2024, it was hard to see how Modi would lose, particularly given weak and fragmented opposition.

The fallout from Hindenburg’s short report on the Adani Group presents a key test for PM Modi, as his rise, along with that of Adani and India itself are in many ways intertwined. Modi forged his reputation as a pro-business Chief Minister of the Gujarat province in the early 2000s, with rapid economic modernisation and growth propelling rising industrialists such as Adani to the forefront of India’s growth story. As Modi rose to the office of PM, Adani was a key supporter and beneficiary of the government’s nation-building plans, enabling him to build an industrial empire across ports, power plants, resources, renewable energy and airports. India’s opposition parties, who have accused Modi of crony capitalism through helping Adani secure lucrative projects across a host of sectors, have seized on the report as evidence of corruption. Modi on the other hand has kept quiet while his spokespeople characterise the accusations as an attack by elites in Congress and the media on the BJP’s pro-growth agenda. Our view at this early stage is that the risks appear unlikely to be systemic. Hindenburg’s report outlines what looks to be a stock “ramp,” with shell entities buying up stock to lock up free float while hiding this from index providers. Ostensibly meeting liquidity and market-capitalisation requirements enabled index inclusion with a disproportionately large weighting for thinly traded Adani stocks, which was in turn fuel for a massive rally across the Adani Group. While high debt levels are a concern, the collateral tied to many of the loans are high-quality infrastructure assets, with state banks and foreign lenders bearing much of the counterparty risk. Should fallout be contained, the controversy could present a buying opportunity in some of our favoured names while encouraging better corporate governance in India.

Globalisation is not over

While globalisation is clearly changing, we can’t see it reversing. China’s export machine continues to power ahead, while developed countries wisely diversify supply chains to the benefit of other rising export players such as Vietnam, Indonesia and India. Indeed, the combination of incredibly tight labour markets in the West (the U.S. in particular) and extremely cheap real effective exchange rates across a number of emerging markets make these countries incredibly attractive investment destinations in our view. Real effective exchange rates incorporate relative levels of inflation and “trade weights” to account for a country’s largest trading counterparties. As per the following chart, some EMs are more competitive than they have been for a decade or more.

Real Effective Exchange Rate

Chart showing the real effective exchange rate of emerging markets from 2010 to 2022.

Source: Refinitiv Datastream

Chinese EVs are beginning to go global

Leading Chinese electric vehicle (EV) stocks have been sold heavily over the past 12 months, with the pandemic disrupting supply chains and sapping consumer demand. Premium EV manufacturers were hit particularly hard as sentiment soured on reports of missed delivery targets in late 2022, along with a soft outlook for the next quarter or so. Despite the setbacks, the industry’s long-term prospects remain bright. The core investment case revolves around the following factors:

  • EVs are approaching purchase-cost parity with internal combustion vehicles (ICEs); 
  • a long runway for EVs to take share from ICEs;
  • increasing battery density and longer-range;
  • build out of charging infrastructure; and
  • domestic EV players successfully positioning themselves as leading premium brands in China.

What makes this a particularly attractive opportunity is the potential for Chinese EV companies to scale up in a continental-sized market. As this plays out, industry leaders will emerge within China that possess the scale and technology to go global and potentially dominate foreign markets. This is starting to play out now from a low base, with China becoming a net exporter of autos for the first time in 2022, led by EV manufacturers (HSBC Research, February 2023).

Share of NEVs as a % of China passenger vehicle exports

Source: CAAMM, QIANHAI Securities

2022 global EV volume mix

Source: EV-Volumes, HSBC Qianhai Securities

China exported 2.5 million EVs in 2022, up 57% year-on-year. Chinese brands are in the early stages of establishing themselves in foreign markets (particularly in Europe), which are less competitive than China. While a compelling story, investors need to keep expectations in check. It is likely to take years for Chinese EV players to build meaningful traction through increased brand familiarity, localising some production and distribution as well as navigate growing protectionism. If brands like NIO and BYD can manage these risks, they will be set to challenge foreign rivals by drawing on the largest EV production market in China and the strongest battery supply chain globally.