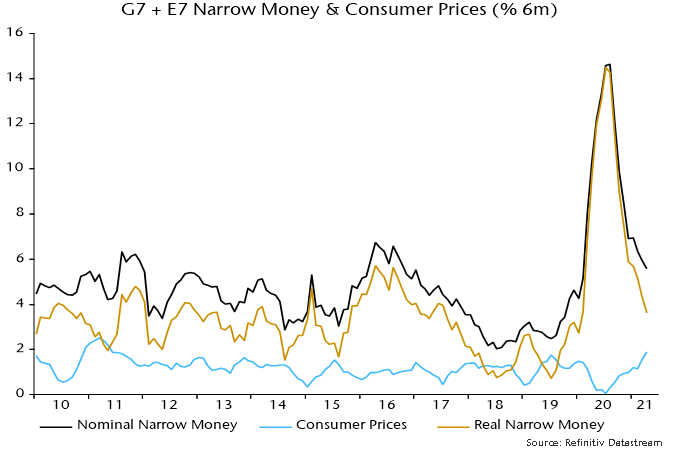
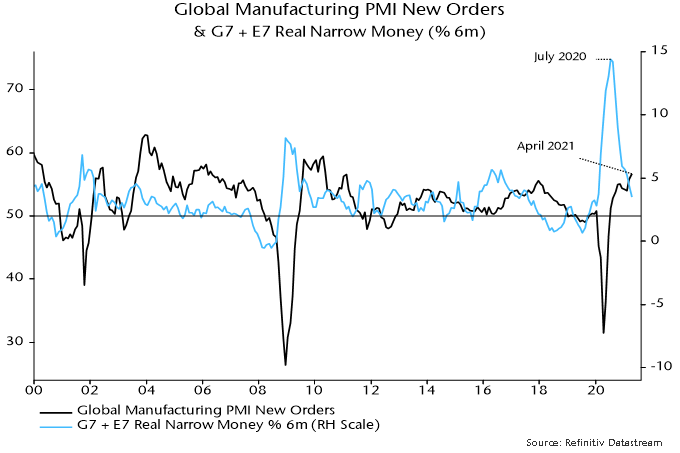
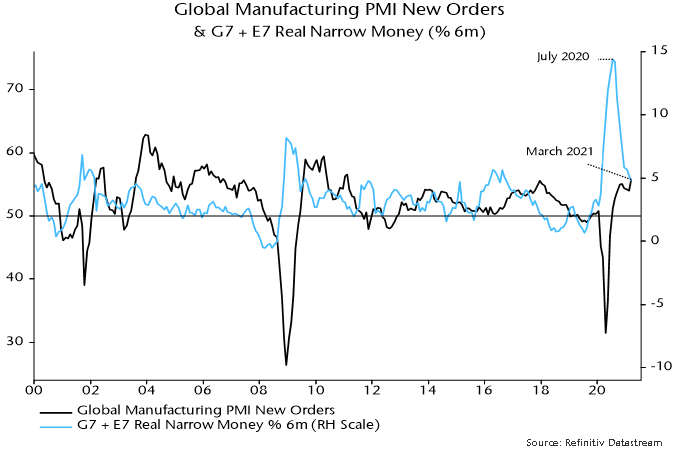
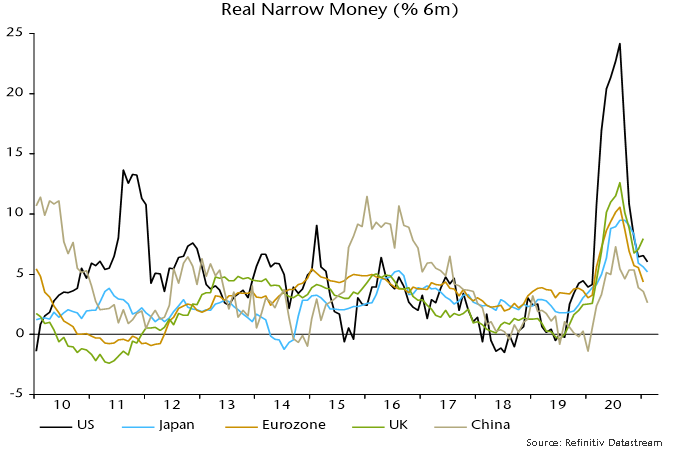
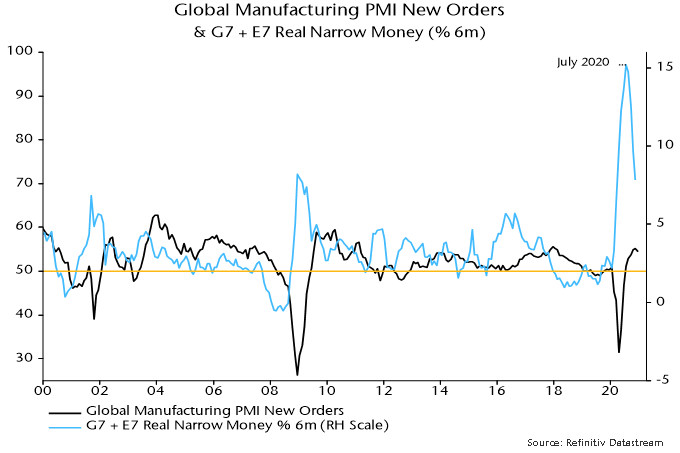
Additional country releases in recent days confirm that global six-month real narrow money growth fell further in April, to its slowest pace since January 2020 – see chart 1. The decline from a peak in July 2020 is the basis for the forecast here of a significant cooling of global industrial momentum during H2 2021.
Chart 1
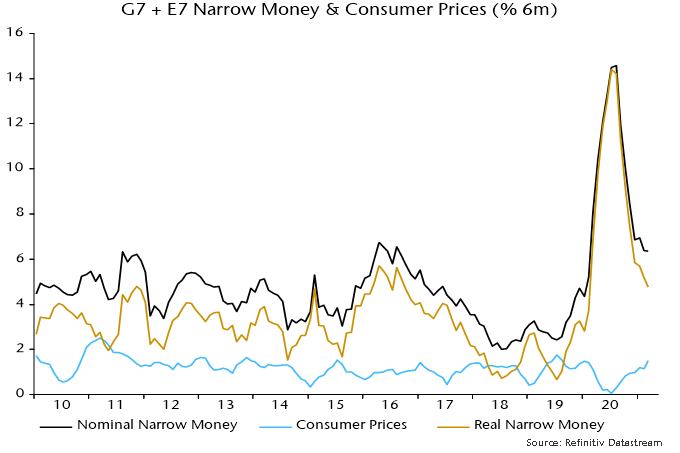
The April fall reflected both slower nominal money growth and a further pick-up in six-month consumer price momentum – chart 2. The latter is probably at or close to a short-term peak and the central scenario here remains that real money growth will stabilise and recover into Q3. The risk is that nominal money trends continue to soften – the boost to US numbers from disbursement of stimulus payments may be over and this year’s rise in longer-term yields may act as a drag.
Chart 2
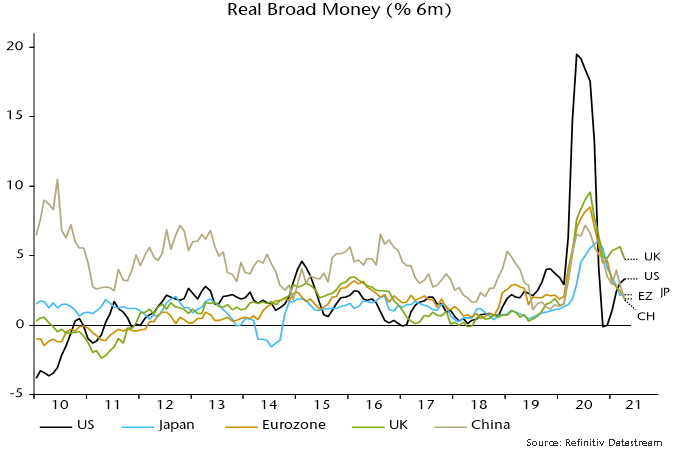
Six-month growth of real broad money and bank lending also moved down in April, with the former close to its post-GFC average and the latter considerably weaker – chart 3. Forecasts last year that government guarantee programmes would lead to a lending boom have so far proved wide of the mark; monetary financing of budget deficits, mainly by central banks, remains the key driver of broad money expansion.
Chart 3
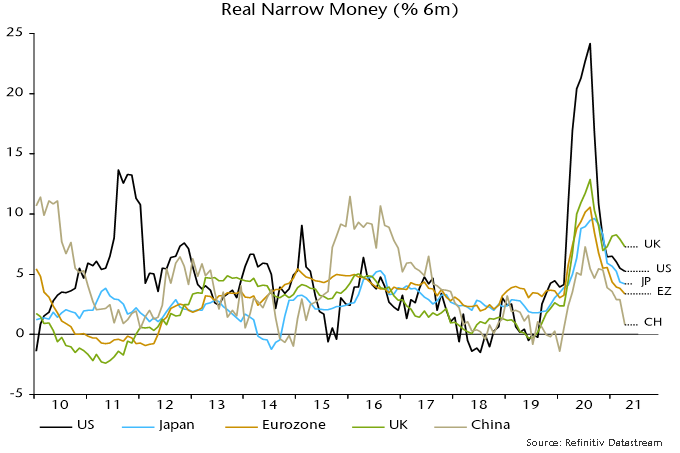
Charts 4 and 5 shows six-month growth rates of real narrow and broad money in selected major economies. The UK remains at the top of the range on both measures, supporting optimism about near-term relative economic prospects, although slowing QE and a sharp rise in inflation promise to erode the current lead.
Chart 4
Chart 5
Eurozone real money growth, by contrast, is relatively weak: monetary deficit financing has been on a smaller scale than in the US / UK, while six-month inflation is higher than in the UK / Japan. Bank lending has been expanding at a similar pace in the Eurozone and UK. The recent step-up in ECB PEPP purchases could lift Eurozone broad money growth although the change is modest and could be offset by an increased capital outflow – see previous post.
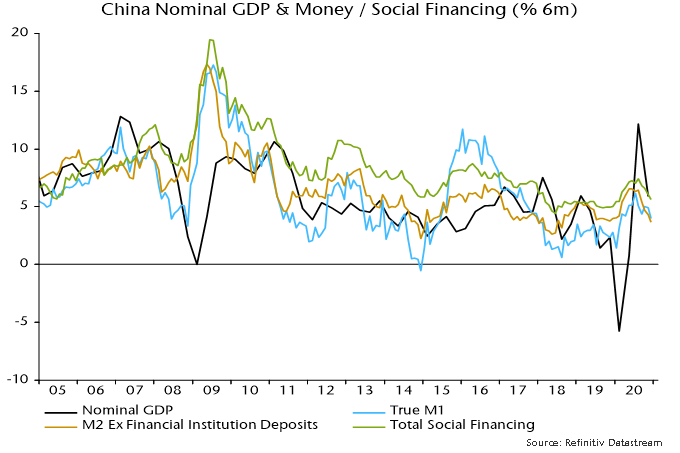
China remains at the bottom of the ranges and monetary weakness was expected here to trigger PBoC easing by mid-year. Policy shifts usually proceed “under the radar” via money market operations and directions to state-run banks. The managed decline in three-month SHIBOR continued this week, while the corporate financing index in the Cheung Kong Graduate School of Business survey stabilised in April / May after falling over October-March, which could be a sign that banks have been instructed to increase loan supply.
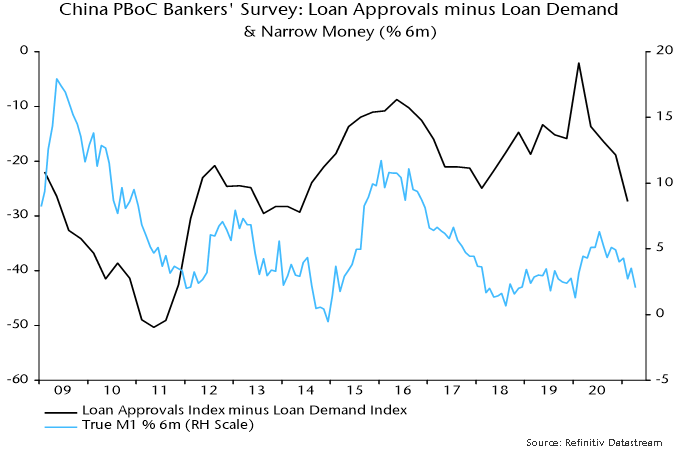
The PBOC’s quarterly bankers’ survey, due for release later this month, could provide further corroboration of a policy shift: the differential between loan approval and loan demand indices leads money growth swings – chart 6. Monetary reacceleration in China remains the most likely driver of a rebound in global six-month real narrow money growth – required to support a forecast that H2 industrial cooling will represent a pause in an ongoing upswing rather than a foretaste of more significant weakness in 2022.
Chart 6
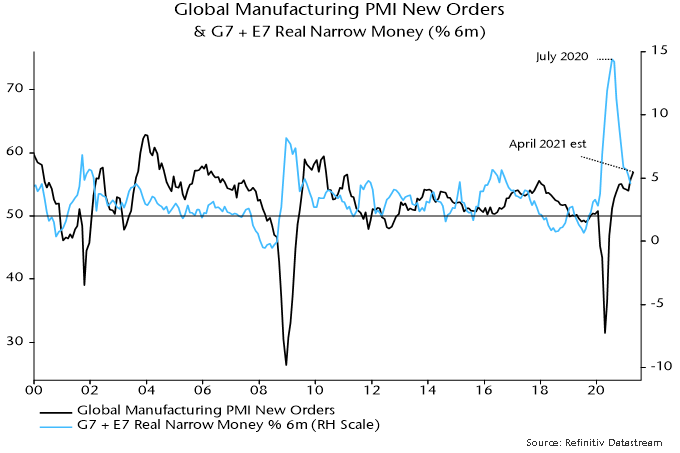
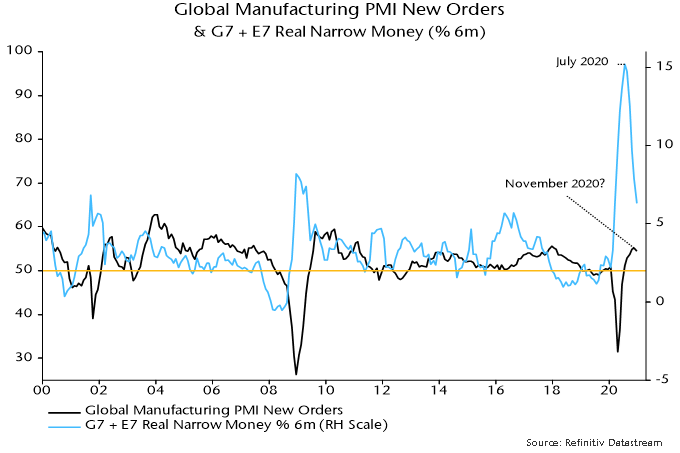
The forecast here remains that global industrial momentum, as measured by the manufacturing PMI new orders index, is at or close to a peak, with a multi-month decline in prospect.
The basis for the forecast is a fall in global six-month real narrow money growth from a peak in July 2020 – the rise into that peak is judged to correspond to the increase in PMI new orders to an 11-year high in April.
Available April monetary data indicate that real narrow money growth fell further last month, suggesting that the expected PMI decline will extend into late 2021 – see chart 1.
Chart 1
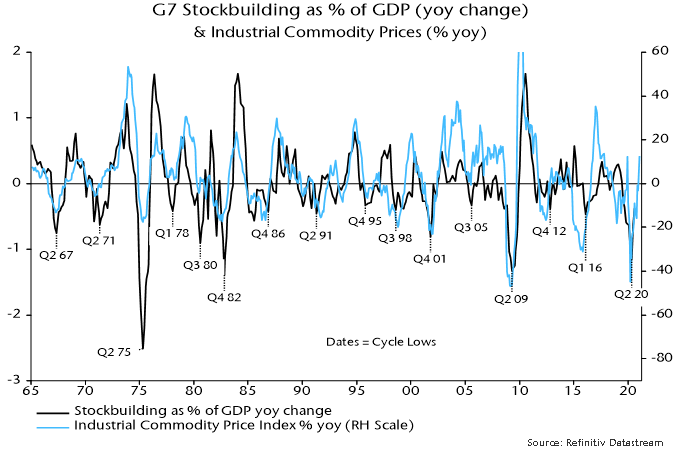
The presumption here is that PMI weakness will be modest, partly reflecting a view that the global stockbuilding cycle will remain in an upswing through H2. The cycle has averaged 3.5 years historically and bottomed in Q2 2020, suggesting a peak in Q1 2022 assuming an upswing of half-cycle length. Large declines in PMI new orders (i.e. to 50 or below) have usually occurred during cycle downswings.
Any PMI pull-back, however, could have significant market implications given consensus bullishness about global economic prospects.
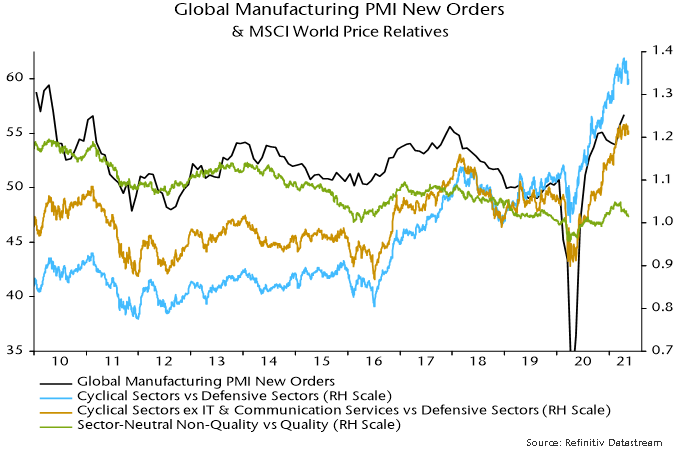
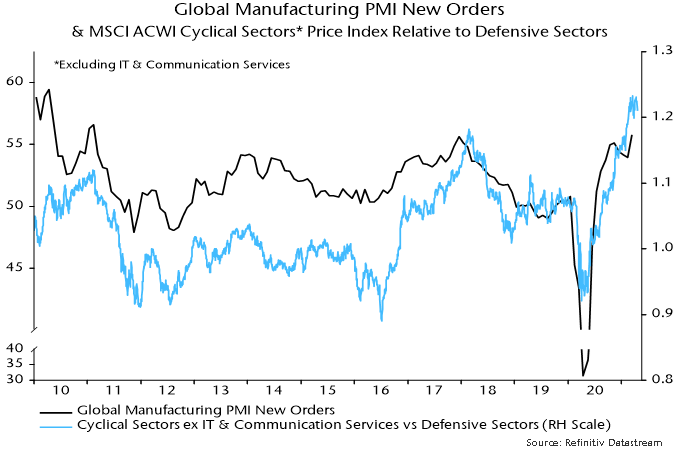
Historically, a declining trend in global manufacturing PMI new orders has been associated with underperformance of cyclical equity market sectors and outperformance of quality stocks within sectors. The price relative of MSCI World cyclical sectors to defensive sectors peaked in mid-April, falling to a three-month low last week – chart 2.
Chart 2
The decline has been driven by a correction in tech – the MSCI cyclical sectors basket includes IT and communication services. The price relative of non-tech cyclical sectors to defensive sectors has moved sideways since March.
The MSCI World sector-neutral quality index, meanwhile, has recovered relative to the non-quality portion of MSCI World since March, following underperformance in late 2020 / early 2021 when cyclical sectors were outperforming strongly.
Equity market behaviour, therefore, appears to have started to discount a PMI roll-over, although confirmation is required – in particular, a breakdown in the price relative of MSCI World non-tech cyclical sectors to defensive sectors.
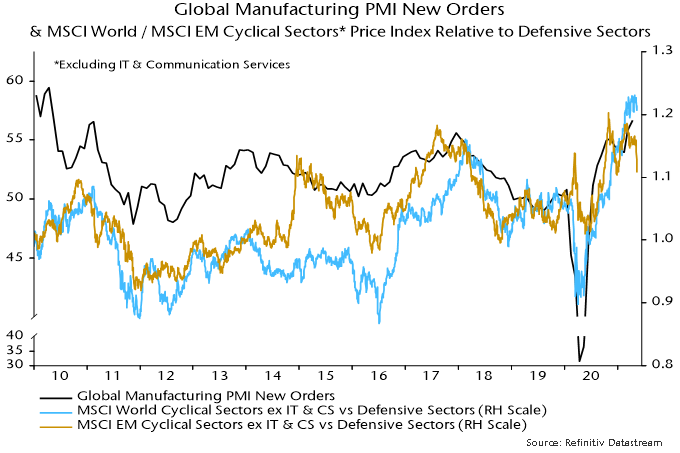
A sign that this could be imminent is a recent sharp fall in the non-tech cyclical to defensive sectors relative in emerging markets – chart 3. A possible interpretation is that the decline reflects worsening Chinese economic prospects, with China likely to be a key driver of a global slowdown. Early Chinese monetary policy easing may be required to mitigate this drag and lay the foundation for a resumption of cyclical outperformance.
Chart 3
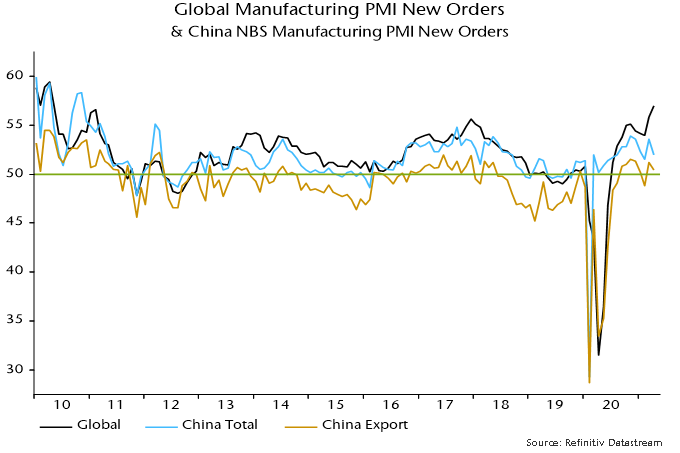
The forecast here at the start of the year was that the global manufacturing PMI new orders index – a key indicator of industrial momentum – would reach a peak in early 2021 and fall into the summer. The index declined slightly between November and February but rose to a new recovery high in March, with flash data last week and today’s Chinese results indicating a further significant increase in April. What has gone wrong?
The expectation of an early 2021 peak and subsequent relapse was based on a fall in global six-month real narrow money growth from an extreme peak in July 2020 – real money growth has led turning points in PMI new orders by 6-7 months on average historically. Six-month real narrow money momentum continued to weaken into March, so the monetary signal for PMI direction remains negative – see first chart.
Chart 1
There was meaningful variation around the 6-7 month historical average lead time. An April PMI new orders peak, were it to be confirmed, would imply a nine-month lead, which would be within one standard deviation of the average. So the further rise into April is not yet an unusual departure from the norm.
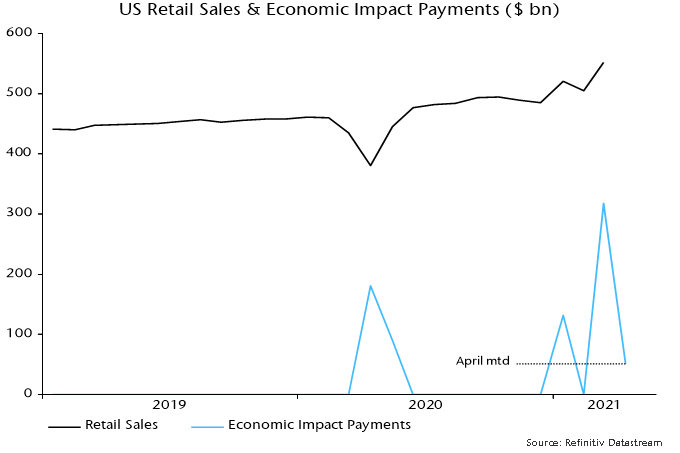
The most likely explanation is that the PMI upswing has been extended by US fiscal stimulus – particularly the third round of payments to households – along with initial moves towards economic reopening in the US, UK and other countries showing progress in virus containment. A 9.3% monthly surge in US retail sales in March may have been a key driver of stronger March / April new orders.
“Economic impact payments” authorised by the American Rescue Plan Act were $318 bn in March and $51 bn through 28 April for a total $369 bn, representing the bulk of a programme costed at $411 bn by the Congressional Budget Office.
New York Fed analysis of data collected in its monthly survey of consumer expectations indicates that households have spent or plan to spend 25% of the windfall, similar to the proportion in the first and second rounds, with remainder used to increase savings (42%) or pay down debt (34%). Rounding the $369 bn received to date up to $400 bn, this suggests additional consumer outlays of about $100 bn.
Assume that half of this amount is spent on goods, which could be an overestimate given that services account for two-thirds of total consumption. That would suggest additional retail sales – a rough proxy for goods spending – of about $50 bn. Monthly sales jumped by $47 bn between February and March. The suggestion is that the bulk of the boost to goods spending has already occurred and sales will fall back sharply into the summer.
Chart 2
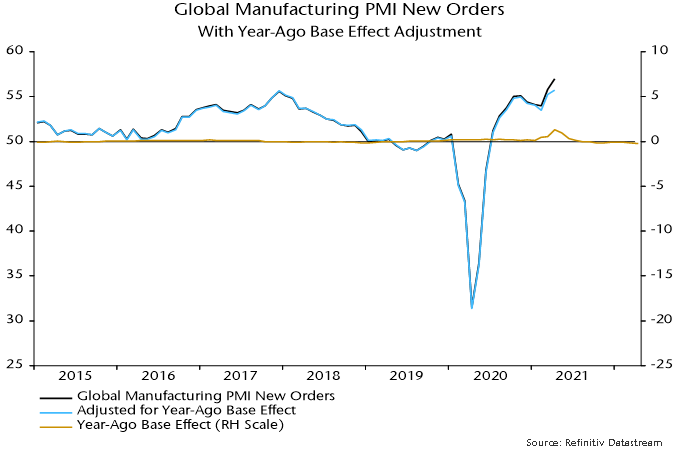
An additional technical explanation for the March / April rise in PMI new orders is a positive base effect from the slump in the index to a low in April 2020. Survey respondents are asked to draw a comparison with the previous month but there is evidence that some replies take into account the level of business in the same month a year earlier – understandable in cases where there is a strong seasonal pattern in demand.
Specifically, a regression of the global manufacturing PMI new orders index on its one- and 12-month lagged values finds a small but statistically significant negative coefficient on the latter*. The coefficient suggests that a 13.7 point plunge in the index in March / April 2020 contributed 0.8 of a point to the estimated 3.0 point increase in March / April 2021 – third chart. This boost will reverse by June, reflecting the recovery in the index after April last year.
Chart 3
With global real narrow money growth still moderating, the US fiscal boost probably passing its maximum and China still on a slow growth path pending PBoC easing, the forecast here of a PMI pullback through late Q3 is maintained.
Chart 4
*The same result is obtained using US ISM manufacturing new orders data over a much longer sample.
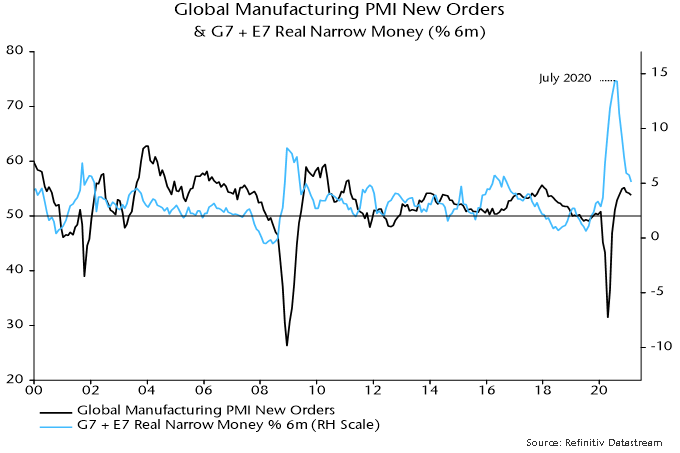
Global six-month real narrow money growth appears to have edged lower in March, continuing a downtrend since last summer. This suggests that an expected relapse in global industrial momentum will extend through late Q3 / early Q4.
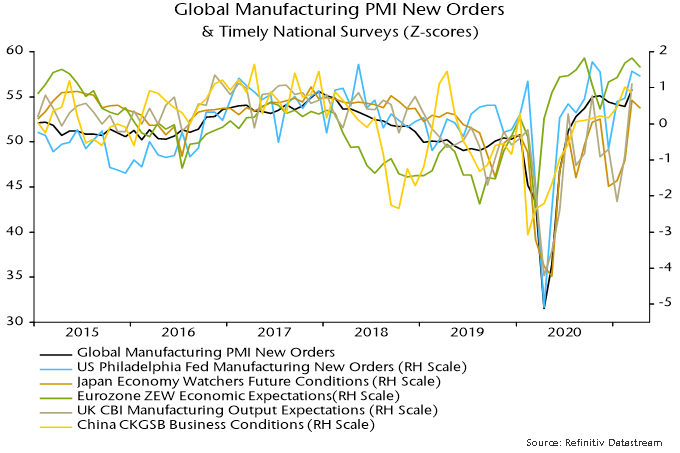
The global manufacturing PMI new orders index reached a new recovery high in March, consistent with a surge in six-month real narrow money growth into July / August 2020, allowing for the historical average 6-7 month lead time. More recent national surveys hint that March will mark a top – see chart 1.
Chart 1
The March real money growth estimate is based on information for the US, China, Japan, India and Brazil, together accounting for 70% of the G7 plus E7 aggregate tracked here. The US component is estimated from weekly data on currency in circulation and commercial bank deposits – official March money numbers are released next week and the Fed no longer provides weekly updates.
Global six-month real narrow money growth appears to have eased further to its lowest level since February 2020, reflecting stable nominal growth and another rise in six-month CPI inflation – charts 2 and 3.
Chart 2
Chart 3
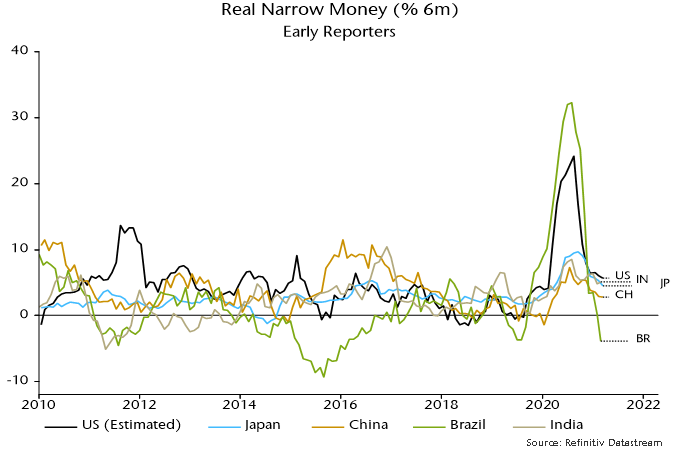
Chart 4 shows the early reporting countries individually. US six-month real narrow money growth is estimated to have edged lower despite disbursement of $318 bn of stimulus payments to households – these were made in the second half of the month and may have a larger impact in April (the money numbers are month averages).
Chart 4
Six-month growth also eased slightly further in Japan and China, with a small rise in India. Brazil moved into contraction although this needs to be placed in the context of an extraordinary surge last summer – 12-month growth is still strong.
Markets could be starting to offer corroboration of the scenario of a global manufacturing PMI new orders peak and pull-back, with Treasury yields stalling and equity market cyclical sectors no longer outperforming – chart 5.
Chart 5
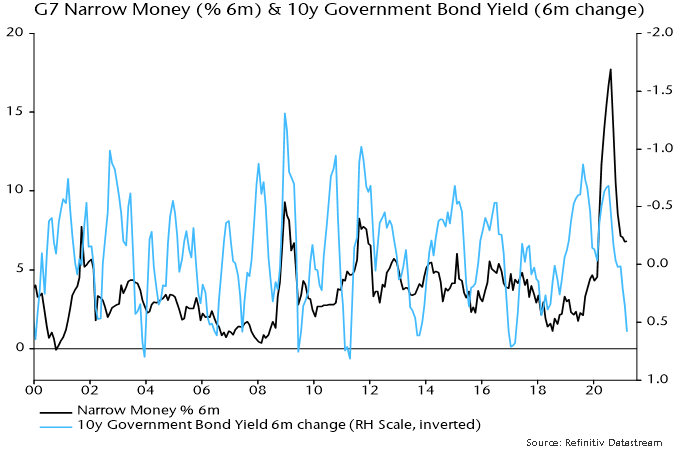
Will global six-month real narrow money growth recover? Six-month CPI inflation is likely to rise slightly further in April / May but could fall back in H2 as commodity prices move sideways or correct.
Fiscal stimulus is acting to push up US nominal money growth but there may be an offsetting drag across the G7 from recent bond yield rises – chart 6.
Chart 6
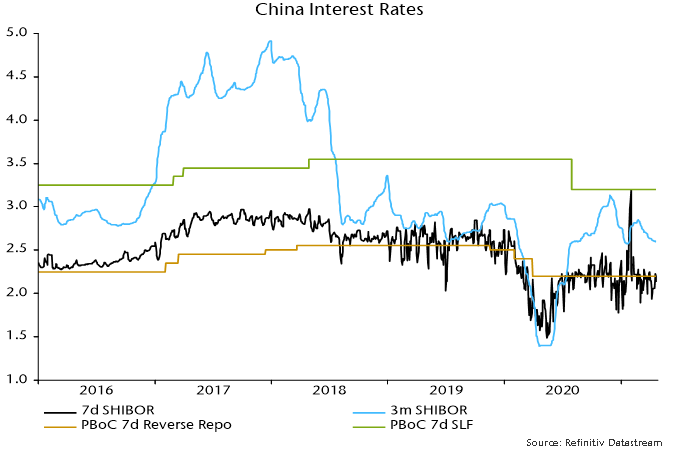
A revival in Chinese narrow money growth probably requires a PBoC policy shift. The view here has been that policy was overtightened in H2 2020 and the economy would slow in H1 2021. This scenario appears to be playing out, with Q1 GDP disappointing and industrial output falling in March. Core CPI inflation (i.e. ex. food and energy) is at 0.3% and a surge in PPI inflation reflects input cost rises that are squeezing downstream margins. The PBoC has allowed three-month SHIBOR to drift back to its January low, consistent with a switch to an easing bias – chart 7.
Chart 7
Global six-month real narrow money growth is estimated to have fallen further in February, based on monetary data covering 70% of the G7 plus E7 aggregate calculated here. The decline from a July 2020 peak suggests a slowdown in industrial momentum extending through Q3 2021.
Turning points in six-month real narrow money growth have led turning points in the global manufacturing PMI new orders index by 6-7 months on average historically. The July money growth peak, therefore, suggested a new orders peak in January-February. The current high point of the orders index is November 2020 but this may have been surpassed in March. These are details: the key point is that the index appears to be reaching a peak on schedule, with money trends suggesting a significant relapse by end-Q3.
Chart 1
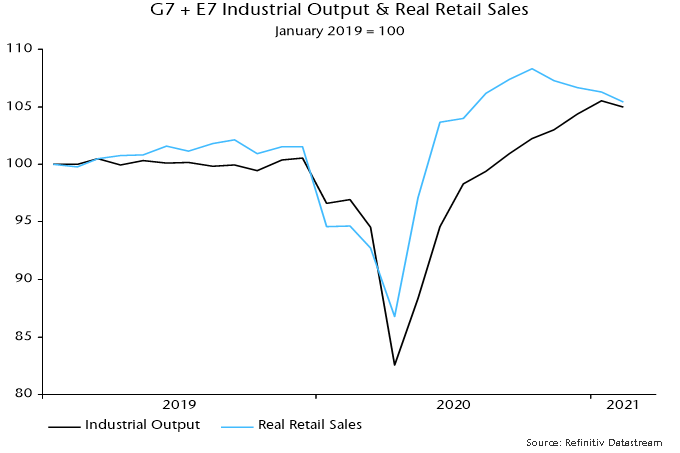
Cooler consumer goods demand is consistent with a coming industrial slowdown. Global retail sales fell between October and January, with early data suggesting another decline in February – chart 2.
Chart 2
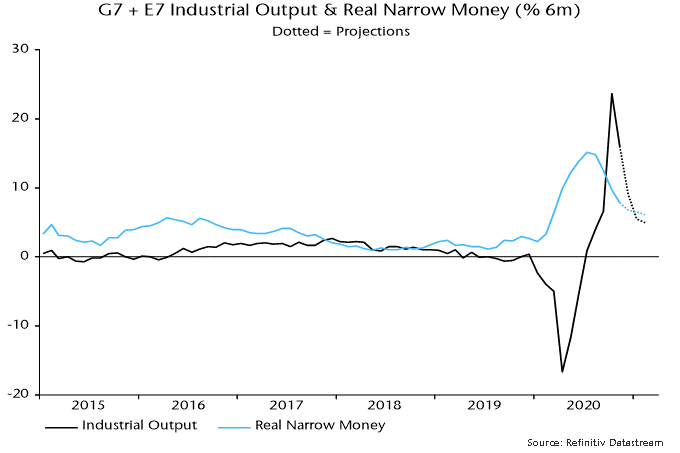
Industrial output growth appears to have been sustained by a continued recovery in investment goods demand and – probably more importantly – a rebuilding of depleted inventories. Restocking, however, will have been accelerated by softer consumer goods demand and the associated output boost may be peaking.
A key point, often neglected, is that the level of industrial output is related to the rate of change of inventories. These are probably still lower than desired and restocking should continue. A slowdown in the rate of increase, however, is sufficient to exert a negative impact on the level of output.
A normalisation of US six-month real narrow money growth has been a key driver of the slowdown in the global measure, although smaller declines have occurred elsewhere – chart 3. US money growth should rebound strongly in March / April as the Treasury transfers cash to households from its account at the Fed (i.e. helicopter money).
Chart 3
A US rebound could drive a pick-up in global six-month real narrow money growth, signalling industrial reacceleration in late 2021 / H1 2022. This isn’t guaranteed, however: a further inflation rise will drag on real money growth near term, while nominal money trends elsewhere may continue to cool.
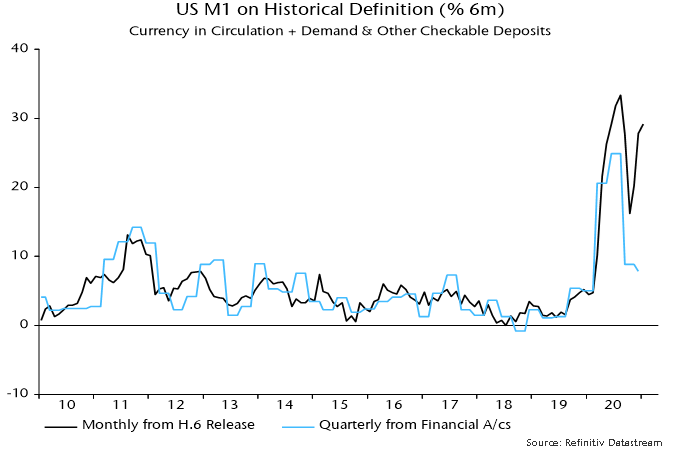
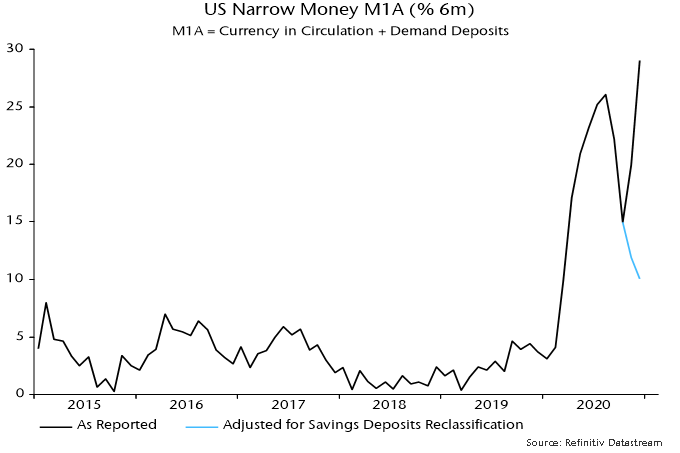
Analysis of US narrow money trends has been complicated by banks reclassifying some savings accounts as transactions accounts following a Fed decision to lift restrictions on the former. This artificially boosted the old M1 measure in 2020, particularly later in the year, when its six-month growth rate rebounded strongly – chart 4. The numbers used here attempt to correct for this distortion but the suggestion of a significant slowdown was disputed by some readers.
The debate has now been resolved by the recently released Q4 financial accounts – these contain M1 flow data adjusted for reclassifications and other discontinuities. The fall in six-month growth of the break-adjusted M1 series during H2 2020 was similar to that of the corrected measure calculated here.
Chart 4
A global industrial slowdown in Q2 / Q3 may not be reflected in GDP data because of services reopening. The latter, indeed, could contribute to industrial softening as consumer demand switches back from goods to services. The judgement here is that industrial trends are a better guide to underlying economic momentum and a more important driver of markets, partly reflecting a stronger correlation with equity market earnings.
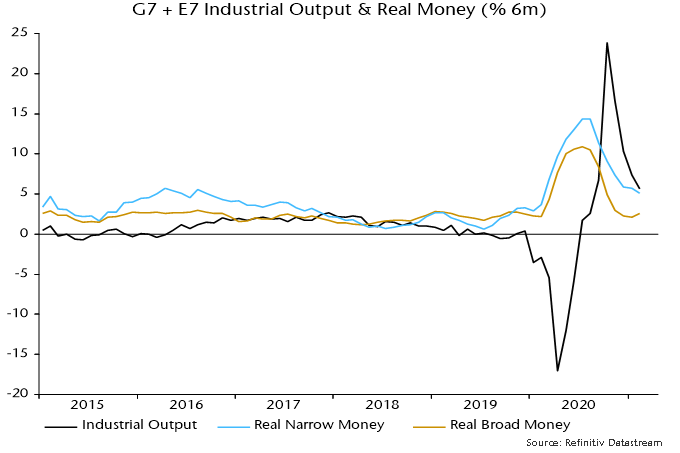
A simple rule for switching between global equities and US dollar cash discussed in previous posts holds cash when six-month growth of global real narrow money is below that of industrial output. A negative cross-over occurred in October 2020 and – allowing for data publication lags – resulted in the switching rule recommending a move to cash at end-2020.
Real money growth was below industrial output growth in January and early indications are that this remained the case in February – chart 5. The rule, therefore, will continue to recommend cash in April and, probably, May. The rule is currently about 4% offside since the end-December switch. Such a drawdown is not unusual and compares with a 32% gain when the rule was in equities between end-April and end-December 2020.
Chart 5
Global money trends continue to suggest a near-term economic slowdown, with the caveat that interpretation of US monetary statistics is complicated by recent regulatory changes.
The key global monetary indicator followed here – six-month growth of real narrow money in the G7 economies and seven large emerging economies – is estimated to have fallen further in December, based on monetary data covering 70% of the aggregate. Real money growth has led the global manufacturing PMI new orders index by 6-7 months on average historically, so the continued decline from a July 2020 peak suggests that this PMI measure will move lower into Q2 – see chart 1.
Chart 1
An important qualification is that the G7 plus E7 money numbers for November / December incorporate an adjustment to US data to correct for an apparent upward distortion due to some banks reclassifying savings deposits (excluded from M1 and related measures) as demand deposits (included).
Excluding this adjustment, six-month growth of US narrow money rose to a new high at year-end – see chart 2. Some monetary observers ignore or are unaware of the reclassification distortion, arguing that the narrow money surge presages a super-strong economy and sharply higher inflation.
Chart 2
Fed statisticians haven’t responded to a request for confirmation of a reclassification effect on the data. The view that the strong November / December numbers are explained by such an effect – rather than a genuine flow of money out of “inert” savings deposits into “high velocity” demand deposits – rests on three considerations.
First, the Fed indicated that deposit reclassifications would occur following its decisions to cut reserve requirements on transactions deposits to zero and remove restrictions on withdrawals from savings deposits last spring.
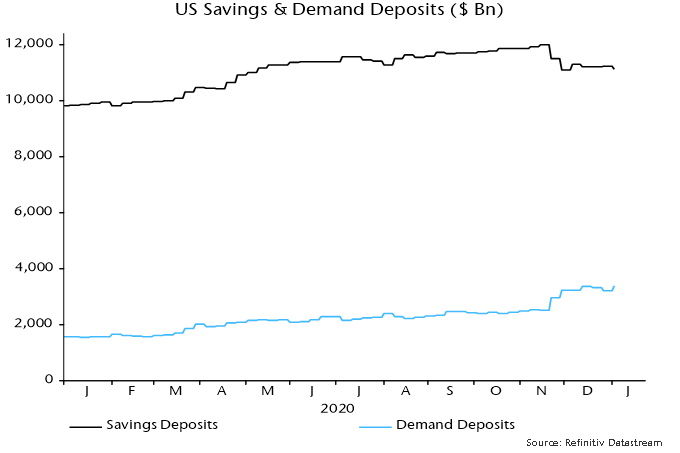
Secondly, the big fall in savings deposits and corresponding rise in demand deposits occurred between the weeks ending 16 November and 30 November – see chart 3. Movements outside this two-week window were “normal”. The weekly numbers are averages of daily data, so the reclassification is likely to have occurred during the week ending 23 November, with the effect carrying over into the following week. (The alternative view is that US election results triggered a big movement of money.)
Chart 3
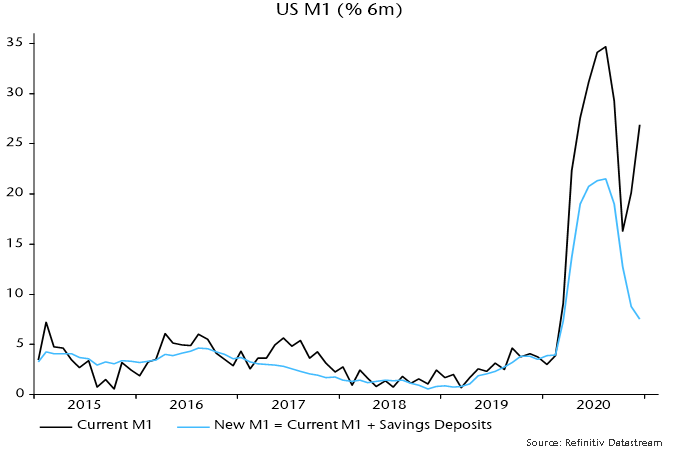
Thirdly, the Fed implicitly acknowledged that the M1 data have become distorted in its decision to redefine the aggregate to include savings deposits from next month. Six-month growth of the new M1 measure continued to slide in November / December – see chart 4.
Chart 4
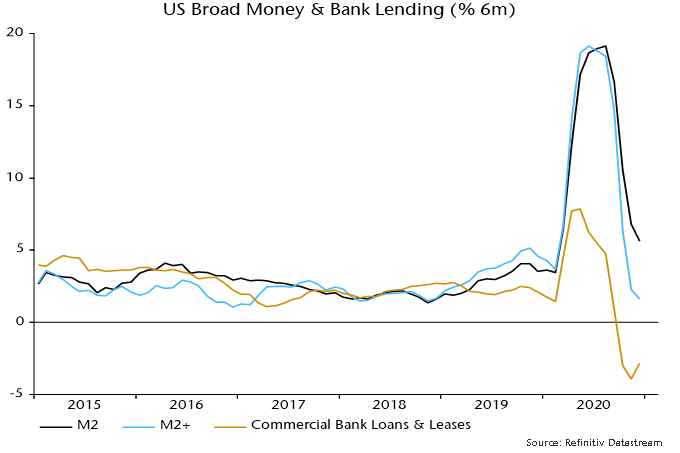
The suggestion that US monetary conditions have become less expansionary is supported by broad money trends, while bank lending continued to contract into year-end (with weakness not due to PPP loan forgiveness, which has yet to kick in) – see chart 5.
Chart 5
The fall in global six-month real narrow money growth in December also reflected declines in China, Japan and Brazil. The further slowdown in China – extending to broad money and credit, as shown in chart 6 – is consistent with the view here that PBoC policy is too tight and Chinese economic news is likely to disappoint in early 2021. A dovish PBoC policy shift may be needed to trigger the next leg of the global reflation trade but isn’t expected by the consensus and could be conditional on a prior market setback.
The forecasting approach employed here – relying on monetary and cycle analysis – turned positive on the global economy and risk markets in early Q2 2020 but is giving a more cautionary message at the start of 2021. The suggestion is that underlying economic momentum will slow temporarily while monetary support for markets has diminished, together raising the risk of a correction. The central view remains that global growth will be strong over the course of 2021 as a whole but with the adverse corollary of a significant pick-up in inflation into 2022.
The monetary aspect of the forecasting approach can be summarised as “real money leads the economy while excess money drives markets”. Six-month growth of real (i.e. inflation-adjusted) narrow money in the G7 economies and seven large emerging economies (the “E7”) was weak at the start of 2020 but surged from March, correctly signalling a strong rebound in global economic activity during H2.
Real money growth, however, peaked in July, falling steadily through November, the latest data point – see chart 1. Turning points in real money growth have led turning points in the global manufacturing PMI new orders index – a key coincident indicator – by 6-7 months on average historically, suggesting that the PMI will move lower in early 2021. The level of money growth remains high, arguing against economic weakness (except due to “lockdowns”), but a directional shift in activity momentum could act as a near-term drag on cyclical assets.
Chart 1
“Excess” money refers to an environment in which actual real money growth exceeds the level required to support economic expansion, with the surplus likely to be invested in markets. Two gauges of excess money are monitored here: the gap between six-month growth rates of G7 plus E7 real narrow money and industrial output, and the deviation of year-on-year real money growth from a long-run moving average. Historically, global equities performed best on average when both measures were positive, worst when they were negative, and were lacklustre when they gave conflicting signals.
Following a joint positive signal (allowing for data release lags) at end-April 2020, the measures became conflicting again at end-December – year-on-year real money growth remains well above its long-run average but six-month growth fell below that of industrial output in October / November. Markets, therefore, may no longer enjoy a monetary “cushion” against unfavourable news, including the expected PMI roll-over.
The expectation here is that markets will become more volatile but risk assets are unlikely to be outright weak – any sizeable set-back would probably represent another buying opportunity. As noted, real money growth remains at an expansionary level and may stabilise soon, while the cycle analysis is giving a positive economic message for the next 12+ months, as explained below.
The cross-over of six-month real narrow money growth below industrial output growth, moreover, could prove short-lived, with output momentum about to fall back sharply as positive base effects fade. Assuming a stabilisation of monthly money growth, a positive differential could be restored as early as January – see chart 2 – in which case the assessment of the monetary backdrop for markets would shift back to favourable from Q2.
Chart 2
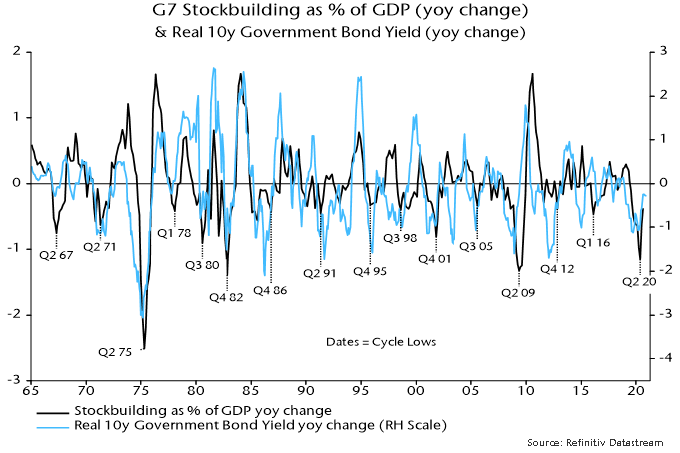
The cycle analysis provides a medium-term perspective and acts as a cross-check of the monetary analysis. There are three key economic activity cycles: the stockbuilding or inventory cycle, which averages 3.5 years (i.e. from low to low); a 9-year business investment cycle; and a longer-term housing cycle averaging 18 years. These cycles are essentially global in nature although housing cycles in individual countries can sometimes become desynchronised.
The cycle analysis was cautionary at the start of 2020, reflecting a judgement that the stockbuilding and business investment cycles were in downswings that might not complete until mid-year. The covid shock magnified but ended these downswings, with both cycles bottoming in Q2 and entering a recovery phase in H2. With the housing cycle still in an upswing from a 2009 low, all three cycles are now acting to lift global economic momentum.
The next scheduled cycle trough is a low in the stockbuilding cycle, due to be reached in late 2023 if the current cycle conforms to the average 3.5 year length. The downswing into this low would probably start about 18 months earlier, i.e. around Q2 2022. The cycle analysis, therefore, is giving an “all-clear” signal for the global economy for the next 15-18 months, implying that any data weakness – such as suggested by monetary trends for early 2021 – is likely to be minor and temporary.
Financial market behaviour is strongly correlated with the stockbuilding cycle in particular. Cycle upswings are usually associated with rising real government bond yields and strong commodity markets – see charts 3 and 4 – as well as low / falling credit spreads and outperformance of cyclical equity sectors. The latter three of these trends, of course, were in place during H2 2020 and may extend during 2021 after a possible Q1 correction. A surprise to the consensus in 2021 could be a rebound in real bond yields, which would challenge current equity market valuations and could favour “value”.
Chart 3
Chart 4
To sum up, monetary data in early 2021 will be important for the strategy assessment here. The current monetary backdrop and possible weaker near-term economic data suggest reducing cyclical exposure relative to H2 2020 but a stabilisation or revival in real money growth would support the positive message from the cycle analysis, arguing for using any setback in cyclical markets to rebuild positions in anticipation of a strong H2.
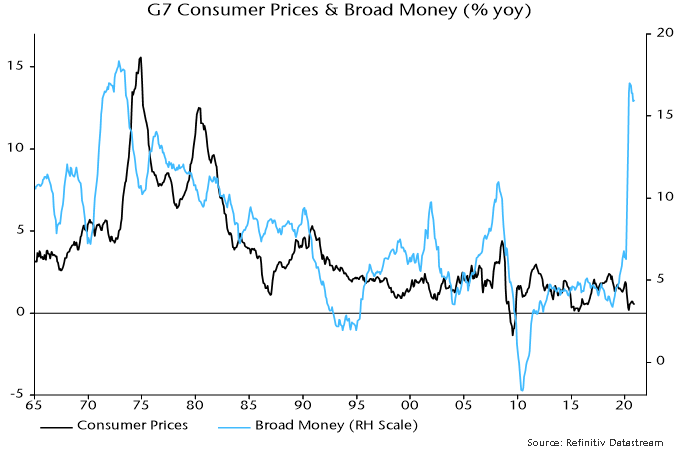
Consumer price inflation rates are widely expected to rise during H1 2021, reflecting recent commodity price strength, a reversal of temporary tax cuts (Germany / UK) or subsidies (Japan), and base effects. The policy-maker and market consensus is that this will represent a temporary “cyclical” move of the sort experienced regularly in recent decades. The suspicion here is that it will prove more lasting and significant, because the monetary backdrop is much more expansionary / inflationary than before those prior run-ups.
Broad rather than narrow money trends are key for assessing medium-term inflation prospects. This is illustrated by Japan’s post-bubble experience: narrow money has grown strongly on occasions but annual broad money expansion never rose above 5% over 1992-2019, averaging just 2.1% – the monetary basis for sustained low inflation / mild deflation. Similarly, G7 annual broad money growth averaged only 3.7% in the post-GFC decade (i.e. 2010-19).
2020 may have marked a transformational break in monetary trends. G7 annual broad money growth peaked at 17.0% in June, the fastest since 1973 – see chart 5. Monthly growth has subsided but there has been no “payback” of the H1 surge. At the very least, this suggests a larger-than-normal “cyclical” upswing in inflation in 2021-22. Ongoing monetary financing of large fiscal deficits may sustain broad money growth at well above its levels of recent decades, embedding the inflation shift.
Chart 5
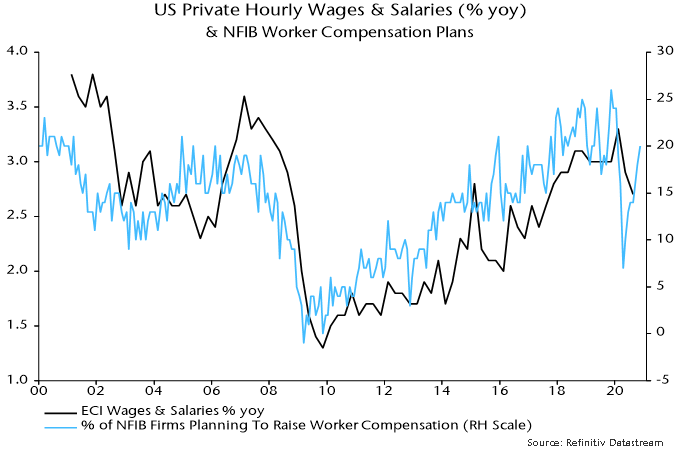
The consensus view that an inflation pick-up will prove temporary rests on weak labour markets bearing down on wage growth. Unemployment rates adjusted for short-time working / furlough schemes, however, fell sharply as the global economy rebounded in H2 2020 and structural rates have probably risen – labour market “slack”, therefore, may be less than widely thought and much lower than after the 2008-09 recession. The slowdown in wages to date has been modest and some business surveys are already hinting at a rebound – see chart 6.
Chart 6
Commentators who take seriously the prospect of a sustained inflation rise often argue that real bond yields would take the strain by moving deeper into negative territory, the view being that central banks will cap nominal yields. Such a scenario would be bullish for risk assets but probably overstates the power of the policy emperors. Pegged official rates and a QE flow currently running at about 10% of the (rapidly rising) outstanding stock of G7 government bonds per annum could prove insufficient to offset selling by existing holders in the event of an unexpected inflation surge.