Autumn trees in Downtown Vancouver, Canada.

Markets have long anticipated an economic downturn, and looking beyond it to a potential decline in interest rates as central banks step in to support the economy. A key indicator has been the deeply inverted yield curve over the past year and a half. In the last couple of months, the US Federal Reserve, Bank of Canada and other major central banks seem to have reached the peak of their rate-hiking cycles. We are now in a late stage of the business cycle where central banks have stopped raising rates, but are not yet easing policy. Over the last 40 years, this transitional period has lengthened because central banks generally have not overtightened, which would necessitate an immediate and sharp U-turn to an easing cycle. Before 1985, the median period from the last rate hike to the first rate cut was about two months, but this extended to eight months after 1985 (see Chart 1). Thus, in the past few decades’ business cycles, there have been times when markets, absorbing new data, anticipated a soft landing. However, initial signs of slowing can also forewarn of a more severe downturn.

Chart 1: Longer lags between policy shifts

Chart 1: Longer lags between policy shifts. Chart 1 shows the Federal Reserve's policy target rate over the period from 1971 to 2023, along with the number of months between the last tightening to the first easing, over the period. The data reveals that prior to 1990, there was a short span between the last interest rate hike and the first interest rate cut. Since 1990, the period between the last interest rate increase and the first cut has increased.

Source: Federal Reserve, Minack Advisors, Macrobond

If a yield curve inversion signals economic slowdown, its normalization often coincides with that slowdown. As the yield curve transitions from inverted to flat, and then back to normal (where long term bond yields are above short term yields), unemployment tends to rise, economic activity falls and inflation decreases. Notably, the two-year to 10-year US Treasury yield curve moved from a -93 basis points (bps) inversion in July to just -20 bps at the end of October (see Chart 2).

Chart 2: Normalization is a precursor to recessions

Chart 2: Normalization is a precursor to recessions Chart 2 shows the US yield curve, measured by the 10-year bond yield less the 2-year bond yield, plotted against US recessions. Historically, the yield curve moves toward normalization just prior to recession. The yield curve has moved in a similar fashion in the most recent period.

Note: Shaded area represents US recessions.
Source: US Department of Treasury, Macrobond

Equities weaken in a downturn but fare better in a soft landing. However, even if, in today’s cycle, we end up in a soft landing scenario, the strength of equities is uncertain due to considerable optimism already priced into the market. Forward earnings, especially in the US, appear overly optimistic. For instance, 2024 earnings are forecasted to rise by 12.5% above this year, but if a recession materializes, earnings are likely to decline outright. This is evident as third quarter earnings report marginally weaker revenues, despite a strong 4.9% quarter-on-quarter annualized real GDP growth. Additionally, current equity valuations remain high by any metric. Thus, the asymmetry of outcomes stands out — in a hard landing, equities could face material declines, while even with a soft landing, upside may be limited.

Within the S&P 500 Index, the “Magnificent Seven” large-cap tech stocks have driven all year-to-date gains, now comprising nearly half of the Russell 1000 Growth Index, up from 12% a decade ago. This late-cycle phase has also seen small-cap stocks underperforming, in line with the latest NFIB survey of small and medium-sized businesses remaining low. Higher wages and operating costs are weighing on profit margins, with interest paid on loans reaching 10% in October (see Chart 3), the highest since the early 2000s. The full impact of higher rates on companies is still unfolding, but is becoming increasingly evident.

Chart 3: Interest costs are biting

Chart 3: Interest costs are biting. The chart illustrates a trend in the escalating interest costs faced by borrowers, as indicated by the NFIB Survey on the actual interest rates paid on short-term loans. Covering the period from 1989 to 2023, the series has surged from an all-time low in 2020, to currently the highest level since 2006.

Source: National Federation of Independent Business, Macrobond

In contrast, bond returns have been weak for an unprecedented third straight year driven by a sharp increase in yields, which are now back at long-run averages. In October, US 10-year yields crossed above 5%, with real yields at 2.1%, the most attractive levels in over 15 years and comparing favourably relative to earnings yields on equities (see Chart 4). The FTSE Universe Bond Index in Canada and the Bloomberg US Aggregate Bond Index yielded 5.1% and 6.5%, respectively, at the end of October, a significant increase from around 1% a few years ago. While investors can assess for themselves whether interest rates will go up or down from here, it is certainly true that bond yields are more attractive today than before, with greater potential for capital gains, especially if a downturn occurs. Recent data, notably in the US labour market, is demonstrating the excess demand conditions are moving back towards balance with the gap between labour demand and supply halving since its peak. A modest rise in continuing jobless claims suggests that, on the margin, jobs are becoming harder to find. Given these factors, we are increasingly cautious on risk assets, including small-cap stocks, and more positive about bonds as the year concludes.

Chart 4: Bond yield and earnings yield gap is closing

Chart 4: Bond yield and earnings yield gap is closing. Chart 4 shows the US 10-year Treasury bond yield against the S&P 500 earnings yield, from 1995 onward. Since 2002, the earnings yield of the S&P 500 has comfortably surpassed the yield on the 10-year Treasury bond. With the recent spike in bond yields, these two series are now closely in line.

Source: US Department of Finance, I/B/E/S, Macrobond

Capital Markets

October was another tough month for markets, with both equities and fixed income showing weakness. The horrific attack by Hamas on Israel early in the month raised concerns about a wider conflict in the Middle East, and elevated geopolitical risks. However, the direct market impact of this so far appears to be muted, with efforts made to limit a broader escalation in the region. The effect on oil, and safe-haven assets such as gold was generally subdued, with initial short-lived rallies followed by a decline in prices, ending the month only modestly higher.

In Canada, two-year interest rates fell 16 bps and rose by 5 bps at the 10-year term, leading to a 0.37% gain in the FTSE Canada Universe Bond Index. In the US, 10-year Treasury yields surged 33 bps over the month, marking the sixth consecutive month of increase, and closed October at 4.93%. This surge in yields was a response to strong economic indicators, such as the third-quarter GDP report. The rising yields contributed to equity markets ending lower for the third straight month, a trend not seen since March 2020. The S&P 500 fell 2.1%, while the S&P/TSX Composite Index dropped 3.2%.

Portfolio Strategy

The market is still adjusting to the new reality of higher interest rates (and responding very favourably when yields fall). The path for risk assets depends heavily on the unfolding economic scenario. The US is holding in, aided by strong fiscal policy thrust. However, the longer interest rates stay elevated, the greater the risk of a hard landing. Against that backdrop, equity markets seem to be anticipating a very optimistic outcome. Thus, our asset mix for balanced funds remains overweight cash while equities are underweight. At the same time, current bond yields are becoming more attractive, prompting us to assess the opportunity to increase our bond allocation. Our fundamental portfolios continue to focus on stable, defensive companies as we anticipate an increase in equity market volatility. Fixed-income portfolios are looking to add to positions that will benefit from the yield curve moving toward normalization, and remain underweight credit, anticipating wider spreads.
As we approach the late cycle phase, the high level of interest rates is dominating both the macroeconomic and investing environment. We remain vigilant on the growing risks as the year closes out.

Federal Reserve - Central Banking at sunset.

In bond markets, the late-cycle environment typically concludes because of central banks. Either short-term rates move higher, driven by central banks fighting inflation until the bitter end, or central banks recognize that rates have risen too steeply and too fast, so cuts get priced into short-term rates. To have long-term interest rates lead the charge higher, as has been the case very recently, is highly unusual. Indeed, market pricing for central bank rate moves over the coming year has barely budged. Yet, since the July Federal Open Market Committee (FOMC) meeting, US 10-year yields have marched relentlessly higher. In September alone, they surged 48 basis points (bps) to 4.6% while 30-year yields rose 50 bps to 4.7%. As of the first week of October, both are now at their highest level since 2007. Many factors are at play, but understanding the reasons behind the moves matters because it influences how much higher rates could still go.

  • The most straightforward explanation for the persistent increase is that at the beginning of the year, many market participants anticipated, and were positioned for, a recession that we now know won’t materialize in 2023. With evidence that the economy can withstand the tightening to date, combined with ongoing high inflation and wage gains, the outcome is fewer expected rate cuts through 2025. Essentially, rates will remain higher for longer. The US Federal Reserve (Fed) has signaled this in its latest Summary of Economic Projections. Thus, the rise has been almost entirely in real interest rates, which reflects a more optimistic growth outlook as long-term inflation expectations have been flat.
  • US Treasury supply is entering into a rough spot. Massive US deficits are expected to persist (see September Outlook). Debt maturities are skewed towards the short end of an inverted yield curve where yields exceed 5%. Interest payments are skyrocketing and new issuance is on the rise.
  • US Treasury demand is also falling, notably through the Fed’s quantitative tightening program, that is allowing $60 billion of bonds each month to no longer be rolled over. This equates to some US$800 billion of bonds being returned to the market. But, more importantly, the enormous and growing twin international trade and fiscal deficits raise concerns over where the US will attract investors from to fund this deficit. While historically, holding the world’s lone reserve currency has alleviated this, a rising number of foreign trade transactions are shifting away from the USD, a byproduct of reversing globalization trends. This suggests that long-term rates must increase to effectively attract savings into the treasury supply.
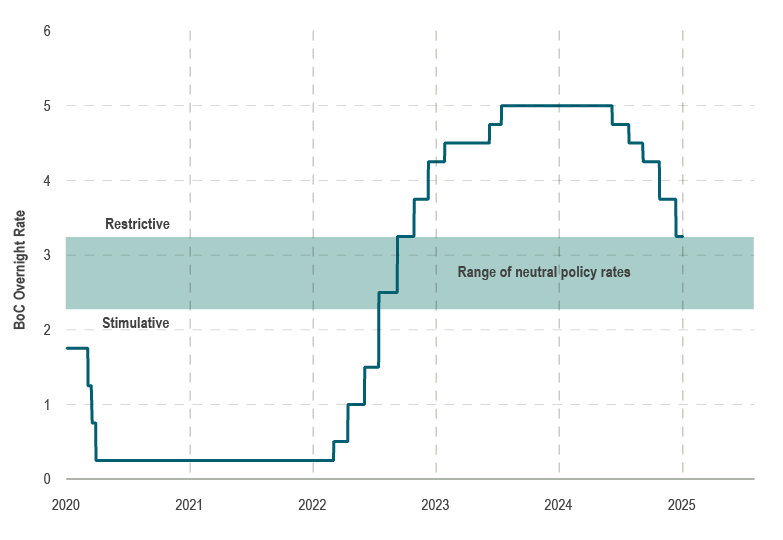
  • Looking ahead, there is now some reconsideration of the neutral rate of interest (where inflation at 2% is consistent with economic growth), and whether it might surpass the Fed’s current estimate of around 2.5%.

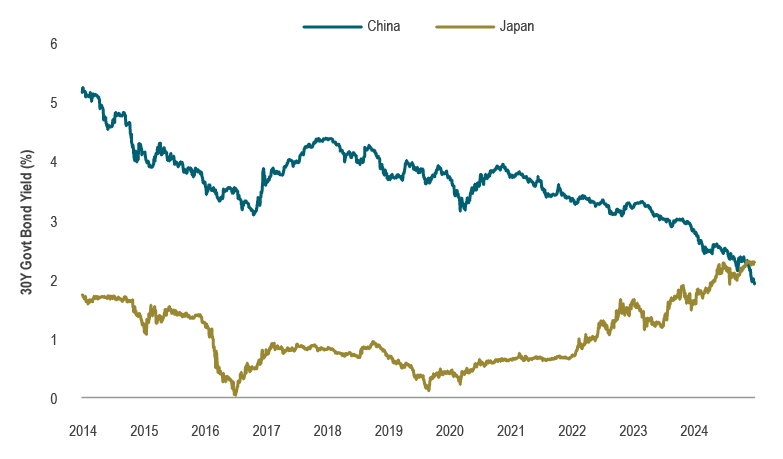
Notably, this is not restricted to the US; yields globally have also been on the upswing. Even in Japan, the 10-year rate, which had held near 0% since 2016, has climbed to 0.79%. Indeed, rates are up universally (see Chart 1), Canada included. However, many of these fundamental factors are less of a problem in Canada, which maintains a large and active pension and insurance sector in need of long-duration assets. Moreover, considering assets in social security programs like the Canada Pension Plan, overall debt levels on a net basis and associated interest costs appear much healthier. The “resilient economy” perspective is less applicable to Canada. While incomes enjoyed the benefits of a prior rise in short-term interest rates, resulting in a surge of inflows to money markets funds and GICs, this latest rally in long-term yields has not shown a similar benefit. Furthermore, a mortgage debt maturity wall looms large from 2025 on, and we believe consumers will cut back spending in anticipation of financial challenges.

Chart 1: Surge higher in global bond yields

Chart 1 shows a time series of an average 10-year bond yield across developed markets (including Canada, Germany, Japan, the UK, France, Italy, the US, and Australia), starting in 2020. The chart shows a surge in the average yield in 2022, followed by a more stable trading range through 2023. More recently, the average yield has broken higher beyond the recent trading range.

Source: Macrobond

What next?

The argument that we are nearing the top of the rate-hiking cycle is predicated on either signs of a looming recession that eventually temper inflation or, alternatively, that the higher rates trigger some type of financial stress. Examples of such strains include the UK pensions issue last fall (refer to the November 2022 Outlook), or the challenges faced by US regional banks this past spring (see April’s Outlook). However, in the absence of clear signs pointing to an imminent recession or financial crisis, the supply and demand dynamics of Treasuries, as described above, have considerable momentum and no easy fixes. Moreover, with the approach of a US Presidential election year, proactive and meaningful fiscal restraint seems improbable. As such, the rise in interest rates is giving way to concern in asset markets. For now, equity markets are not pricing in an economic downturn, as earnings estimates for the next twelve months have held steady after easing through much of this year.

From our lens, equity markets remain vulnerable in the near term. Valuations have been edging lower. But if valuations are broken down into two components, the risk-free 10-year Treasury yield and the equity risk premium (ERP), the message is somewhat concerning. ERP gauges the excess return above the low-risk bond yields that compensates equity investors for assuming additional risk. Typically, ERPs have an inverse relationship with growth, rising when economic activity dips. Yet, thus far this year, amidst market anxieties about decelerating growth, ERPs have been defying all expectations and have fallen to reach their lowest level since 2002 (see Chart 2). This most recent move has been because interest rates are rising faster than price/earnings (P/E) multiples are contracting, implying that the advantage of holding equities today is marginal. In fact, equities are grappling with stiff competition from higher yields since dividend yields are not keeping up (see Chart 3).

Chart 2: Equity risk premium unusually low

Chart 2 shows the US 10-year bond yield vs S&P500 Equity Risk Premium from 1985 to 2020. From 2007 onward, the equity risk premium has exceeded the US 10Y bond yield. More recently, it has declined, and is now below the US 10-year bond yield.

Source: S&P Global, UST, Macrobond

Chart 3: Stiff competition

This chart provides the historical trends in the S&P 500 dividend yield and the US 10-year bond yield over the period spanning from 2008 to 2023. From 2021 the chart captures the rise of the US 10Y yield which has significantly exceeded the S&P 500 dividend yield.

Source: S&P Global, UST, Macrobond

So, as we assess the current phase in the cycle, consumers are faced with headwinds from rising mortgage rates and energy prices, and investors are faced with higher funding rates due to governments’ mighty spending patterns. Meanwhile, equity markets are priced optimistically for a soft landing, and not really rewarding investors for taking risk. Given these prevailing trends, we remain cautious on our outlook for markets.

Capital markets

September proved challenging for markets, a trend becoming par for the course for this month. Both stocks and bonds have fared poorly in the past few Septembers and this year was no different. The US 30-year Treasury yield saw its biggest quarterly increase since the first quarter of 2009, while the Dow Jones Index gave up all of its gains year-to-date. The S&P 500 Index peaked for the year on July 31, and has since retreated by about 7%. Excluding the “magnificent eight” high flying tech stocks (see June’s Outlook), the performance of the S&P 492 closely mirrors the Dow Jones, remaining unchanged year-to-date. Although earnings estimates for the year have held steady, valuation multiples have declined, with the forward P/E ratio falling from 20x to 18x. Leadership has also predictably been shifting with bond proxy sectors such as utilities, telecommunication services and real estate underperforming, but also those with the richest valuations (information technology) struggled through September. In Canada, the S&P/TSX Composite Index fell 3.3% in September, marking its second monthly decrease this year. All sectors, excluding energy, were in the red led down by information technology, and interest rate sensitive areas such as utilities, REITs and telecommunication services. Energy posted a modest gain for the month, and was the best-performing sector, as the price of WTI crude oil rose 28.5% in Q3 to $90.79/bbl, its biggest quarterly rise since Q1 last year after Russia’s invasion of Ukraine.

With inflation still above central bank targets, and a seeming resurgence in Canada, monetary policymakers maintained a hiking bias. The Fed notably revised its growth forecasts upward and hinted at future rate hikes. Yield curves remain deeply inverted and credit spreads stopped tightening in the month, thanks in part to a surge in corporate bond issuance that counteracted the favourable technical factors supporting credit markets earlier in the year. The FTSE Universe Bond Index fell 2.6% in September, pushing the year-to-date return into negative territory in absolute terms and setting the trajectory for its third straight year of negative performance.

Portfolio strategy

The rise in rates is becoming an important feature for markets to contend with as we head into the final months of the year. The longer interest rates stay high, the greater the likelihood of a “hard landing” coming to pass. This continues to weigh on the outlook for risk assets. Consequently, we have recently increased our underweight to stocks within balanced portfolios, given our view of a challenging period ahead. We have also bought bonds through this backup in yields, and are now at benchmark weight. We continue to overweight cash. Within our Canadian fundamental equity portfolios, we are defensively positioned, with a preference for companies that demonstrate resilience during economic downturns. Our fixed-income portfolios have begun to add duration modestly after holding flat since the end of July. We remain underweight credit in anticipation of a difficult road in the near term. However, should inflation persists at high levels, we are adding some inflation protection. While there is no shortage of news to sift through to understand the factors driving performance across different markets, we believe overarching themes like sustained inflation and high interest rates will dominate. We are preparing for a bumpier ride heading into the final quarter of the year.

Image of U.S. Capitol building with cloudy skies above.

Markets have been pleasantly surprised by the economic strength this year.

The reasons are many and vary across countries. However, one that has gone largely unnoticed is the return of supportive fiscal policy. In 2022, the US fiscal deficit contracted by the most on record after posting the largest expansion on record through 2020 and 2021. This year, even as the economic expansion has matured, bringing down the unemployment rate to its lowest level in a generation and pushing interest rates materially higher, the federal deficit has stealthily – and significantly – grown. In fact, the deficit doubled over the first 10 months of the fiscal year, from an already large US$726 billion in 2022 to US$1.61 trillion this year.

The surprises have come on both the revenue and spending sides of the ledger (see Chart 1). Tax refunds, normally peaking in the spring, actually rose over the summer, particularly to small businesses that have been filing backdated Employee Retention Tax Credits for meaningful sums. This plan has been increasingly utilized and recent reports suggest claims are now being denied in an effort to reduce excess use. Another reason for the lower tax revenue is depressed capital gains taxes amidst last year’s market returns.

Chart 1: Major fiscal items contributing to the $800bn deficit increase 
June 2022 – June 2023

Source: US Department of Treasury, Strategas

On the other side of the ledger, spending has crept upward in the usual areas, such as social security, Medicare and defense. New investment and construction projects from the Inflation Reduction Act and Infrastructure and Clean Energy bill have not yet started, but should pick up in 2024 and carry forward for years, further deepening deficits.

However, the biggest increase in spending has been from interest payments on public debt, which have been impacted by the combination of growing financing needs and rising interest rates. Up until last year, even though the total debt outstanding grew materially, interest costs as a proportion of federal spending held in below prior highs.

Looking ahead, this is set to change even more significantly because around 70% of all US Treasuries held by private investors are maturing and will need to be rolled over in the next five years. In other words, most US debt is short term, and unfortunately, where interest rates are the highest. This is a sharp contrast to household mortgage debt and corporate debt that tends to be longer term and thus cushioned to some extent from the immediate effects of rate hikes.

Today, payments on federal debt take up about 14% of all revenues the government brings in. The Congressional Budget Office projects that interest costs will triple over the next decade, growing from 1.9% of GDP to 3.7% in 2033 (see Chart 2). Given the size of the deficit, the cost of servicing the debt and that there is no plan to materially reduce the deficit, it’s little surprise that Fitch downgraded US debt from AAA to AA+ in early August.

Chart 2: Interest costs will exceed previous high by 2029

Source: CBO, Macrobond

Deficits are useful and important policy tools. Government spending using borrowed funds can support growth and productivity if funds are earmarked for infrastructure or investments. Importantly, running a deficit can soften the impact of a recession and also mitigate crises, like an economic shutdown, or help rebuild after a natural disaster. That said, large deficits should not occur at a time when the economy is already pushing up against full employment. In this situation, the government artificially creates demand, making inputs more expensive, and crowds out private investment by competing for financing that would otherwise invest in new ideas or business expansion. Cyclically, during downturns, government support is critical to many, and indeed, if this is the deficit during good times, what will it be in a recession?

Shorter-term implications are equally important. The size of the debt is now roughly the same as annual GDP and threatens to surpass the short-lived surge during World War II (see Chart 3), and, at this size, may force a reprioritization of servicing the federal debt above the fight against inflation.

Chart 3: US government debt to exceed previous high by 2028

Source: CBO, Macrobond

In other words, monetary policy – already balancing the competing priorities of price stability, full employment and financial stability – may also need to temper high interest rates to prevent a fiscal crisis. From a historical policy perspective, monetary policy tools may not be the best suited to combat deficit-fueled inflation; instead, fiscal austerity may ultimately be the required policy tool. The New York Fed’s recently published research supports this argument, concluding that extensive government support was responsible for about a third of the inflation between December 2019 and June 2022.

We believe that the Fed’s primary focus will remain on the inflation risk and Chair Powell has said as much in asserting the Fed’s independence and leaving debt and servicing costs for Congress to address. The problems are nonetheless intertwined – too much fiscal support is being noted by bond investors, who were attuned to similar fiscal risks in the UK a year ago.

This problem is more widespread than just the US. The EU has struggled with rising interest costs, as has Japan, which has stopped projecting a balanced budget. Canada is in better shape comparatively, maintaining an overall AAA rating (Fitch downgraded Canada to AA+ during the pandemic). Provincial governments are also on solid ground. While spending has meaningfully expanded deficits compared to the past two decades, Canada’s deficit is anticipated to be at a comparably modest 1.4% of GDP in 2023-24 and is projected to decline to just 0.4% in four years. Debt levels are a different story, as pandemic support costs were absorbed largely by the federal government and caused a surge in total debt outstanding from 32.8% of GDP pre-pandemic to 44.5% of GDP this year.

Even compared to other countries, the US’s fiscal problems stand out and remain a key risk by virtue of the importance of the bond market and yields. These deficits are unhealthy for the economy longer term and a reversal in the trend would help the Fed’s cause, but it’s not clear that will be forthcoming. Spending is set to rise next year and interest costs are headed higher.

Capital markets

The fiscal picture is one suggested reason for longer-term interest rates rising in August, with the Fitch downgrade a catalyst for the move. The US 10-year Treasury yield reached a peak of 4.36% mid-August before easing back to close the month up about 20 basis points (bps) at 4.11%. This intra-month high has not been seen since 2007. Canadian 10-year yields rose about 6 bps, lagging the move in the US. Two-year yields fell in both countries and the FTSE Universe Bond Index declined marginally, by -0.2%. The higher long-term rates did weigh on risk assets, with credit spreads widening somewhat, but also equity markets, which, on a monthly basis, fell for only the second time this year and the first time in five months. Equities did recover off their lows for the month, as softer inflation data tamed fears of interest rates staying higher for longer. The S&P 500 Index fell 1.6% in August, while the S&P/TSX Composite Index fell 1.4%. Most sectors saw declines in the month, with only energy, consumer staples and the health care groups posting meaningful gains. Despite weakness in China and Europe, energy prices rose for the third straight month, while metals prices weakened alongside industrial production.

Portfolio strategy

Equity markets this year have so far been optimistic about a soft-landing scenario for the economy, due in part to the unanticipated fiscal support, though we continue to view a soft landing as a lower probability scenario. Despite the move higher in interest rates through the summer, valuations this year have actually expanded. If the soft-landing scenario does come to pass, then it’s likely the market and the Fed would need to reassess the neutral policy rate, as the economy would appear able to handle these levels of rates. Thus, long-term interest rates could stay higher for longer compared to prior cycles, which would ultimately disappoint risk assets. This upside risk to yields is particularly true if the concern over fiscal mismanagement continues to grow.

Balanced portfolios remain overweight cash, while both equities and bonds are underweight relative to benchmarks. Equity markets continue to reward companies with resilient earnings. We are adding to some cyclical stocks with attractive valuations that reflect the potential to benefit from extended economic strength. We believe the generative artificial intelligence theme will continue to support multiple expansion in the technology sector and look for companies that will benefit from the forthcoming capex cycle driven by increased fiscal investments in the coming years.

Fixed income portfolios continue to position for higher longer-term yields against short-term rates, and the positioning should perform well across different economic scenarios. We continue to monitor the evolving landscape, assess the longevity of the various factors that have helped support growth to date and adjust portfolios accordingly.

Boardwalk running through a dense forest in Vancouver Island, British Columbia.

Not out of the woods yet.

Risk assets, especially equity markets, have performed admirably this year despite leading economic data suggesting a high likelihood of recession. China’s economic performance has been underwhelming, and the US witnessed the failure of three large banks and significant layoffs by large companies. However, in recent months, the Citi Surprise Index for growth has risen while inflation has trended lower. Interestingly, the deceleration in inflation has not been accompanied by much economic hardship, and has been broadly based across various core price metrics (see Chart 1).

Chart 1: Core inflation easing before a downturn
Alternative measures of US CPI

Chart 1: Core inflation easing before a downturn The chart from 2019 to 2023 shows an easing in inflation from recent peaks, prior to an economic downturn, as shown by alternative measures of inflation from the Federal Reserve Bank of Atlanta, Federal Reserve Bank of Cleveland, Federal Reserve Bank of New York, the U.S. Bureau of Labor Statistics, and the Federal Reserve Bank of Cleveland.

Source: Federal Reserve Bank of Cleveland, Federal Reserve Bank of New York, Federal Reserve Bank of Atlanta, BLS, Macrobond

Given the data, many in the market now believe a “soft landing” for the economy is becoming more likely. This soft-landing scenario suggests rolling slowdowns, but in aggregate not enough to cause a full recession or increase in unemployment. A key aspect of this scenario is the easing of inflation on its own.

Take, for instance, the most interest-rate sensitive part of the economy, namely housing. As discussed in July’s Outlook, the housing market improved simply due to lending rates stabilizing. Most recently, housing starts also ticked upward in both Canada and the US, helping to alleviate medium-term supply shortages, which is a remarkable feat when posted mortgage rates across all terms are now above 6%. A second reliable indicator is the ratio of the US ISM’s new orders and inventories, which helps guide how production evolves. It shows that even as the headline ISM signals contraction, components within the ISM survey are actually giving us a positive signal for the growth outlook (see Chart 2). Third, inflation is behaving unusually in this economic cycle. Typically, inflation lags the most of all economic variables and is the last to fall as the economy slows and sometimes even eases only early in the subsequent recovery period. This time, inflation has fallen before unemployment. Even more remarkably, wage growth has also moderated, with the US employment cost index for private-sector wages and salaries falling for four consecutive quarters to 4.6% year over year, down from a peak of 5.7% last spring, though notably at still-elevated levels.

Chart 2: Some leading indicators turning positive

Chart 2: Some leading indicators turning positive Chart 2 shows the Institute for Supply Management new orders to inventories ratio spanning from 2010 to 2023. This leading indicator had been deteriorating since 2020, but has reverted to a more positive trend in 2023.

Source: ISM, Macrobond

What if there is no slowdown

Although markets appear to be focusing on the goldilocks scenario of a soft landing, our view is that another scenario may be forming, one where economic growth remains robust and more importantly, inflation may reignite. The Atlanta Fed’s GDPNow tracker suggests an acceleration of already strong real GDP growth of 2.4% in the second quarter. Part of the growth has been driven by a surge in US business spending led by construction in manufacturing factories (see Chart 3), especially in computer and electrical manufacturing but also in chemical and food. Part of this has come from fiscal policy through the CHIPS Act and Inflation Reduction Act, as governments have rediscovered the benefits of direct support to households and businesses. The US government budgetary shortfall reached $2.2 trillion in the 12 months to June, or about 8.6% of GDP. This amounts to a doubling in size over the past year, and this has not gone unnoticed at ratings agencies that have downgraded US debt. Finally, while excess household savings have been dwindling, they may continue to support consumer spending for the rest of the year.

Chart 3: Surge in buildings for manufacturing

Chart 3: Surge in buildings for manufacturing Chart 3 shows US non-residential construction spending for manufacturing, from 2006 onward. The series has been in an upward trajectory since 2006, but has surged significantly starting in 2022.

Source: US Census Bureau, Macrobond

Thus, the encouraging progress of decelerating inflation is not guaranteed to continue if growth remains resilient. We believe it is too early to declare victory and assign some risk to the possibility that inflation could rebound. To date, headline inflation has been helped by the drop in energy prices. Yet gas prices are moving higher alongside July’s 16% surge in WTI crude oil prices (see Chart 4). A similar story is unfolding in food prices with agricultural commodities also on the upswing. On the wage front, while we have seen a deceleration in wage growth, the list of labour stoppages has been growing, with port workers, pilots, hotel staff, screenwriters and actors, delivery couriers, auto workers and civil servants all taking strike action (see Chart 5). There are varied reasons behind the labour disputes including automation, job security and AI; however, wages not keeping up with inflation factors heavily in the decisions.

Chart 4: Bounce in inflation to come

Chart 4: Bounce in inflation to come Chart 4 shows the U.S. Consumer Price Index for Motor Fuel, represented on the left side, plotted against Brent Crude Oil price on the right side, spanning from 2015 through to 2023. These series track each other closely. A recent surge in Brent crude oil suggests a likely uptick in the CPI Motor Fuel index.

Source: BLS, ICE, Macrobond

Chart 5: Work stoppages have trended higher

Chart 5: Work stoppages have trended higher Chart 5 illustrates the number of days not worked by Canadian individuals due to work stoppages between the years 2010 and 2023. Since 2021, this series has been trending higher, reflecting more work stoppages in recent years.

Source: StatCan, Macrobond

To be clear, we still expect the lags in the impact of monetary policy to be extended but not eliminated and that central banks will achieve their inflation targets through a more pronounced economic slowdown. However, the probability of this outcome has diminished with the reasons outlined above, and the potential for a reacceleration in inflation should remain a risk scenario. What is notable, however, is that the markets appear content to price in a benign outcome focusing on sustained growth and easing inflation. The S&P 500 is up materially despite slowing earnings growth. Markets are calm – by the end of July, it had been more than 40 days since the S&P 500 declined by more than 1%. The VIX has collapsed despite the clear deterioration in leading indicators (see Chart 6). Given all these factors, we believe the risk is that markets will be disappointed with an outcome that falls outside the goldilocks soft-landing scenario.

Chart 6: Volatility collapsing even as many leading indicators remain negative

Chart 6: Volatility collapsing even as many leading indicators remain negative Chart 6 shows the US Conference Board Leading Economic Indicator plotted against the S&P 500 volatility index (VIX) which is inverted, going back to 1990. These series generally track each other quite closely, but have diverged meaningfully more recently.

Source: Conference Board, CBOE, Macrobond

Capital markets

Risk assets continued to rally in July, following on strong market sentiment. The S&P 500 and Nasdaq Index both posted gains for the fifth straight month. Data supporting a robust economic narrative have led to advances in every major sector within the indices and the growing breadth of gains is encouraging. Earnings so far have generally beaten expectations. As of the end of July, with half of the S&P500 companies having reported second quarter results, 80% of the companies reported a positive earnings surprise. Nevertheless, the magnitude of these positive surprises has been below average, with companies delivering cost cutting rather than top-line sales growth. The good news is that more recently, even the worst-performing sectors, such as energy, utilities and health care, are starting to see broad-based rallies.

Bond market indices declined as central banks continued to push rates higher. The FTSE Canada Universe Bond Index was down by 1.1% in July. During the month, the Bank of Canada, the US Federal Reserve and the European Central Bank each pushed rates up a quarter point. Even the Bank of Japan, with its yields still ultra low, tweaked its yield curve control policy to widen the band around 0% to one percentage point on either side. Following these moves, central banks now appear to be in a wait-and-see mode. Commodity markets were among the most notable performers this month, led by WTI crude oil, which surged 15.8% while Brent rose 14.2%. This is particularly notable as the recovery in China has been lacklustre and the prices were driven to some extent by the decline in supply.

Portfolio strategy

As with every late-cycle period, data will be volatile. But the recent trends have caused a material reassessment of the macro backdrop. While data releases have held in well and inflation has decelerated, the probability of a soft landing remains low. Either inflation rebounds along with resilient economic activity or an economic slowdown takes hold proving the lags to policy still hold true. Within our fundamental portfolios, we have made adjustments to reflect the divergent views. Equity portfolios have increased exposure to cyclical stocks, such as industrials and consumer discretionary, particularly those that have already reflected recession-like valuations and are positioned to gain from some of the themes highlighted earlier, including the strong capex cycle. Fixed-income portfolios are positioned for rising longer-term interest rates compared to shorter-term rates. Balanced portfolios maintain an overweight to cash, with underweights in equities and bonds. As we navigate through this period of shifting events, we will carefully assess incoming information to make informed decisions.

Row of modern houses in Vancouver BC, Canada

Housing IS the Business Cycle – September 2007 NBER Working Paper

Central banks are beginning to restart and accelerate their monetary tightening cycles. The Bank of Canada (BoC) surprised markets by increasing interest rates by another 25 basis points (bps) in June. In the BoC’s Summary of Deliberations, there was a robust debate on the reasons behind the unusually resilient consumer spending. The Governing Council discussed the role of excess savings, strong job and population growth and even statistical factors such as seasonal adjustments.

It is worth noting that a 2007 paper from the National Bureau of Economic Research (NBER) suggests that residential investment is the best early indicator of an impending recession. If this still holds true, then it would appear that we are currently in a recovery phase rather than experiencing stagnation. Home resales saw a consistent increase for four consecutive months to May, with home sales transactions up 1.4% from a year ago. This marks the first time since mid-2021 that home sales have shown positive annual growth. The increase is observed across various regions in Canada, with more than 75% of local markets experiencing growth compared to last year.

One of the contributing factors to this trend is the limited housing supply. New listings have declined by 13.6% over the past year and remain around 16% below the pre-COVID average. As a result, current market conditions favour sellers (see Chart 1). Many households seem hesitant to list their homes due to concerns about potential price decreases since their purchase, the inability to port a low-rate mortgage or the availability of rental properties in a strong rental market. Overall, this is a remarkable outcome, especially considering the nearly 4 percentage point increase in the posted 5-year mortgage rate. It seems housing, like the economy, is unusually resilient.

Chart 1: Low number of listings imply a return to sellers market

Source: CREA, Macrobond

In this respect, Canada is not unique. House prices in other global developed markets such as Australia, the US and South Korea, are also seeing a stabilization in house prices. This can be attributed to strong household finances and a structural preference for more living space as many continue to work from home. Thus, central banks are engaged in crucial debates surrounding the all-important question.

Are interest rates sufficiently high?

Canada’s economy has a particularly high proportion of sectors sensitive to interest rates, about 25% versus 21% in the US (see Chart 2), primarily due to the housing sector’s importance in Canada (see Chart 3). In addition to the global factors noted above, Canada has a number of unique factors that further bolster housing activity.

Chart 2: Canada has higher share of rate sensitive sectors vs. the US…

Source: NBF Economics and Strategy

Chart 3: …and relative to other countries

Source: OECD, Macrobond

Firstly, population growth has been consistently strong for the past three years, supported by immigration and an increase in non-permanent residents attending school or working on visas. Moreover, borrowers have been extending mortgage amortizations to delay the impact of higher interest payments that accompany rate increases. Even so, interest servicing costs have risen to historic highs, accounting for 15% of personal disposable income (see Chart 4). In its latest Financial System Review, the BoC noted that over a third of mortgages had already been reset or affected by higher interest rates as of May this year. Looking ahead, its modeling shows that this figure will rise to 47% by the end of this year. Furthermore, due to the influx of homebuyers during the pandemic, this will apply to nearly everyone between 2025 and 2027 (see Chart 5).

Chart 4: Canadian debt servicing costs are back at their highs

Source: StatCan, Federal Reserve, Macrobond

Chart 5: Nearly all mortgage payments will increase over the next 3 years

Source: BoC

Consequently, debt service costs are almost certain to rise for the 35% of households that own their home and have mortgages.

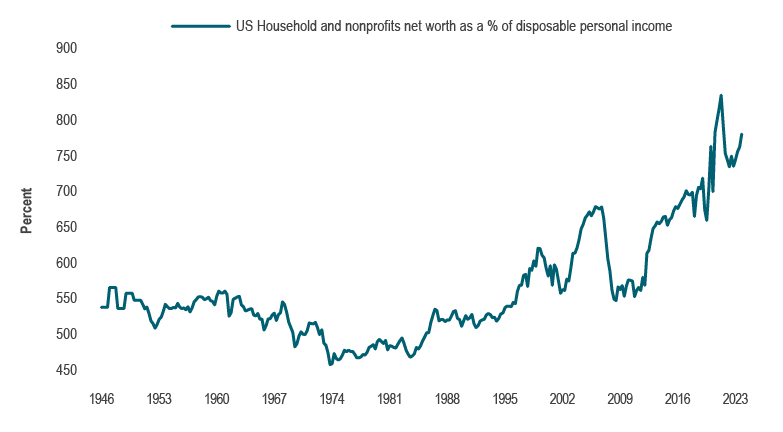
While the adjustments will undoubtedly be challenging, we believe the worst outcomes are likely to be avoided. Homeowners will have built some equity and household net worth has surged to $15.7 trillion, a 27% increase since the end of 2019 (see Chart 6). As a result, debt levels as a proportion of assets remain manageable (see Chart 7). Indeed, new mortgages were stress-tested to ensure affordability with mortgage rates near current levels of 5%. The excess savings that emerged from limited spending and extensive fiscal support during the pandemic were substantial. Although diminishing, excess savings are estimated to be around $25 billion, with a significant portion redirected into term deposits and other assets like equities. Perhaps most fundamentally, both employment and real household incomes have grown materially, by about 5% since 2020.

Chart 6: Household net worth has surged

Source: StatCan, Macrobond

Chart 7: Debt levels are high, but asset values have also grown

Source: StatCan, Macrobond

However, the Canadian household sector diverges starkly from the US. While high housing demand has led to a similar increase in housing starts, household balance sheets differ. Effective mortgage rates paid by US households have remained relatively flat due to the prevalence of 30-year fixed-term mortgages, leading to lower debt and debt servicing costs (see Chart 4 again). Nevertheless, a short-term risk arises from the recent Supreme Court decision to reverse student loan forgiveness, implying that this cohort of consumers will face resumed loan repayments. A recent survey indicated that 40% of respondents were unaware of this ruling and unprepared to resume payments. Estimates suggest that interest on student loans amounts to between $64 billion and $96 billion annually, which would reduce total after-tax incomes by approximately half a percent.

The stability of housing markets has been remarkable, defying the conventional wisdom that a more indebted country like Canada would be more vulnerable to higher interest rates. While savings, employment, asset values and immigration demand have all supported the real estate market to date, they will not fully offset the impact of rising debt servicing costs as excess savings dwindle. We still believe a recession still lies ahead, with the potential silver lining that the BoC may have less work to do going forward.

Capital markets

Following a strong and volatile first quarter in asset markets, the second quarter was calmer. Market enthusiasm seen in the first half of the year reflects the view that economic activity will be sustained as inflation eases. Resilient economic data played a role in supporting corporate earnings. Notably, asset value gains became more narrowly-driven by specific themes, particularly the growing enthusiasm in artificial intelligence (see June Outlook). This resulted in market leadership being centred on large-cap technology stocks, which significantly outperformed the broader equity market. Thus, while the S&P 500 Index rose by 8.7% in Q2, the tech sector accounted for the majority of this gain, surging by 17.2%. On the other hand, the Canadian equity market lagged its global counterparts due to its relatively limited exposure to technology companies. Still, cyclical stocks, such as consumer discretionary, industrials and financials outperformed defensive sectors. Indeed, the breadth of the equity rally has been better in Canada this year, as the S&P/TSX outperformed the S&P 500 in six of the eleven major GICS sectors year-to-date. Commodities were largely flat, but oil prices were down for the second consecutive quarter.

Global fixed-income markets were caught off guard as central banks resumed or accelerated rate hikes in response to resilient economic activity and persistently high inflation. The BoC raised its target overnight rate by 25 bps to 4.75%, and both the BoC and the Federal Reserve indicated that rate hikes were not yet over. Bond yields increased significantly in the second quarter, led by shorter-term yields, resulting in yield curve inversions reaching levels not seen since 1990. Even with tighter credit spreads that were helped by low supply and strong demand, the FTSE Canada Universe Bond Index fell -0.69% in the second quarter.

Portfolio strategy

While the cyclicality of housing lends itself well to predicting economic cycles, various financial flows and consumer preferences have prevented housing markets from experiencing the full effects of higher interest rates, which has posed a challenge for central banks. Indeed, Canada’s economic resilience is particularly noteworthy considering high household debt levels. However, the link between higher rates and an economic slowdown, although delayed, is unlikely to be eliminated. Historical trends show that unemployment rates tend to remain low until the onset of a recession and even a 0.5 percentage point increase can trigger a recession. The renewed efforts by central banks to further raise rates at this stage of the tightening cycle, while suggesting the need for sustained high rates, increase the risk of a hard landing. 

As a result, we anticipate declining profit margins as wages continue to add pressure and pricing power diminishes. Consequently, we maintain a cautious outlook for equities and expect weaker earnings in the upcoming quarters. In Canadian equity portfolios, we favour companies that are likely to consistently deliver earnings in a low-growth environment. At the same time, we continue to search for companies whose valuations reflect the anticipated slowdown or align with our secular themes, such as rising business capital expenditure. The latter includes companies involved in rebuilding supply chains and advancing the transition to green energy sources.

In fixed income portfolios, we have started to position for a broader steepening of the yield curve while maintaining an underweight exposure to credit. Both of these positions should benefit portfolios as we approach a recession. Our balanced portfolios remain underweight equities and fixed income, with a preference for cash. While the economic stability has been welcomed, market optimism suggests that it will continue. In our view, the downside risks are gathering pace.

Person Kayaking on a scenic lake at sunset in Golden Ears Provincial Park, near Vancouver, British Columbia, Canada.

An Apple (plus FAMNNGT*) a day keeps the doctor away.   

Recession talk has given way to discussions on the resilience of economies and the reasons behind it. The reasons include excess household savings, companies holding on to workers, reduced labour market friction with the ability to source skilled workers remotely and still obliging fiscal support. Equity markets, especially in the US, have broadly cheered the economic stability. As growth defies expectations, the S&P 500 Index has risen 11% year-to-date (YTD), which lags the even more buoyant European and Japanese equity markets. The upbeat sentiment was helped, at least until mid-May, by interest rates that took a breather to start the second quarter following a turbulent first quarter. This equity market resilience has come despite the counterpart to economic strength: inflation. Both the US core PCE Deflator and the Federal Reserve’s (the Fed’s) “supercore” measure, which follows underlying services prices excluding shelter costs, are struggling to fall below 4.5% year-on-year.

The equity market enthusiasm has been supported by strong fundamentals compounded by a new bullish narrative surrounding anything related to artificial intelligence (AI). Indeed, there has been a rotation in market leadership since early in the year from energy, materials, financials and industrials to the technology juggernaut. To be sure, our fundamental outlook is supportive of the significant opportunities arising from AI-induced productivity enhancements. It is also aligned with our secular theme of the coming capital spending boost, that to date had encompassed building resilient and redundant supply chains, alongside greening of energy sources and now investments incorporating AI.

More recently however, equity market leadership has become extremely narrow. One way to see this is in the performance of the S&P 500, where constituent weights float with the market capitalization. The S&P 500 is up 10% YTD as of the end of May. However, when each company in the Index is given equal weight, the Index has slightly negative performance for the same period, creating a gap of a hefty 10 percentage points (see Chart 1). Another way to illustrate this is by splitting the S&P 500 into the top eight performers and the remaining 492 companies (see Chart 2). The market value of these eight megacap tech stocks as a share of the Index has surged from 22% in January to 30% in June.  

Chart 1: Largest capitalization stocks driving gains
Indexed at 100 on 12/30/2022

Chart 1 shows the S&P 500 (market cap-weighted) index and the S&P 500 equal-weighted index, each rebased at 100 on December 30 2022. More recently, the S&P 500 (market cap-weighted) index has significantly outperformed the S&P 500 equal-weighted index.

Source: S&P Global, Macrobond 

Chart 2: Megacap tech stocks have surged
Indexed at 100 on 12/30/2022

Chart 2 shows an index of the megacap tech stocks in the S&P 500 (AAPL, MSFT, AMZN, GOOGL, META, TSLA, NVDA, NFLX) compared to the index as a whole, and then also an index of the remaining 492 companies in the S&P 500. Each series is indexed at 100 on December 30 2022. Since the start of 2023, the top 8 megacap stocks have surged, which has pulled the whole S&P 500 index higher. The index of the remaining 492 companies has lagged the other two series over the same period.

Source: S&P Global, Macrobond 

Only a handful of companies driving the Index’s is not healthy. When market breadth is broadly based, it is a signal of broad-based growth across various industries and the overall economy. In contrast, the increased concentration of market leadership implies rising risk and scarcity of growth. Evaluating the premium valuations of these high-flying stocks becomes challenging, as their prices become disconnected from fundamental historical relationships. Indeed, if AI is a ‘gamechanger’ in terms of the way companies will operate, productivity benefits should accrue broadly, and not only within the immediate AI-winners. We do not disagree with the potential upsides to come from the AI revolution, but this current market rally appears fragile, despite a recent improvement in market breadth in early June.

Short-term hazards remain

There is growing evidence of credit contraction (see April Outlook), and a recession continues loom closer. While the latest earnings season provided better-than-expected earnings, corporate profits are set to decline during an economic downturn. The vast majority of companies in the S&P 500, the “S&P 492,” may not be buoyant, but they have also not yet fully priced in the economic slowdown, as earnings forecasts remain optimistic. Interest rates are once again on the upswing as central banks reassess whether current levels are sufficiently restrictive (see May Outlook, as well as recent moves by the Reserve Bank of Australia and the Bank of Canada).

More immediately, the resolution of the US debt ceiling gridlock has buoyed sentiment, but also presents a potential market risk. While the US Treasury was prohibited from borrowing after hitting its limit, it had to deplete its chequing account held at the Fed, known as the Treasury General Account. The balance of this account stood at approximately US$39 billion at the end of May and needs to be replenished to about $600 billion. In addition, the Treasury was unable to issue bonds since hitting the debt ceiling. Now that issuance has resumed, this new bond supply comes at a time when banks are being asked to raise cash reserves to avoid further bank failures. Coupled with ongoing quantitative tightening, elevated recession risks and already high valuations, liquidity will be withdrawn from the markets, posing short-term risks.

Capital markets

Apart from the enthusiasm over AI-fueled tech stocks, markets were generally weak during a month with no shortage of headlines. Most notable were the US debt ceiling negotiations, which created significant stress on US one-month T-bills, causing their yields to surge to 7% at one point. However, the resolution and the smooth passage in the House of Representatives and Senate were welcomed by markets. The month also saw consistently higher-than-expected inflation readings and decent momentum in economic activity, which led to interest rate hikes from both the Fed and the European Central Bank (ECB). Additionally, there were renewed concerns over US regional banks earlier in the month, as First Republic Bank, the third bank to fail, was acquired by JPMorgan.

While the tech sector exhibited remarkable strength, equity markets saw little upside elsewhere. The Nasdaq Composite Index headed up the leaderboard with a 5.9% gain, with megacap tech stocks also helping the S&P 500 stay positive. Elsewhere has been marked by sell offs. Commodity prices have been declining, due to a weaker-than-expected economic reopening in China and a contraction in German GDP. Energy prices continued to slide as WTI fell 11.3% in May and metals such as copper declined by 6%. As a result, the materials and energy sectors were among the worst performers.

In Canada, bank earnings releases were below consensus expectations, putting downward pressure on the financial sector. Consequently, financials, in tandem with energy and materials, pulled down the broader Canadian equity market. The S&P/TSX Composite Index declined 4.9% in May, with only the information technology sector delivering a positive return.

Economic releases, including inflation data in both Canada and the US showed strength, with inflation notably rising due to contributions from services and an unexpected increase in goods prices. This put upward pressure on interest rates. The Fed raised its target interest rate by 25 bps to over 5%, and is now in a range consistent with the Fed’s March projection of its terminal rate. Bond yields climbed across the yield curve, with two-year yields up 52 bps in Canada and 33 bps at the 10-year term. Credit performed well as demand rebounded, providing support for spreads. The FTSE Canada Universe Bond Index declined 1.69% in May.

Portfolio strategy

Key indicators of jobs and growth are broadly positive, although there is conflicting data across various economic indicators, including manufacturing surveys and leading indicators. During the late stages of business cycles, it is common to see volatile and contradictory data as different sectors experience the lagged impact of higher interest rates at different times. The full effects of the rate hikes over the past year have not been fully felt by the economy, and certain factors, such as extended amortizations for some variable-rate mortgages in Canada, are mitigating the direct impact of monetary tightening. Nonetheless, tighter lending standards by banks and central banks’ resolve to control inflation suggest that a recession is likely within the next year.

We maintain a cautious outlook for equity markets, anticipating declining profit margins, sticky wages but diminished pricing power, and further negative earnings revisions in the coming quarters. Thus, balanced portfolios remain underweight equities. Fundamental Canadian equity portfolios remain focused on stability and own companies with resilient earnings and dividend profiles. Fixed-income portfolios are underweight corporate and provincial bonds. While the equity market has demonstrated remarkable resilience to date, it is becoming increasingly evident that risks to equities persist beneath the surface. We are therefore taking a more cautious approach to portfolio positioning.

*Acronym for the current largest capitalization technology stocks (Apple, Facebook/Meta, Amazon, Alphabet/Google, Microsoft, Netflix, Nvidia, Tesla).

Summer in Coal Harbor in downtown Vancouver, Canada.

Cautionary signs from abroad.

The Bank of Canada (BoC) began tightening policy in March 2022, ahead of most major central banks and has recently been among the first to pause. However, there have been some surprising developments in other countries over the last month, and it is worth examining whether they have any implications for Canada.

For instance, the Bank of England began raising rates even before the BoC. Like Canada, the UK is sensitive to interest rate increases, particularly as mortgage interest rates are typically fixed for two to five years. Despite Brexit reducing mobility overall, the UK saw a net migration inflow over the past year, leading to a 0.65% population gain. Although slightly higher than pre-pandemic levels, this growth is far from the 2.7% population increase seen in Canada. Furthermore, the UK economy has slowed but is facing the highest inflation rate in Europe and one of the highest inflation rates among developed markets, with the CPI annual rate stalling at over 10% year over year (y/y) in eight of the last nine months (see Chart 1). Core inflation is at 6.2%, not far from its 30-year highs of last summer. The implication that inflation is difficult to wrestle is potentially concerning, yet UK inflation has remained high in no small part due to extended supply pressures emanating from Brexit and more rigid trade rules.

Chart 1: UK inflation highest among developed peers

Source: Statistics Canada, Australian Bureau of Statistics, UK Office for National Statistics, Statistics New Zealand, Macrobond

In early April, the Reserve Bank of New Zealand (RBNZ) surprised the market by increasing the Official Cash Rate by 50 basis points (bps) to 5.25% due to concerns over higher near-term inflation readings. Supportive fiscal policy combined with rebuilding after recent storms may add fuel to upside pressures. The RBNZ has matched the Federal Reserve (Fed) for the largest cumulative rate hikes and may still increase rates further.

In Australia, the central bank paused in April, but quarterly inflation reports for both headline and its core metric of trimmed CPI, while modestly lower than expected, still exceeded the central bank’s targets at 7% y/y and 6.3% y/y, respectively. In early May, the Reserve Bank of Australia surprised the markets with a 25-bps rate hike, taking the target cash rate to 3.85%, citing high services prices as a concern. It noted that inflation may take “a couple of years” to return to the top of its target range. 

Are higher rates a material risk?

Canada is, like many other countries, currently adjusting to past rate hikes. On the surface, the country has appeared resilient in the face of short-term adjustable rate mortgages, high sensitivity to interest rate increases because of large debt, and its broad exposure to the cyclically-sensitive commodities sector. In spite of these factors, there have been no banking stresses, fewer mass layoffs and no sharp rise in mortgage delinquencies. But as with countries elsewhere, at least for the near term, we should not underestimate the potential for a surprise on the side of further policy tightening. Indeed, the April BoC Summary of Deliberations showed that the discussion leaned towards whether rates needed to rise again. There are reasonable arguments for this.

While it may be too early to call it a trend, the Canadian spring housing market appears to be picking up steam. New listings to start the spring season were the lowest for any March over the past 20 years, and demand from natural household formation and new immigrants has been strong. This has coincided with a peak in mortgage rates as the BoC stopped hiking rates. Five-year mortgage rates have fallen from last October’s peak of 5.88%, with the latest 75 bps of BoC rate hikes having little effect. As a result, house prices in major cities have risen for the last two months.

Fiscal policy is adding stimulus, with provincial governments adding about $6 billion in new support measures and tax reductions and the federal government more than doubling that to $13 billion. These support measures are delaying a material slowdown and working against tighter monetary policy. Perhaps the most important lesson we take from other countries is that overall inflation is still at risk of remaining above target, particularly with Canadian economy-wide average hourly wages running at over 5% (see Chart 2).

Chart 2: Strong Canadian wage growth risks above target inflation

Source: Statistics Canada, Macrobond

While we view the most likely scenario to be no further rate hikes, the longer inflation is above the explicit target, the more extrapolative expectations become, making it harder to bring inflation under control. So even if the BoC does not surprise with more rate hikes, there is a risk that monetary policy will be held tighter and rates higher for longer. This is not being priced into markets. The implications for asset prices are material; the longer rates are held high, the more stresses build and the harder it is to push problems down the road.

Capital markets

After three of the largest four US bank failures in history, it is surprising that April was one of the calmest months in markets. Volatility indices for both bond and equity markets eased, evidenced by the daily and monthly change in prices. Two areas stood out: US regional bank stocks continued to fall, led by First Republic. Secondly, the quiet world of US T-bills reflected anxieties surrounding the US debt ceiling limit. Investors kept purchases below one month to avoid debt ceiling default risk, pushing yields down and the spread to 3-month T-bills to historic wide levels.

Bond yield changes were subdued in Canada over the month, while corporate credit spreads tightened, leading the FTSE Canada Universe Bond Index to rise 0.98%. A decent corporate earnings season contributed to the sanguine market sentiment and equity markets recovered from the March upheaval. The MSCI ACWI Index gained 1.4%, led by developed markets. The S&P 500 Index rose 1.6%, although breadth was narrowly concentrated in the technology sector, which was buoyed by lower interest rates that helped boost valuations. In Canada, the S&P/TSX Composite Index outperformed, rising 2.9%. Commodities were generally weak in April, except for oil prices, where the OPEC+ group cut output at the start of the month, leading WTI to hit a peak of US$83/bbl. This was short lived and prices eased back to close the month nearly unchanged.

Portfolio strategy

Similar to other economies, Canada’s late cycle environment presents risks that are not one-sided, and central banks are unlikely to intervene aggressively in a slowdown. While recent economic releases suggest momentum is slowing, consumers are gradually using up their excess savings and businesses are exercising restraint in spending, which is a process that takes time. Meanwhile, inflation remains stubbornly high and we do not anticipate significant interest rate cuts in the near future. Our outlook indicates that a recession is the most probable scenario for the latter half of 2023.

In our fundamental equity portfolios, we continue to look for companies with strong fundamentals that can navigate slower aggregate economic growth. Our portfolio positioning emphasizes defensive strategies, with earnings stability a crucial theme at both the sector and security level. However, we are also exploring opportunities to invest in oversold cyclical companies that will likely perform during an economic recovery. Our fixed-income portfolios follow a similar theme, focusing on corporate bonds while we remain patient in our macro positioning given the possibility of tighter lending during a recession later this year. Our balanced portfolios maintain an underweight position in equities in favour of cash. We continue to assess both domestic and global data and seek out opportunities in both calm and volatile markets.

Illuminated Abstract office building seen in downtown Vancouver, BC, Canada.

Averting crisis, but anxious about credit.

The US Federal Reserve (Fed) and Bank of Canada (BoC) have raised their overnight rates at the fastest pace since the 1980s. As we passed the one-year mark since the start of this rate hiking cycle, the economy and financial system appeared stable and even resilient, and markets bore the scars as higher rates led to declines in valuation multiples throughout 2022. While there have been some signs of strain, such as UK pensions, the Bank of England’s (BOE) rapid response curtailed negative outcomes. Additionally, the collapse of cryptocurrency exchange, FTX, was less related to interest rates than fraud. However, this past month’s failure of three banks: Silicon Valley Bank (SVB) and Signature Bank in the US, followed by Switzerland’s Credit Suisse being forced into a merger with its long-time domestic rival, UBS, marked somewhat of a turning point.

In comparison to prior crises, today we are at a better starting point. Issues with US regional banks are not the same as during the Great Financial Crisis (GFC), when banks held assets that were complex, massive, interlinked and then severely impaired. The legacy of those problems was a shift to tough regulatory requirements for large global banks. They now have deeper capital bases that can better withstand inevitable recession-induced asset write-downs. However, recent instability is reminiscent of more classic problems, such as outflows of deposits from banks when the rates paid do not rise in line with policy rates, combined with an inverted yield curve that impacts bank margins.

Over the weeks surrounding the stresses on the US regional banks, data releases showed depositors moved more than US$400 billion out of bank deposits (see Chart 1), with two-thirds of the outflows coming from small and mid-sized banks. Most of those flows went into financial assets that now yield higher returns than bank accounts (see Chart 2), notably money market funds. This outflow of deposits is forcing banks to sell assets and recognize losses in bond holdings due to the rise in interest rates. The Fed has taken steps to prevent the situation from worsening. Banks are now borrowing at the Fed’s discount window or using the newly established Bank Term Funding Program that was created to provide banks with a liquidity backstop. Although the rate of borrowing at the discount window remains elevated, the exodus of bank deposits slowed by the end of March and the problems have become less acute. This turmoil will require banks to bolster deposits. One way to do that is to raise interest paid on deposits, which may result in a higher cost of funding and pressure on profitability.

Chart 1: Deposits have been leaving banks at a rapid clip

Source: Federal Reserve, Macrobond

Chart 2: Deposit rates not keeping up with policy rates

Source: Federal Deposit Insurance Corporation, Federal Reserve, Macrobond

Following the banking instability, central banks seemed to face a choice between price stability (raising rates to combat stubbornly high inflation) or financial stability (injecting stimulus to save a precarious financial system). Separating out tools to deal with these two problems, they have continued to raise rates even in the face of the bank failures. What has made this whole situation a turning point, however, is that this turmoil has brought markets into a position where they are now working with the Fed rather than against it. The Fed has persistently stated that inflation remains high and financial conditions will need to tighten, and markets rallied and credit spreads stayed tight allowing for the economy to remain supported rather than constricted. Now, markets appear to be heeding the warning signs. Credit markets have seen decreased issuance and wider credit spreads.

It is worth noting that a key link in the transmission of central bank actions and the economy is through bank lending. The Fed’s Senior Loan Officer Survey shows that banks have been tightening lending standards for months now (see Chart 3). Given concerns about liquidity, outflows of deposits into money market funds, costlier sourcing of funds, net interest margin pressures and weakening demand, banks are likely to pull back further on lending activity in coming quarters. This will directly dampen prospects for business investment and consumer spending to varying degrees. One sector that may be particularly impacted is commercial real estate lending. While shifting demand for office space is one factor, it is notable that smaller US regional banks with assets under US$250 billion hold about three-quarters of total commercial real estate loans. While this segment represents approximately one quarter of overall loan books, the combined supply and demand pressures imply a vulnerable sector. Overall, the message is clear: lending will be scarcer economy-wide, and an economic slowdown to recessionary levels is now looking increasingly likely.

Chart 3: Lending standards tightened to levels typically preceding recessions

Lending standards tightened to levels typically preceding recessions Chart 3 displays a pattern of US lending standards becoming more strict starting in mid-2022. The chart highlights this trend by demonstrating recently tightened lending requirements in three important categories from the Federal Reserve Senior Loan Officer Survey: commercial real estate, consumer credit cards, and household auto loans.
Source: Federal Reserve, Macrobond

Capital Markets

Both riskier equities and safe-haven bonds have performed well over the past six months, benefiting from a sharp repricing of short-term interest rate expectations. However, this does not necessarily signal that all is well as there has been considerable volatility in the interim. Persistently high inflation led Fed Chair Powell to assert in March’s semi-annual congressional testimony that the Fed may increase the pace of rate hikes, resulting in expectations of a 50 basis-points (bps) move that pushed yields to a high of over 5% and the endpoint of rate hikes to 5.69%. After the recent bank events unfolded, expectations flipped. Two-year Treasury yields posted their single-largest, one-day drop since 1982 with Canadian yields closely following suit. For March overall, two-year yields declined by 48 bps and 10-year yields by 43 bps. This helped the FTSE Universe Bond Index rise 2.16%.

The flight to safety that was triggered by the US bank run similarly helped gold prices surge by 7.8% and silver prices by 15.2% in March. Meanwhile, energy prices declined, especially oil prices, which fell by 7% for the quarter. Natural gas prices experienced a sharp retreat, especially in Europe despite strong economic activity data and the reopening of China’s economy. The softening in energy prices was short-lived as oil rebounded within the first days of April due to OPEC’s surprising announcement of a material cut in supply.

Risk assets posted strong performance in March, with the MSCI ACWI Index up 2.5% and the S&P 500 Index closing up 3.7% in local currency terms despite regional bank stocks plunging 35.6%. Notably, even though the epicenter of the bank failure was in California’s Silicon Valley, the tech-heavy Nasdaq Index was up 9.5% in March as tech stock valuations benefited from the fall in rates. On the other hand, the S&P/TSX Composite Index was nearly flat, declining 0.2% during the month. The large weight of banks and energy in the Index was a drag on overall gains.

Portfolio Strategy

In light of the continuing effects of aggressive tightening by central banks over the past year and the recent turmoil in the US’s and Switzerland’s banking sectors, we anticipate even tighter lending standards than already posted in the second half of 2022. An economic downturn seems now more a question of “when” rather than “if”. Even as we approach the period of recession, the equity risk premium (ERP), which is the additional return demanded above lower-risk bond yields, has remained surprisingly unchanged despite recent events. While the ERP is holding in at recent average levels in Canada, it remains low in the US. As the ERP rises in response to slowing economic activity, valuation multiples will be pressured lower, compounding lower earnings. As a result, we maintain an overall underweight position in global equity markets in our balanced portfolios. We also have a modest underweight position in fixed income and are overweight in cash. In our fundamental equity portfolios, we continue to favour companies that offer stability with resilient earnings and dividend profiles.

The recent volatility in fixed-income markets has reflected a high level of uncertainty, with narratives that oscillate between expectations of further central bank rate hikes, or rate cuts mid-year. Our fixed-income portfolio decisions have been guided by valuation forecasts in line with our unwavering outlook for a mild recession, and our belief that central banks are nearing the end of their tightening cycles, although we do not foresee interest rate cuts in the near term. We remain underweight credit and have a modestly short duration position.

We anticipate that contracting lending standards will support central bankers’ goals of slowing the economy. We will closely monitor and assess the conditions around the economic slowdown to gauge what the recovery may look like and position portfolios accordingly.

Lessons of history must sometimes be learned, unlearned and relearned.

The recent market cycle can be characterized by numerous unusual aspects. Many of these relate to being in a highly inflationary environment for the first time in more than 40 years, a climate that predates the majority of today’s market participants. For instance, the pace of rate hikes in the past 12 months by both the US Federal Reserve and the Bank of Canada has been among the fastest since 1980, but by some metrics has done little to quell inflationary forces. The most recent strength of activity data in January cast doubt on the likelihood of a recession scenario; however, we remain confident that the tightening in policy will bring the current high levels of inflation to heel with a modest recession. In addition to the direct impact on the economy, we are also seeing unintended strains in areas such as UK pension and US regional banks, the latter of which took excessive unhedged risks with safe assets like US Treasuries! We believe the process to get to the recession will be non-linear and repeat history lessons that investors must unlearn before relearning the signals and correlations under high inflation.

Inflation is acting as a moderator 

Counterintuitively, some features of inflation seem to be acting as a cushion to growth and auger for the delayed onset of a recession. As an example, those receiving inflation-indexed incomes, such as retirement planholders, just saw their monthly payouts increase and could have temporarily boosted their spending in nominal terms. Moreover, inflation rates are, very unusually, coming down before a recession has set in. Inflation typically lags, falling only after corporate profits are squeezed, workers are laid off and a recession starts. This year is different, with the clearing of supply chains helping headline inflation fall from high single-digit peaks to the most recent three-month trends of just over 3%. Thus, even before the full effects of policy are felt, an easing of inflation could provide some support to real labour income in this late-cycle period.

For companies, it is worth noting that earnings-per-share contractions during the 1970s and 1980s recessions were milder than those in the 1990s and beyond. The worst post-war recessions averaged declines of approximately 16% whereas since the 1990s, a period of substantial economic and inflationary moderation, earnings plunged 30% to 35% on average (see chart 1). Undoubtedly, these more recent precipitous drops resulted from the multiple financial crises compared to the more standard policy-induced recessions from previous decades. Nevertheless, inflation provides some cover for firms to raise prices and guard some of the profit margins and earnings that come under pressure during downturns. Inflation also reduces the future value of corporate and personal debt, and higher rates may encourage the paying down of some debt with excess savings, helping overall balance sheets.

Chart 1: Earnings contractions during recessions

This chart shows the annual change in S&P 500 earnings per share dating back to 1950, with US recessions shaded. The decline in earnings per share during the 1970s and 1980s recessions were more moderate compared to more recent recessions
Source: S&P/Robert Shiller, I/B/E/S, Macrobond
Note: Shaded areas represent US recessions.

So, are we going to avoid a recession?

In our view, a recession is within our forecast horizon and we believe that the market is currently seeing a reversion to norms that is sending important but confusing signals. Predictive data on recessions tends to draw from goods-producing sectors. Business cycles that are driven by tightening monetary policy are led into recession by borrowing-driven sectors, such as homes, automobiles and major appliances. Unsurprisingly, about half of the world’s purchasing managers’ indices are in contractionary territory, as are developed markets’ housing resales, and auto and retail goods sales.

A classic predictive data point is The Conference Board Leading Economic Index (LEI, see chart 2). Since 1960, the LEI has never given a false recession signal, after declining year-to-year for three consecutive months. As of January, it has declined for seven months. This seems at odds with the current bout of strong activity data. Of the 10 components that make up the LEI, four relate to goods sectors: manufacturing hours worked, manufacturing new orders, non-defense capital goods orders and building permits. The rest are financial or consumer expectations. Yet in the last couple of years, personal consumer spending in the US has swung first toward goods and now services, with a focus on hotel and travel, personal care, health care, air travel and recreation, public transportation and restaurant dining over the last six months. Similarly, in that blockbuster January employment gain of 517,000 new jobs, all services sectors posted monthly gains, led by leisure and hospitality that accounted for 128,000 (25%) of those jobs. Notably, goods-producing sectors have declined in importance as the economy has matured, with their proportion of gross domestic product down about five percentage points in both the US and Canada over the last decade (see chart 3). Some signals, while not wrong, may instead be skewed by the unusual normalization of spending and delay the arrival of the business cycle ending recession. Nonetheless, for us, this remains a key indicator to be attentive to.

Chart 2: Never seen annual decline in LEI without recession

This chart shows the year-over-year change in the Conference Board Leading economic indicator, starting in 1960, with US recessions shaded. The indicator has declined on an annual basis during prior recessions. More recently, the LEI has turned negative.
Source: Conference Board
Note: Shaded areas represent US recessions.

Chart 3: Goods-producing sector on the decline

This chart shows the proportion of goods-producing industries as a percent of GDP for both Canada and the US, starting in 2006. Both of the series have steadily declined within this time frame.
Source: Statistics Canada, BEA, Macrobond

Two more comments are worth noting. First, the last few market cycles have created an expectation that central banks will act and that information is absorbed and reacted to instantly. Impatience stands at odds with the long lags associated with monetary policy actions, especially during periods when it seems like we are collectively working to limit the damage. Some companies appear to be holding on to workers, fearful of being unable to hire again. Chartered banks in Canada are now extending variable-rate mortgage terms to over 35 years to help keep payments unchanged in the short term. Secondly, the path to a recession can closely resemble a soft landing. It is common for investors to operate on the hope of escaping a recession through the late-cycle period. This becomes especially true when data signals are skewed by extraordinary pandemic policy or an unfamiliar inflation environment. Synthesizing the available information, we continue to believe that policy will be effective eventually and thus remain cautious in our approach.

Capital Markets

What January gave, February at least partly took away. Positive market sentiment about the potential end to rate hikes turned to fear that exceptionally strong economic momentum is a sign that the rate hikes to date have been insufficient. While inflation over the last three months has eased, sustained strength in wages combined with anemic productivity demonstrate the continuing fight. Concerns remain even in Canada, where 5.9% headline inflation year-over-year currently represents one of the lowest rates among developed countries.

As a result, 10-year yields pressed higher in February, up 41 basis points (bps) in Canada and 43 bps in the US, more than reversing January’s decline. Corporate and provincial credit spreads help up well, leaving the FTSE Canada Universe Bond Index down approximately 2%, although year-to-date returns are up 1%. Equity market volatility contributed to the month’s 2.4% decline in the S&P/TSX Composite Index. Year to date, the Index is still up 4.8%. February’s caution was evident through more defensive leadership as consumer staples, utilities and real estate outperformed while materials, technology and energy underperformed. Notably, milder weather eased the energy complex, softening commodity prices across the board. Despite European inflation pushing higher, at 8.6% year-over-year in January, and U.K. inflation still stubbornly above 10%, the MSCI EAFE Index outperformed, led by Europe-based stocks. The MSCI EM Index fell 4.6%, giving up some of its late-2022 advances. The S&P 500 Index fell 2.4% but remains up 3.7% year to date. The potential shift in central bank sentiment to renewed hawkishness helped stabilize the U.S. dollar. After declining for four consecutive months, the US Dollar Index was up 2.7% in February.

As we headed into March, multiple crypto and tech related financial institutions (First Republic, Silvergate, Silicon Valley Bank (SVB) and Signature Bank) reported distress related in part to the withdrawal of liquidity and the rapid rise in interest rates as central banks tightened policy aggressively. Of these, the US$319 billion in assets at SVB is particularly notable as it represents the second largest bank failure in US history. The confluence of reduced demand for loans, elevated withdrawals, and challenging capital raising circumstances forced the bank to sell what were formerly risk-free assets, ie. US Treasuries. Ultimately, SVB ran into liquidity problems and was shut down by regulators. The Federal Deposit Insurance Corporation (FDIC), Treasury Department and Federal Reserve have acted swiftly to ensure depositors would have access to all their funds signalling their support to the beleaguered regional bank industry in the US. Equities globally were hit, though the declines were felt most significantly in regional bank stocks in the US; the S&P 500 is down over 5% since its early March peak. Bond markets, meanwhile, have now significantly repriced expectations for Fed rate hikes for the fourth time in about four weeks. In the aftermath of the first few days of the crisis, two-year Treasury yields plunged 75 bps, and it is no longer clear the Fed will put through any more rate hikes.

Portfolio Strategy

In terms of asset mix, balanced portfolios continue to hold an underweight in equities against cash. The equity market surge earlier this year was supported by optimism about a soft economic landing. Equity gains were led by multiple expansion as corporate earnings softened as expected. Following January’s rally in risk assets, we added to the equity underweight, reducing global equities exposure in favour of bonds. Some of the positive influences of inflation discussed above serve to highlight that the path can include skewed signals and red herrings. With policy only beginning to tighten a year ago, we may have yet to feel its full effects and are only now seeing consequences of the sharp drop in Treasury prices on various parts of financial markets. We reduced the underweight in fixed income based on improved valuations and the interest-rate backup that now provides a decent yield. Bond portfolios continue to be traded tactically, extending duration through the backup in yields, particularly in Canada. Equity portfolios maintain their focus on stability and resilient earnings, particularly through the current turmoil. Recognizing the positive impact globally of the reopening of China’s economy, exposure to companies in the commodities and industrial sectors has been increased. We continue to see opportunities through the volatility and the market’s relearning all of the various challenges of inflation.

Vancouver's Granville Island bridge at night with skyscrapers and marina with boats.

We recently published our 2023 Financial Markets Forecast, which presents a comprehensive review of our investment thinking for the year to come. Therefore, as in years past, we devote the February edition of Outlook to providing an annual update on organizational developments at Connor, Clark & Lunn Investment Management (CC&L).

President’s Message

Martin Gerber.

Over the past three years, the global economy and capital markets have endured a series of significant macro shocks—COVID, recession and war. These forces have resulted in volatile markets.  While most market participants and pundits tend to focus on the near-term cyclical consequences emanating from these macro forces, it is worth noting that we are also witnessing a much longer term, secular shift in the geopolitical, economic and market landscape. This is important because it has the potential to impact markets for years to come and may require adjustments to portfolio strategy.

During COVID, governments and central banks introduced synchronized, unprecedented stimulus via both fiscal and monetary policy.  At the same time there has been a seismic shift in the global geopolitical climate with the U.S. no longer being the single dominant global superpower. As an outcome of this, we are witnessing increased tensions in many regions and the largest armed conflict in Europe since World War II. This is reshaping political alliances globally, with an increased focus on national security. Additionally, inequality and dissatisfaction with the current economic model is increasingly giving rise to populist governments.  This is resulting in policies that are more inward focused. They include a trend toward onshoring and regionalization – deglobalization.  This is also resulting in reduced immigration in most of the developed world.  Finally, we are undergoing a significant period of investment in infrastructure as countries strive to transition toward clean energy solutions.

All of these macro events have contributed to higher inflation. Central banks have responded to the threat of unhinged inflation with the most aggressive rate hiking cycle in a generation. While there are some signs that inflation is moderating, the changes to the secular landscape will remain in place.  Going forward, we believe we will continue to experience upward inflationary pressures and higher interest rates, a dramatic shift from the last 40 years. Throughout the last several cycles, investors benefited from an extended period of ultra-accommodative monetary policies as central banks prescribed lower and lower interest rates to mitigate the risk of deflation and to sustain growth. This environment provided incentives for risk taking as the cost to borrow was cheap. It resulted in the steady expansion of valuations for risk assets.

Over the next few years, inflationary pressures and higher rates could result in headwinds for markets as adjustments are made to asset valuation levels. As we look forward to the next cycle, we are anticipating more volatility and policy actions that will result in shorter cycles accompanied by lower asset valuations. In this environment it will be important to be nimble. We see attractive opportunities for active management and expect manager added value to become an increasingly important contributor to achieving client investment objectives.

While we have faced a broad range of investment environments in the four decades since our company’s inception in 1982, at the very heart of our organization is a commitment and desire to provide superior performance and service to our clients. Our ability to deliver on these commitments starts and ends with the quality of our people and the strength of our relationships. This requires that we keep the business narrowly defined and intently focused on what we do best while endeavoring to remain at the cutting edge of research and development initiatives within the financial markets. Importantly, our business structure provides stability and keeps us focused on maintaining a long-term horizon. Despite the challenging operating conditions over the past year with negative returns across markets and high levels of employee cost inflation, we continued to invest in our teams and expanded the resources we are employing in the business.

To this end, we have been focused on several initiatives at CC&L:

  • As always, we are investing in our people and through career development planning and leadership programs, we strive to enhance skill sets, the depth of our teams, investment processes, and plan for succession.
  • We continue to focus on fostering a team-oriented culture of collaboration with a particular emphasis on continuing to improve diversity and inclusion. There are numerous projects underway to ensure our objectives are met. The Women in Leadership (WiL) initiative has been a key priority at CC&L over the past two years and a significant number of recommendations were brought forward to our Board in 2022. We began implementing these ideas in 2022 and have plans that will continue through 2023, 2024 and 2025.
  • We have expanded our Corporate Social Responsibility (CSR) activities supporting the health and wellness of both the people who work at CC&L and continuing to create a positive impact in the communities where we do business. We implemented a number of new policies aimed at supporting our employees and their families’ well-being, and the CC&L Foundation awarded a broad range of scholarships and financial support during the year.

Thank you for your partnership and as always, I welcome your feedback and invite you to contact me directly at any time.

Martin Gerber
[email protected]


Team Updates

We are pleased to report our teams continued to expand in 2022. CC&L welcomed 20 new hires, resulting in a net increase of 13 employees for the full year, bringing CC&L’s personnel count to 117. Our business is further supported by over 350 people employed by the CC&L Financial Group, responsible for business management, operations, marketing, and distribution.

The stability and focus of each of our teams continues to be a primary driver of our business. One of the key tenets to ensuring continued success has been thoughtful and comprehensive succession planning across the organization and a disciplined approach to career development.

A number of employees were promoted to principals of the firm in recognition of their important and growing contributions to our business bringing the total number of principals to 27.

Principal Appointments in 2022 and 2023

Fixed Income Fundamental Equity Quantitative Equity Client Solutions
Joe Dhillon Jack Ferris Piper Hoekstra Lisa Conroy
Kyle Holt Haley Mayers Derek Moore Monica Demidow
Kevin Malcolm Joe Tibble Isaac Ho Mandy Powell
TJ Sutter   Nolan Heim  


Below we highlight a number of personnel developments within our organization.

Fixed Income

Left to right: Brian Milne, Brian Eby, TJ Sutter.
  • We are pleased to announce Brian Milne, Senior Credit Analyst, was appointed a business owner at CC&L in 2022. Brian joined CC&L in 2018 and became a principal in 2020. He brings 15 years of capital market experience. Brian is responsible for credit research and has been a member of the CC&L’s ESG Committee since 2019.
  • Succession planning is an important process at CC&L and we are in the process of implementing a longer-term succession plan within the Macro Strategy group. TJ Sutter joined CC&L in 2021 working alongside Brian Eby. Over the past year, TJ has taken increasing responsibility for portfolio decision-making. He was appointed a principal at CC&L in 2022 and a business owner in 2023. Brian Eby continues to be an active member of the team contributing to investment strategy and mentorship within the team.
  • There was one new addition to the team in 2022. Catherine Clarke joined as an analyst on our Portfolio Analysis and Design team.

Fundamental Equity

Top (left to right): Mark Bridges, Haley Mayers, Chang Ding, Simon Mo.
Bottom (left to right): Joe Tibble, Ryan Elliott, Jack Ferris.
  • In March 2022, Steven Vertes, Portfolio Manager, retired after 20 years with the organization. We are pleased to report that his responsibilities were seamlessly reallocated to other members of the team.
  • We are pleased to announce Ryan Elliott, Senior Research Associate, was appointed a business owner at CC&L in 2022. Ryan joined CC&L in 2012 and has been a principal since 2013. Ryan has responsibility for coverage of the technology and health care sectors.
  • Mark Bridges, Portfolio Manager, is responsible for covering the energy sector research and his responsibility on the team expanded with the newly created role of Research Director in 2022. He is responsible for working closely with all sector specialists to ensure the optimal level of structure, rigour and consistency in the team’s research process. The research team expanded with the addition Chang Ding, a research analyst in 2022. We are also pleased to welcome Haley Mayers, as a Senior Research Associate in January 2023. Haley has over a decade of experience as an equity research analyst within the asset management industry.
  • Simon Mo took on the newly created role of Senior Portfolio Management Analyst in 2022. Simon is responsible for portfolio management operations, administration and modeling. Simon has been an important contributor to the CC&L quantitative equity team’s success in his 16 years with the team, and we are excited to have Simon apply his skills and experience to the fundamental equity team.

Quantitative Equity

Top (left to right): Glen Roberts, Richard Au, Steven Li.
Bottom (left to right): Daniel Cook, Brian Bardsley.

We are continuing to make investments in the expansion of our capabilities, including the net addition of seven new team members in 2022, bringing our team count to 65 dedicated investment professionals.

All of the new hires joined either our Investment Process Management (IPM) or Investment Management Systems (IMS) groups, which bridges research and portfolio management, creates all of the investment technology infrastructure, collects and processes all of the roughly 45 million data points that flow into our models every day, and oversees all of our operational processes.

We place high value on continuous career development, including the movement of people across different functional roles within the team. Gaining exposure to different investment functions provides career path options and enables employees to bring broader investment context to their roles. In 2022, two individuals transitioned from the IPM and IMS groups to trading and portfolio management. Overall, on net, the proportionate breakdown of functional roles within our team has remained relatively stable over the years.

With team expansion also comes the need for more specialized leadership. We are pleased to announce five individuals—spanning various groups within the team were promoted to business owners in 2023, in recognition of the development of their investment leadership over their time with CC&L:

Portfolio Management: Brian Bardsley joined CC&L in 2007 and has been a principal since 2013. His primary responsibilities include the implementation of new strategies, mandates and model changes.

Research: Glen Roberts joined CC&L in 2007 and became a principal in 2015. Steven Li joined CC&L in 2015 and became a principal in 2020. Both Steven and Glen are senior members of the research team. In addition to conducting their own quantitative research, they also have leadership roles in managing research projects and the research process.

Investment Management Systems: In January 2020, 19 members of the Connor, Clark & Lunn Financial Group portfolio management and research systems team became direct employees of CC&L. Dan Cook and Richard Au have led the members of the team since and became principals of the firm in 2020. They continue to operate in a co-lead model, with Dan providing technical leadership and Richard focusing on people leadership.

Client Solutions

  • Our Client Solutions team has grown with the arrival of Diana Prenovost in January 2023. She works out of the Montreal office and will be responsible for client relationship management.

Responsible Investing

In 2022, the ESG Committee undertook a review of industry practices in all aspects of responsible investing including integration, active ownership and communication. The outcome of this project validated our approach to ESG and has led to the prioritization of several areas for improvement in 2023. These generally relate to the improvement of the communication and tracking of our RI activities. We also committed to formalize our climate strategy in 2023 with a key focus on advocating for greater transparency in company disclosures regarding emissions and transition plans.

Business Operations

In the fourth quarter of 2022, we formally implemented our return-to-office policy. This new hybrid policy provides all employees with flexibility and has everyone working together in the office a minimum of three days a week (Tuesday to Thursday).

Business Update

Assets Under Management

CC&L’s assets under management (AUM) declined by approximately $5 billion in 2022 to $54 billion. The decline in AUM was driven by the negative returns experienced in both equity and fixed income mandates as a result of declines in market levels. We are pleased to report that our business continued to grow through new client mandates across all of our investment teams. In 2022, CC&L gained 17 new clients and nine additional mandates from existing clients totalling $2.5 billion. The majority of the new mandates were quantitative foreign equity mandates from institutional investors outside of Canada, which now represent approximately 20% of our total AUM.

By Mandate Type.
Fundamental Equity: 21%.
Quantitative Equity: 44%.
Fixed Income: 17%.
Multi-Strategy: 18%.
By Client Type.
Pension: $27.5 billion.
Sub-Advised: $17.7 billion.
Foundations, Endowments & Other Institutional: $8.9 billion.
Total AUM in CAD$ as at December 31, 2022 = $54 billion.

Final Thoughts

We would like to thank our clients and business partners for their partnership and support. We look forward to continuing to work with you and provide support in achieving your investment objectives in the coming years.