The economic / market view here remains cautious based on 1) an expected slowdown in global industrial momentum through H2 (already apparent in Chinese data) and 2) recent less favourable “excess” money conditions.
Global six-month real narrow money growth, however, may have bottomed in May / June. A Q3 rebound would signal a stronger economy in H1 2022. An associated improvement in excess money could reenergise the reflation trade in late 2021.
The issue can be framed in cycle terms: does the recent top in the global manufacturing PMI new orders index mark the peak of the stockbuilding cycle (implying a shortened cycle) or will the peak be delayed until H1 2022?
Possible drivers of a real money growth rebound include Chinese policy easing, a slowdown in global consumer price momentum and a pick-up in US / Eurozone bank loan expansion.
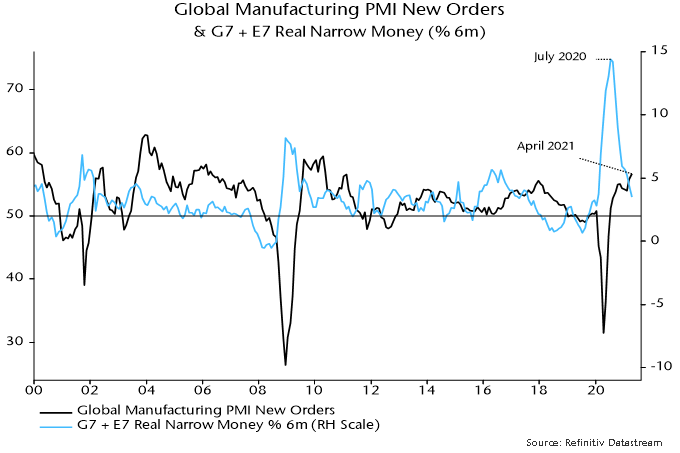
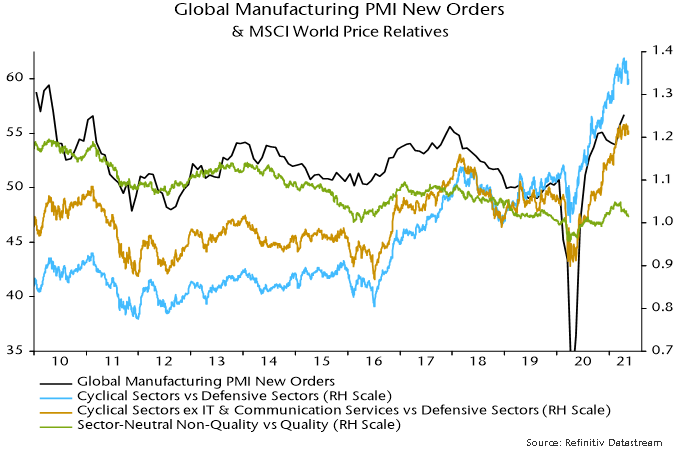
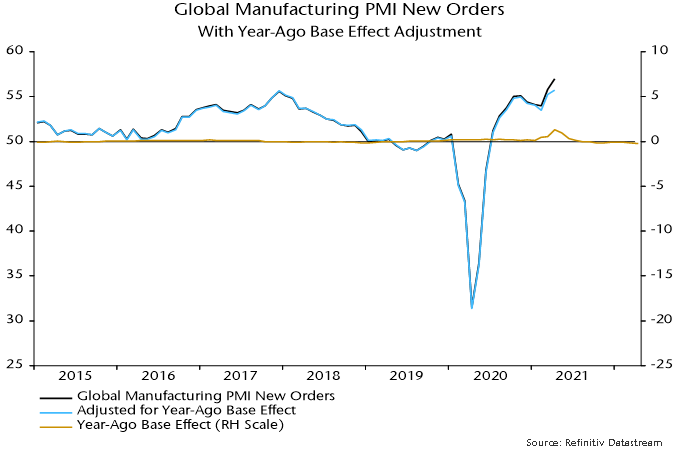
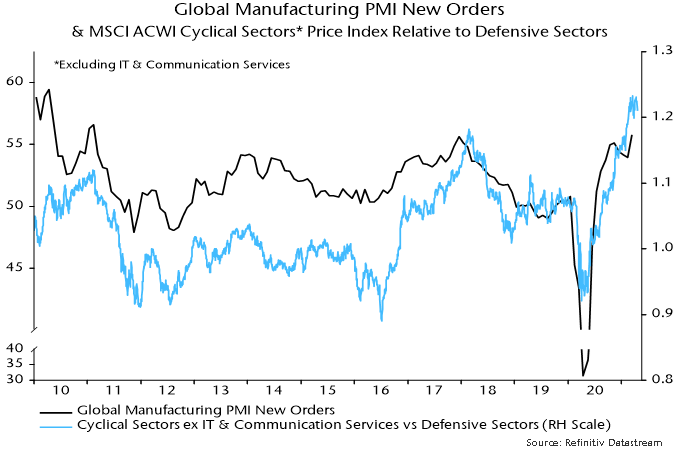
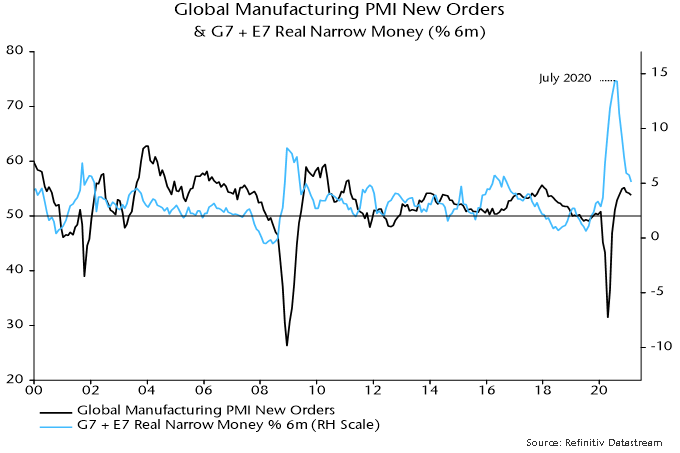
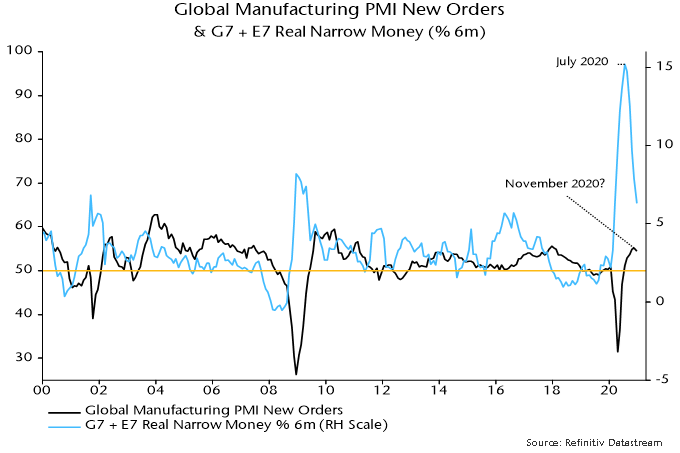
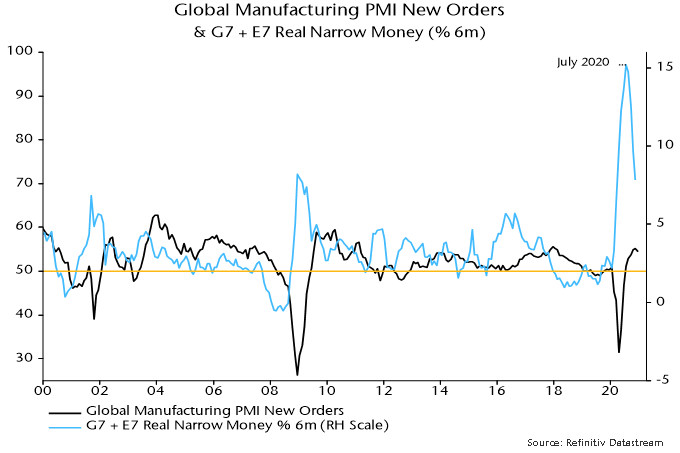
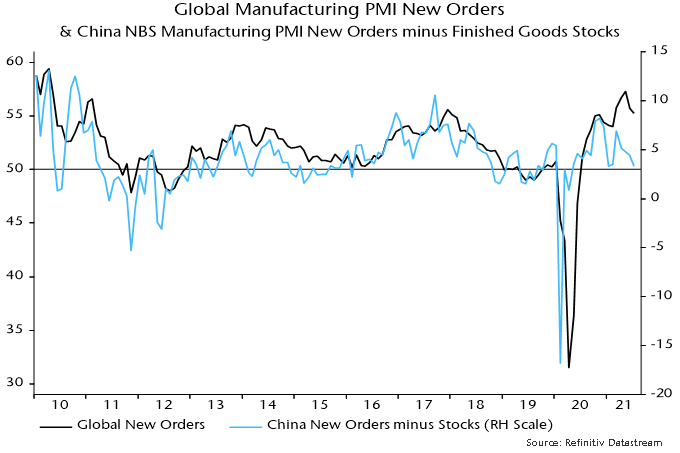
The H2 industrial slowdown view remains on track. The global manufacturing PMI new orders index fell further in July, confirming May as a top. Chinese orders were notably weak and have led the global index since the GFC – see chart 1.
Chart 1
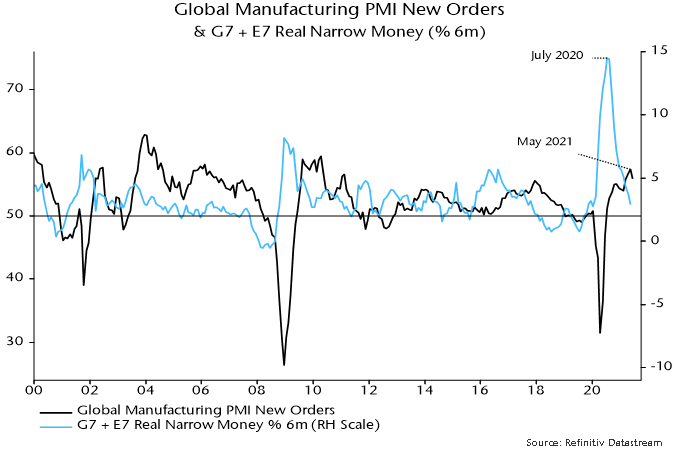
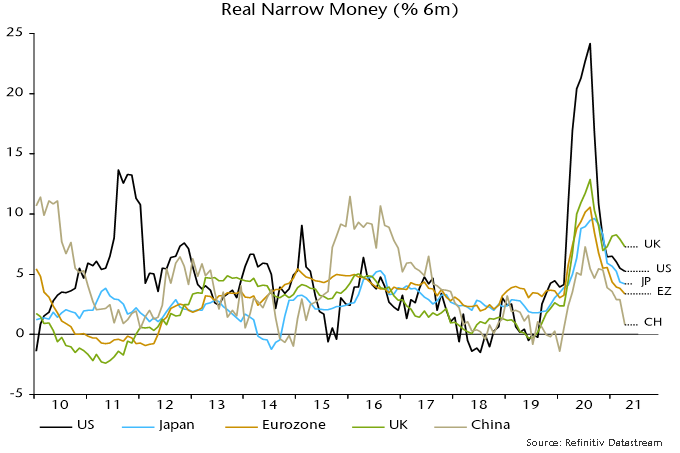
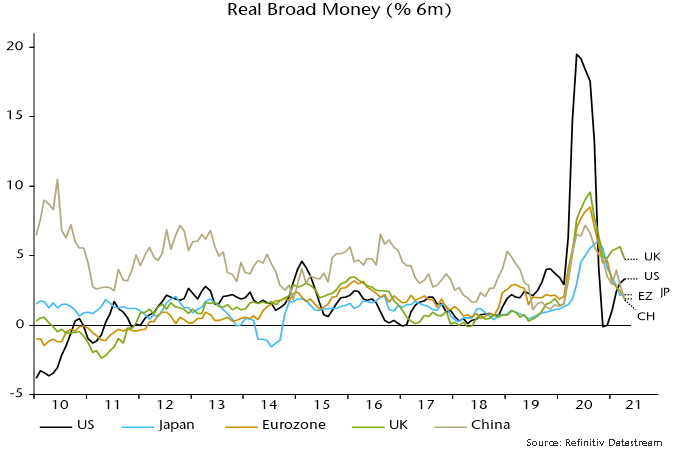
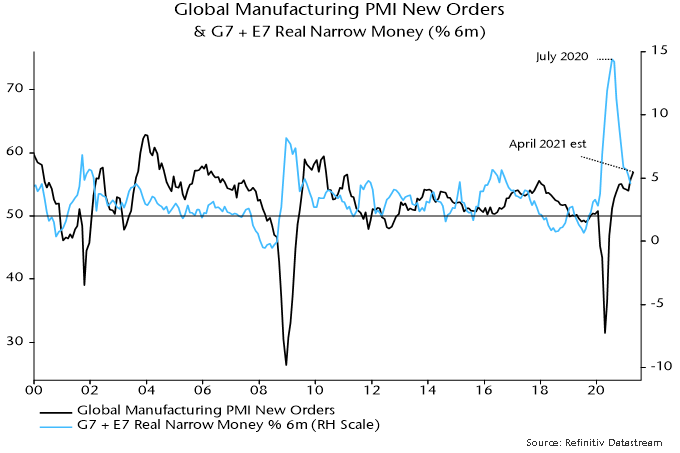
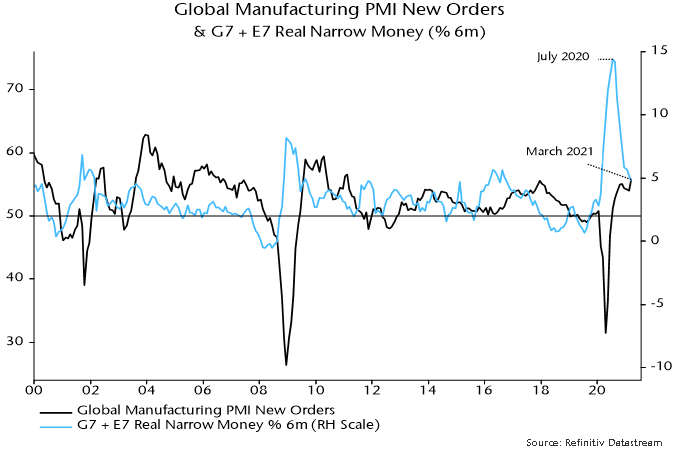
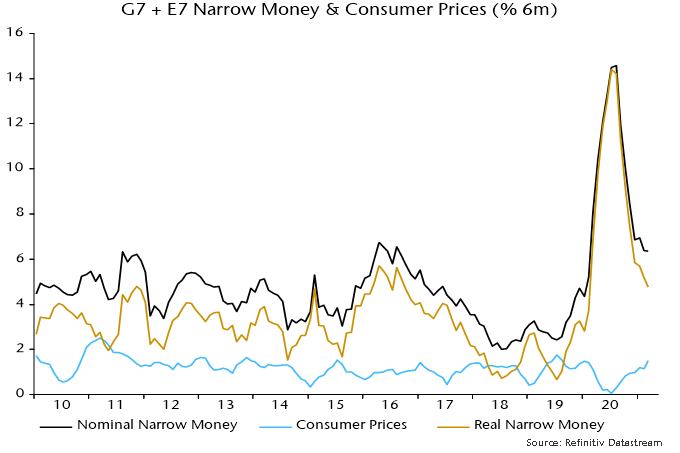
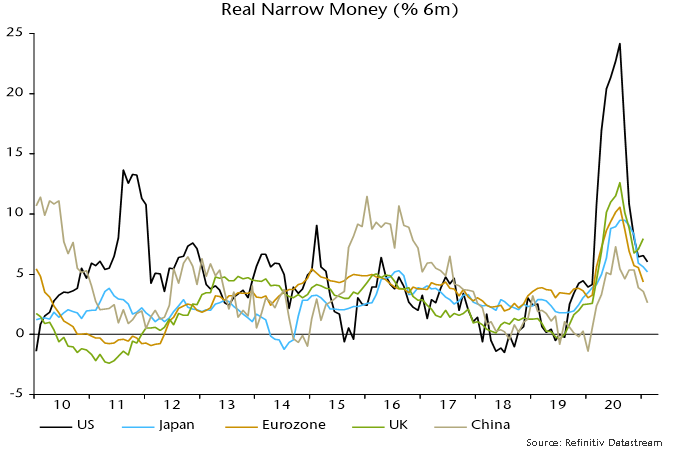
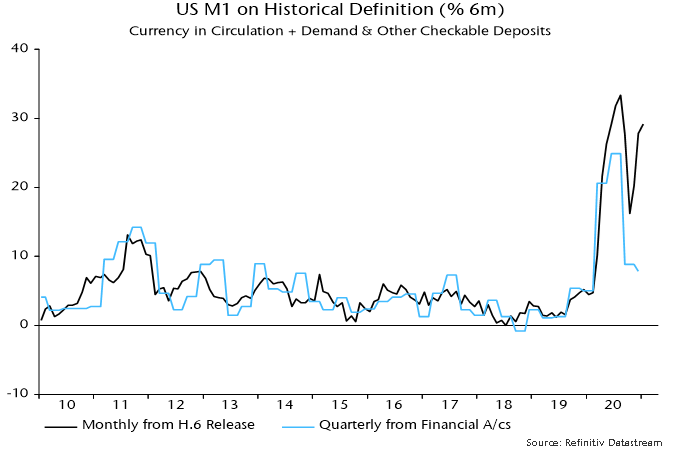
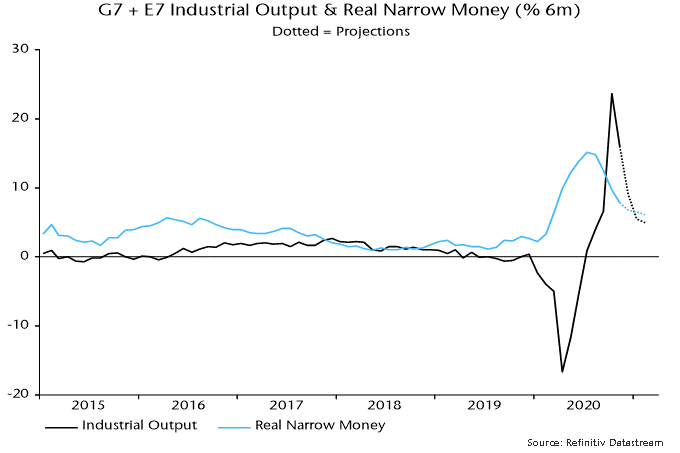
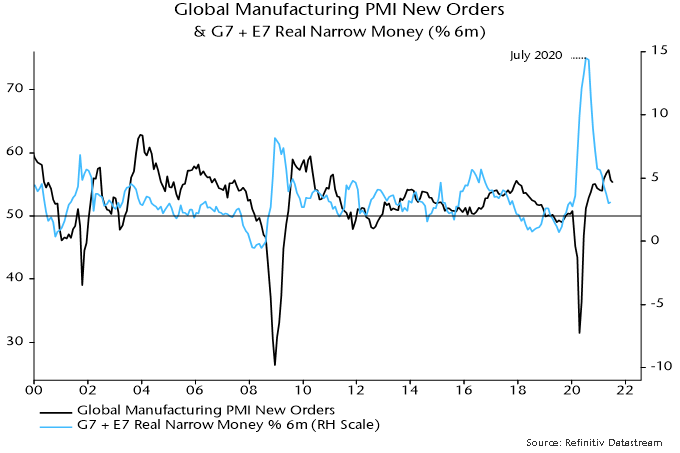
Global six-month real narrow money growth fell steadily between July 2020 and May but a stabilisation in June has been confirmed by additional monetary data released over the last week – chart 2.
Chart 2
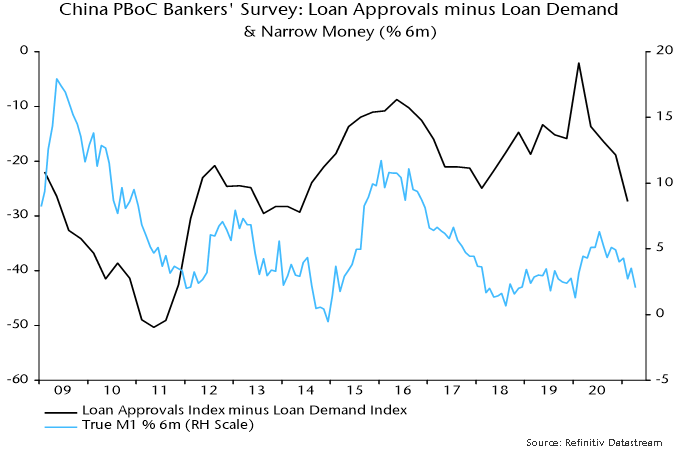
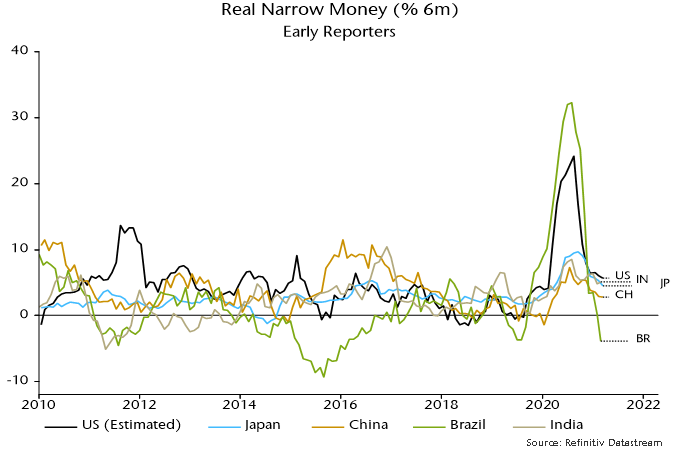
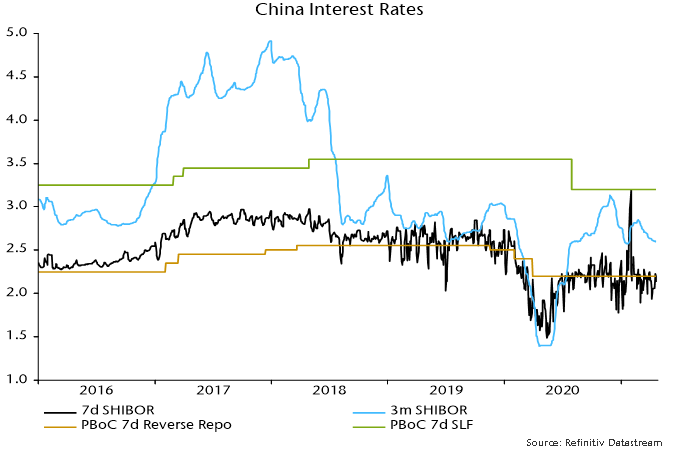
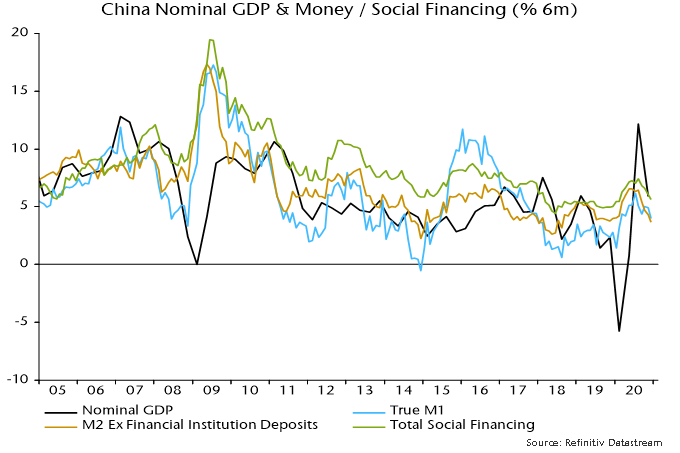
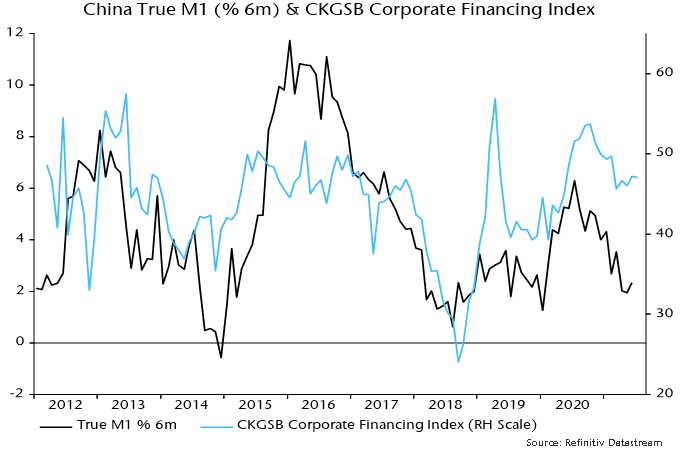
Will PBoC policy easing drive a recovery in Chinese / global money growth? The hope here was that the 15 July cut in reserve requirements would be reflected in an early further fall in money market interest rates and easier credit conditions. Three-month SHIBOR, however, has moved sideways while corporate credit availability is little changed, judging from the July Cheung Kong Graduate School of Business survey – chart 3. July money data, therefore, could show limited improvement.
Chart 3
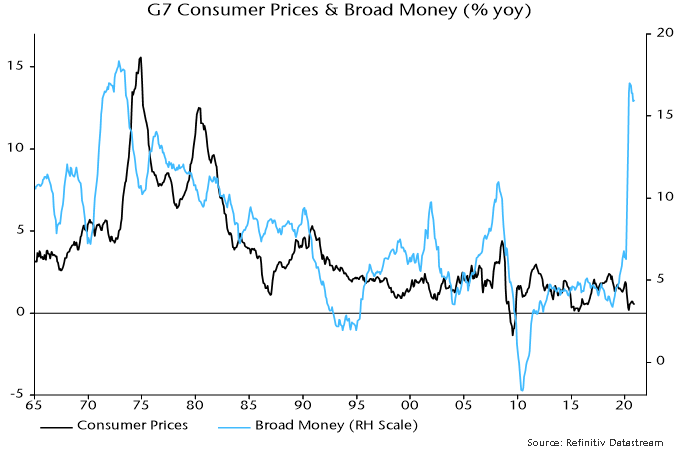
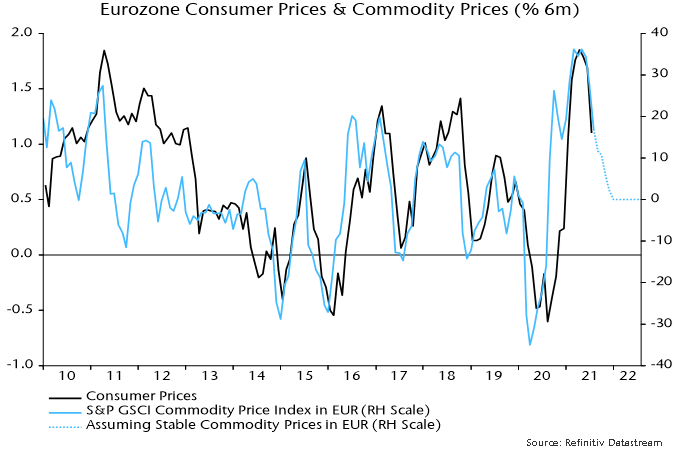
Global six-month real money growth should receive support from a slowdown in consumer price momentum as commodity price and bottleneck effects fade. Eurozone six-month CPI inflation eased on schedule in July, with further moderation suggested and the move lower likely to be mirrored in other countries (Tokyo July numbers also showed a slowdown) – chart 4.
Chart 4
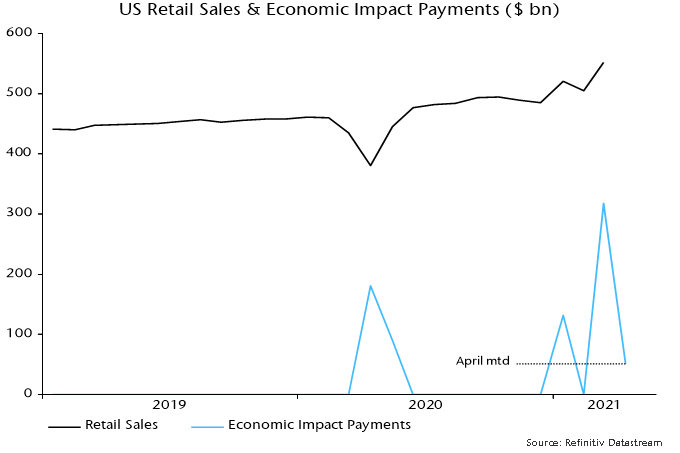
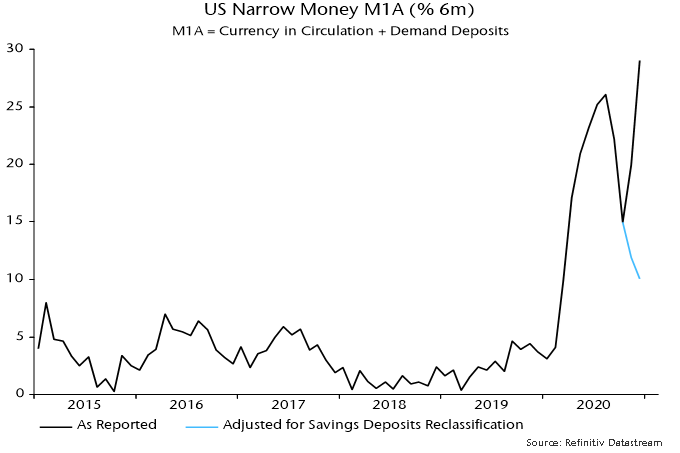
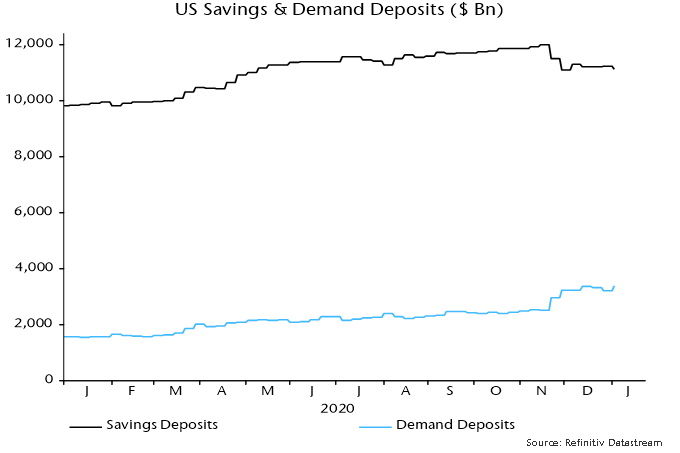
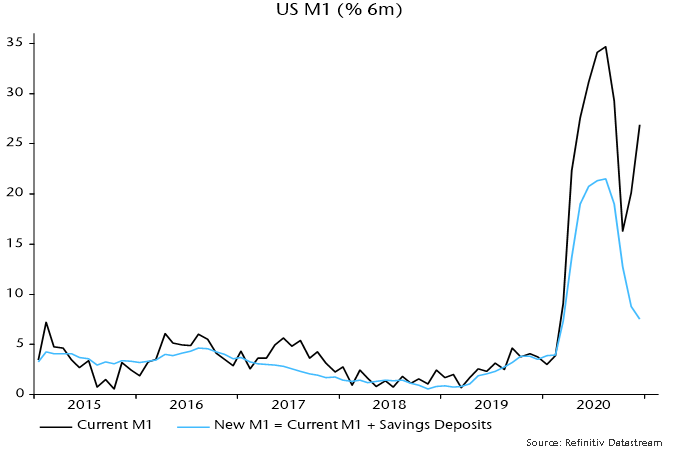
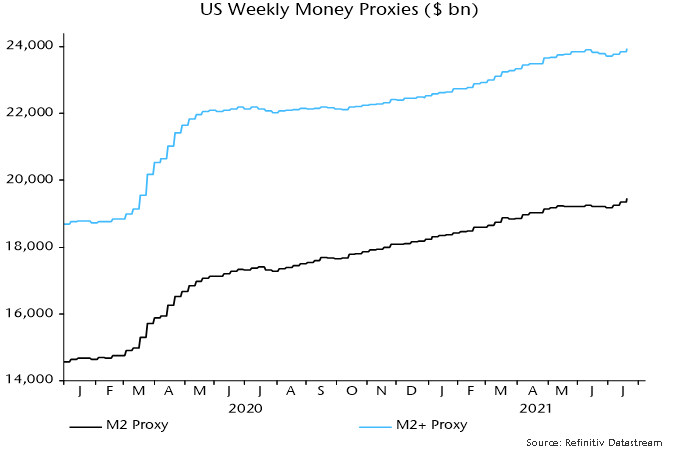
US monetary prospects are foggy. Disbursement of stimulus payments boosted nominal money growth over March-May but there was a sharp slowdown in June. Weekly data indicate a reacceleration in July as the Treasury ran down its cash balance at the Fed to comply with debt ceiling legislation – chart 5. This effect, however, will be temporary and an improving fiscal position suggests a reduced contribution from monetary financing during H2 and into 2022.
Chart 5
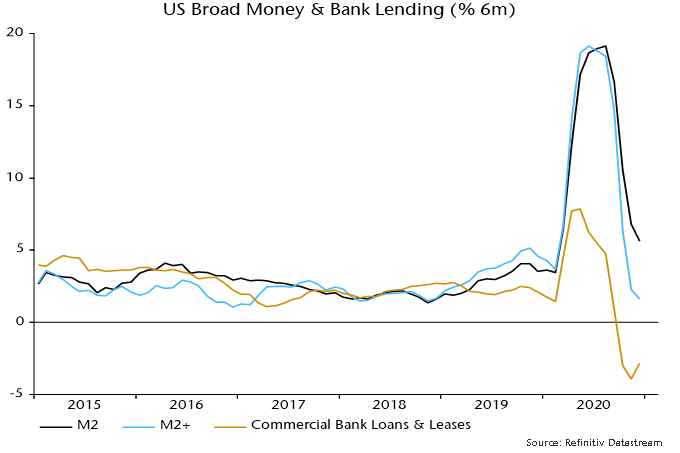
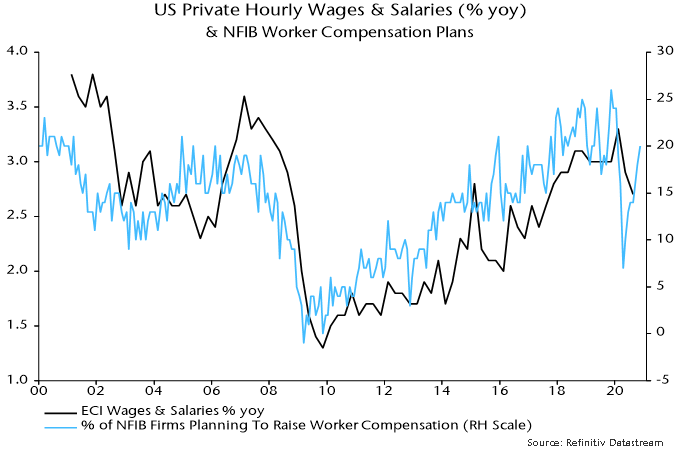
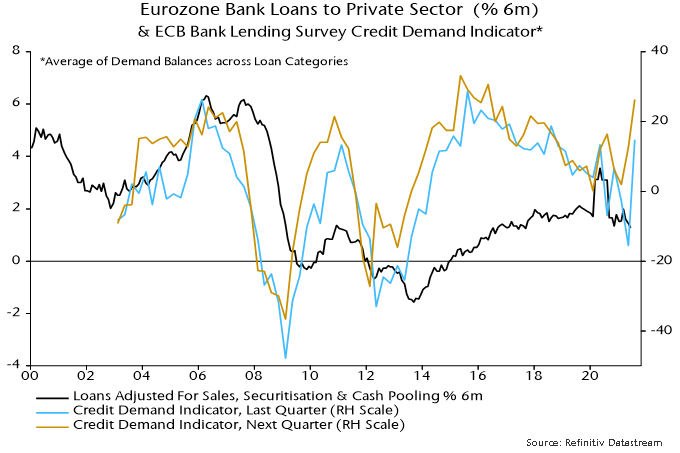
Stable or higher US money growth, therefore, may require a pick-up in bank loan expansion. The Fed’s July senior loan officer survey, released yesterday, is hopeful, showing a further improvement in demand balances across most loan categories (not residential mortgages) – chart 6. The ECB’s July lending survey gave a similar message – chart 7. The survey indicators, however, are directional and the magnitude of a likely loan growth pick-up is uncertain. Actual lending data remained soft through June.
Chart 6
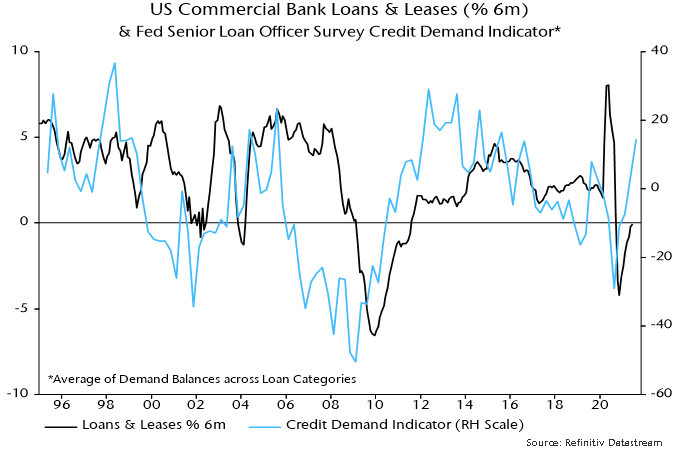
Chart 7
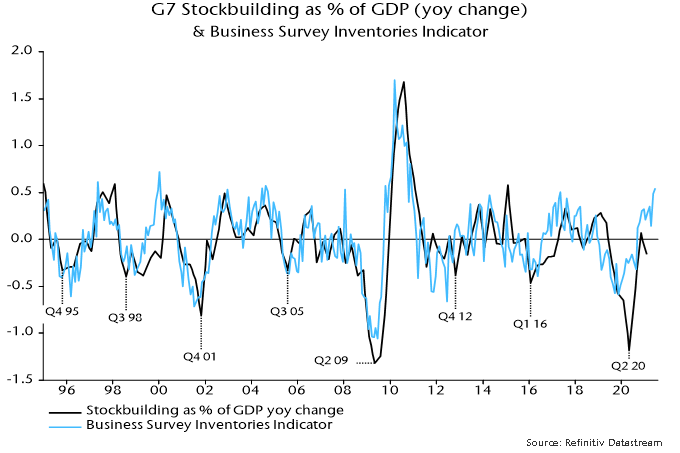
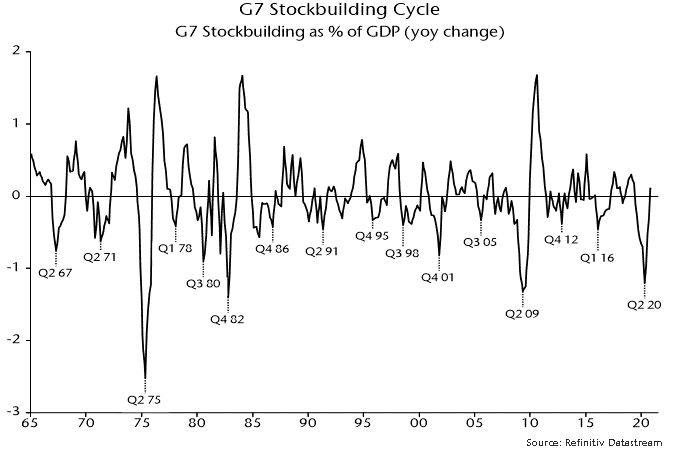
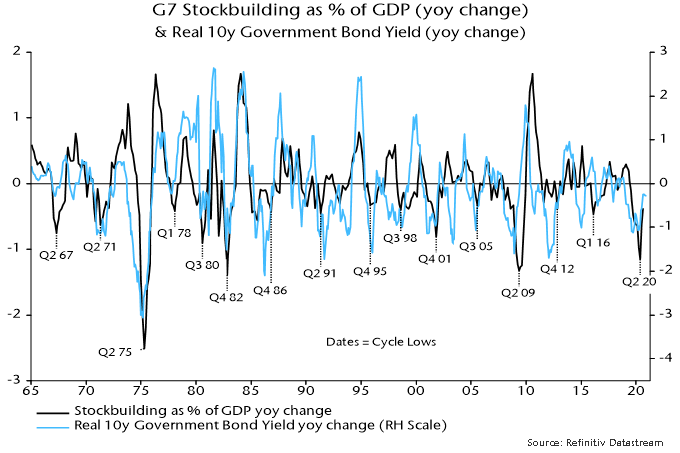
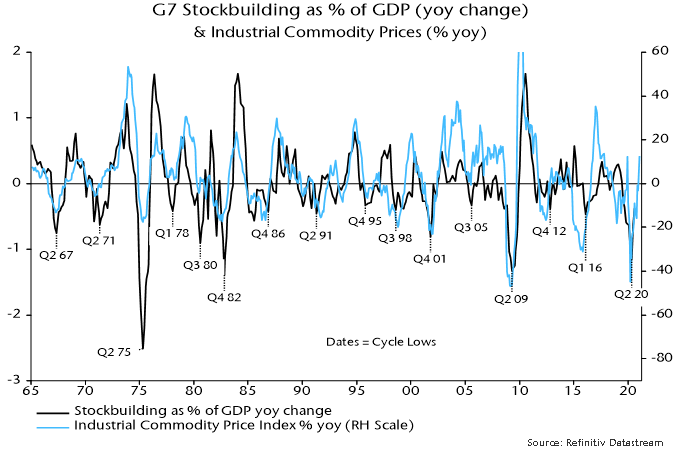
Failure of global real money growth to recover in Q3 – and especially a further slowdown – would suggest that the stockbuilding cycle is already at or close to a peak. The cycle bottomed in Q2 2020 and – based on its average historical length of 3.33 years – might be expected to reach another low in H2 2023, in turn implying a peak no earlier than H1 2022. As previously discussed, however, the current upswing could be short to compensate for a long (4.25 years) prior cycle.
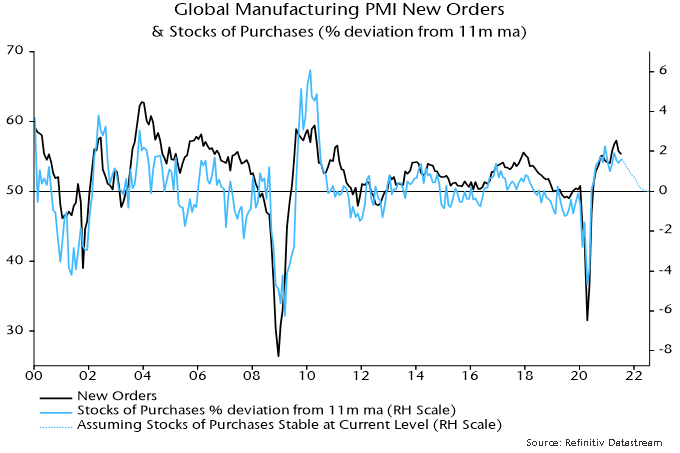
Proponents of the consensus view that replenishment of stocks will underpin solid industrial growth in H2 cite the still-low level of the global manufacturing PMI finished goods inventories index – chart 8. Research conducted here, however, indicates that the stocks of purchases index (i.e. raw materials / intermediate goods) is a better gauge of the stockbuilding cycle and tends to lead the finished goods index. The former index is already at a level consistent with a cycle top and the rate of change relationship with the new orders index is another reason for expecting orders to weaken significantly during H2 – chart 9.
Chart 8
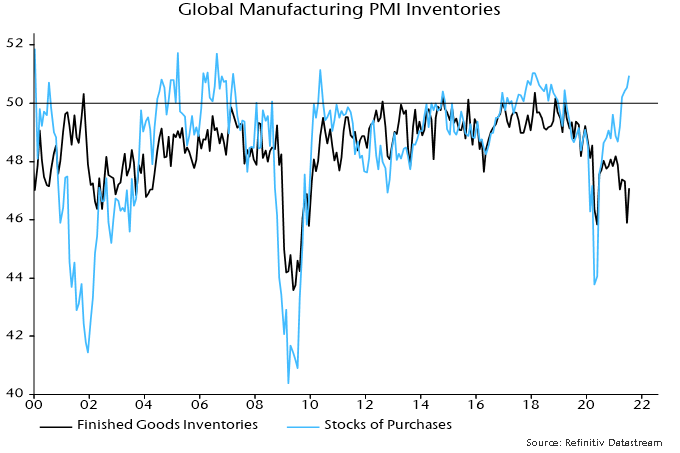
Chart 9