International equities finished 2025 strongly driven by positive Q3 earnings surprises, attractive valuations relative to the US and a risk-on environment, with the AI capex narrative continuing to dominate. The EAFE index rose 6.13% in local currency terms and 4.86% in US dollars. Utilities was the best performing sector, rising 10.13%, helped by expected higher energy demand from data centres worldwide and the long-term electrification trend. Communications was the weakest, with media earnings impacted by reduced advertising spending and telecom free cash flow pressurized by capex burdens.

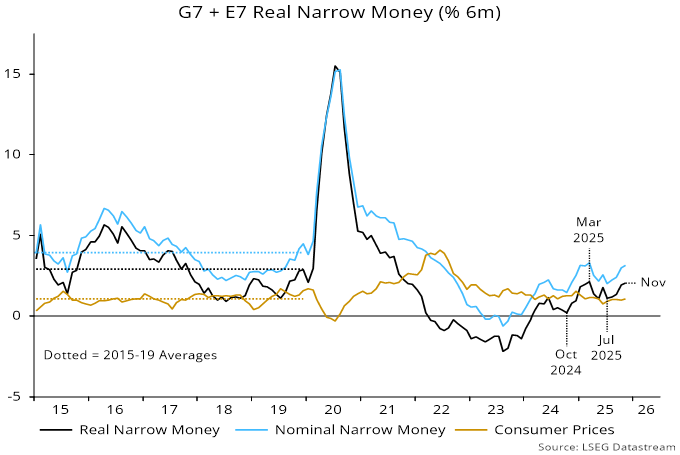
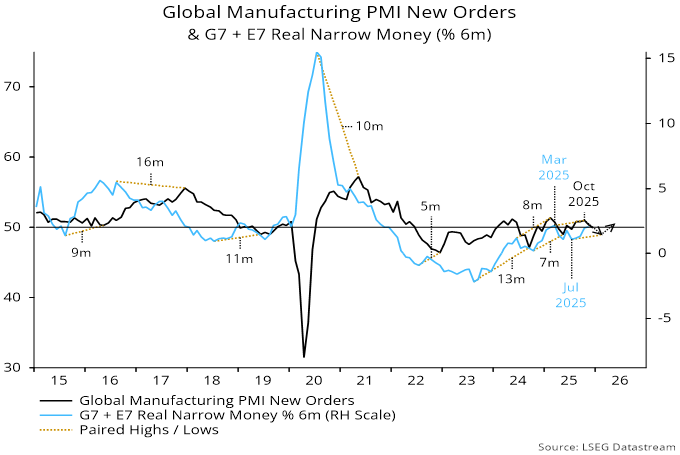
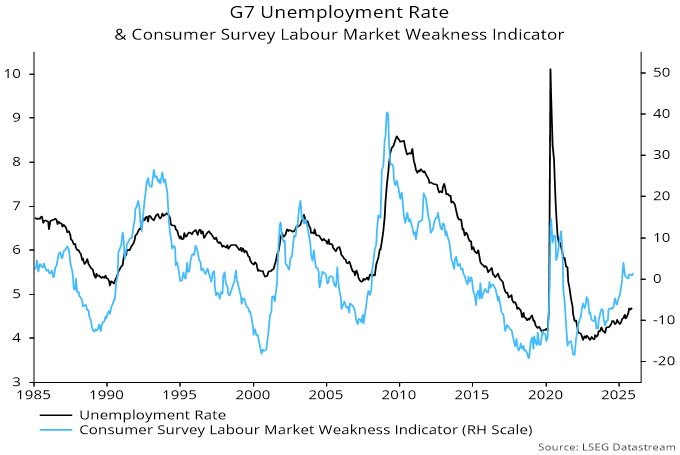
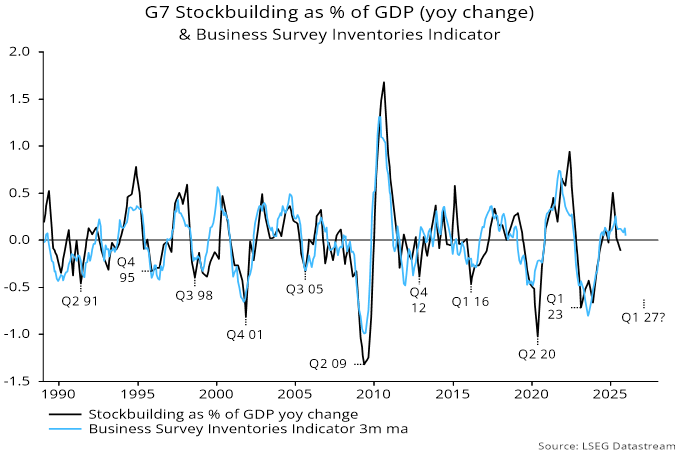
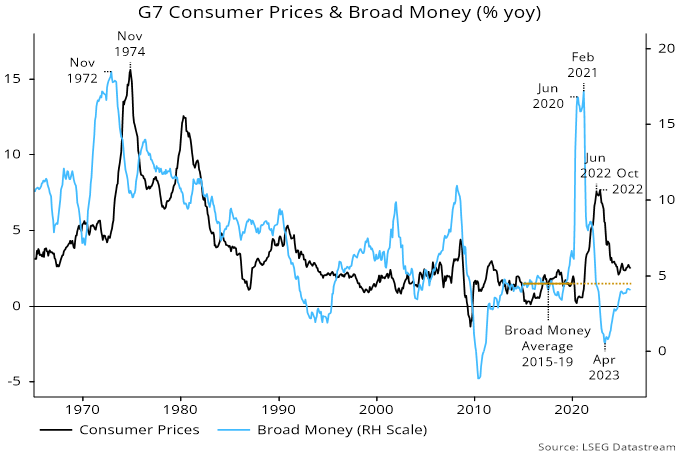
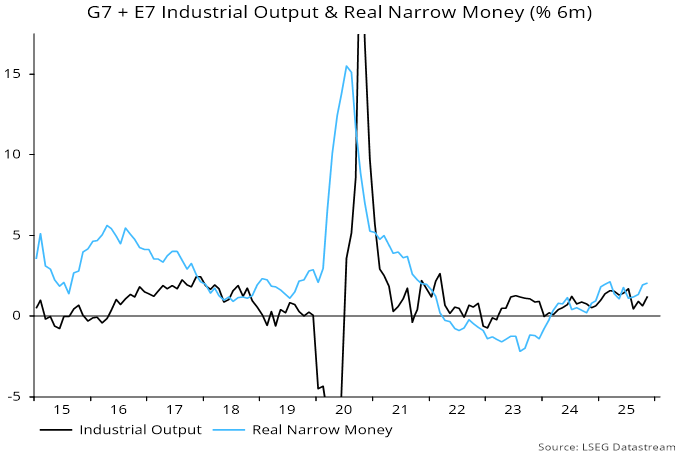
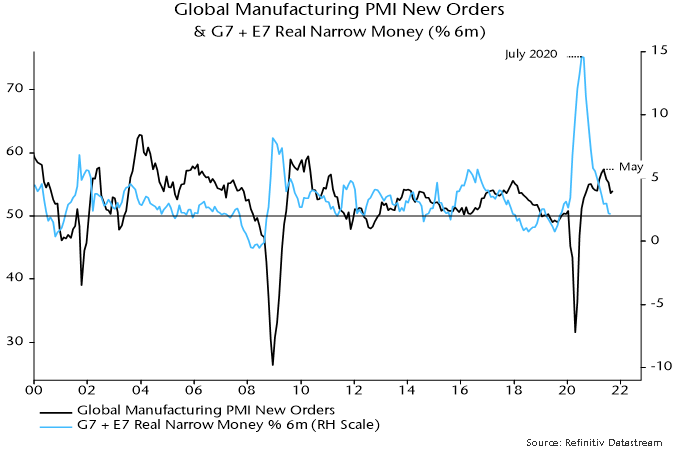
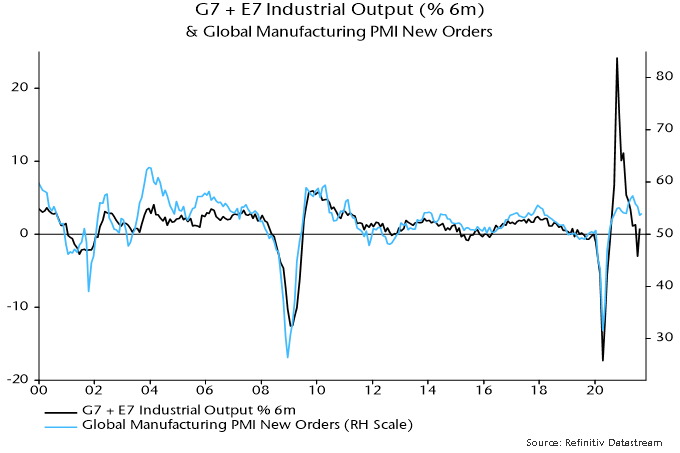
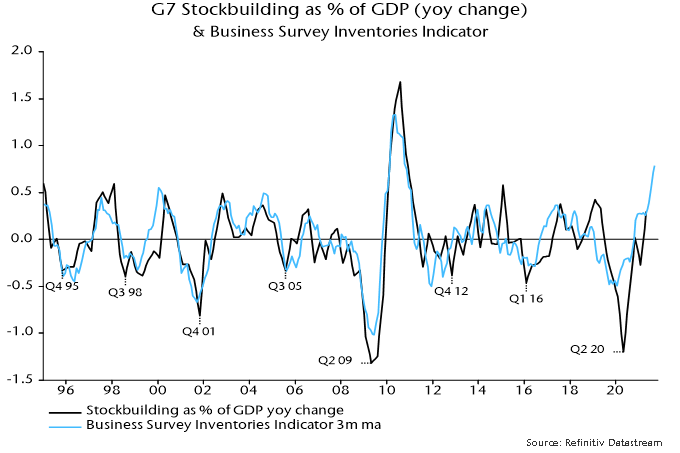
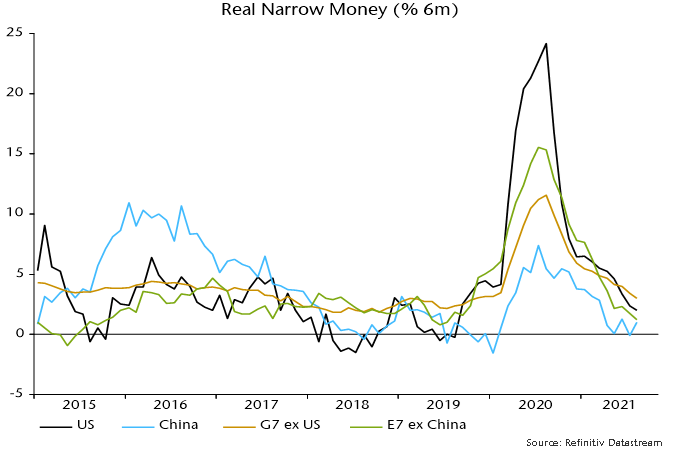
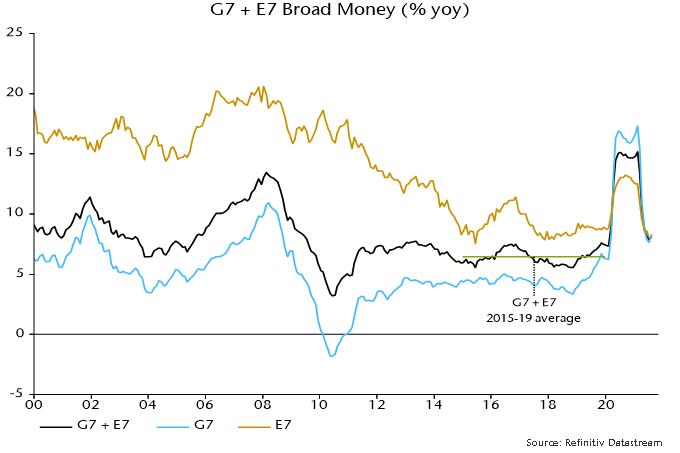
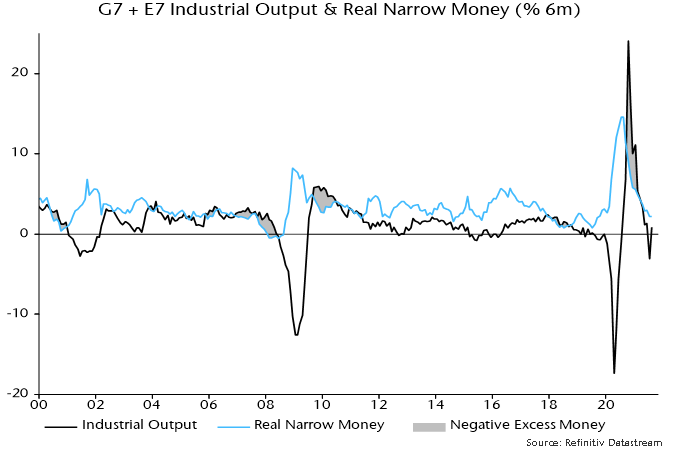
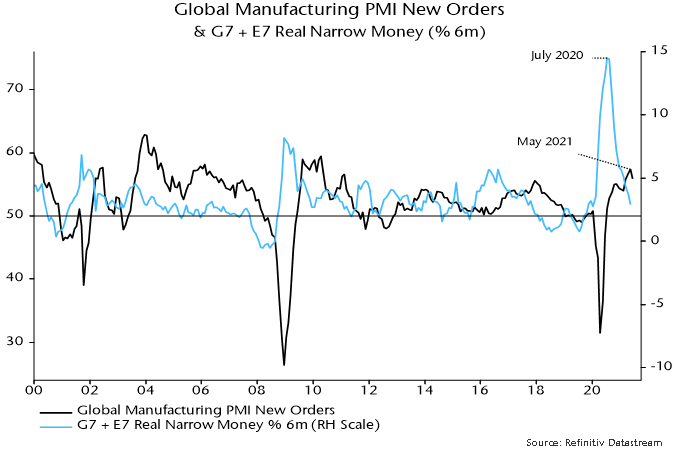
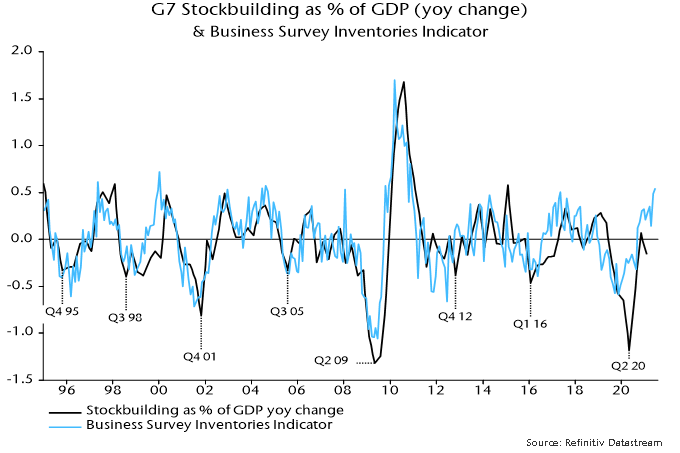
Global manufacturing PMI new orders fell for a second month in December, consistent with our forecast of a slowdown in economic momentum from late 2025, based on an earlier fall in real money growth from a March 2025 peak. Money numbers, however, have recovered since Q3, with EM growth reaching a new high. Accordingly, we now expect a PMI decline to bottom out in early 2026, with a recovery into mid-year. While global growth looks set to hold up in H1, this may not prevent a further rise in unemployment rates, partly reflecting AI job displacement. Moreover, the stockbuilding cycle remains on course to enter a downswing during 2026, suggesting another economic slowdown in H2.

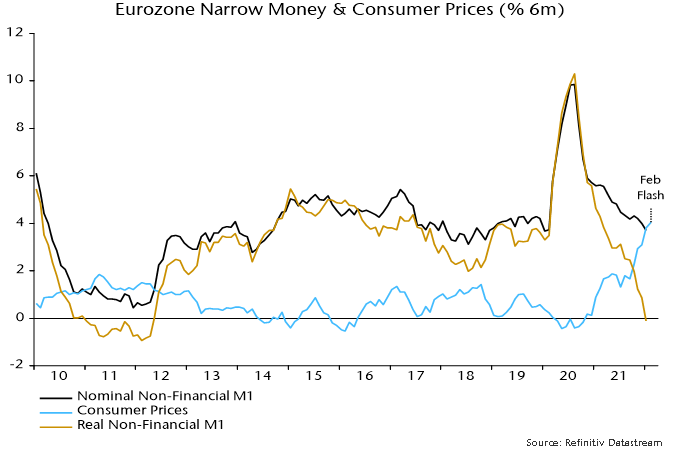
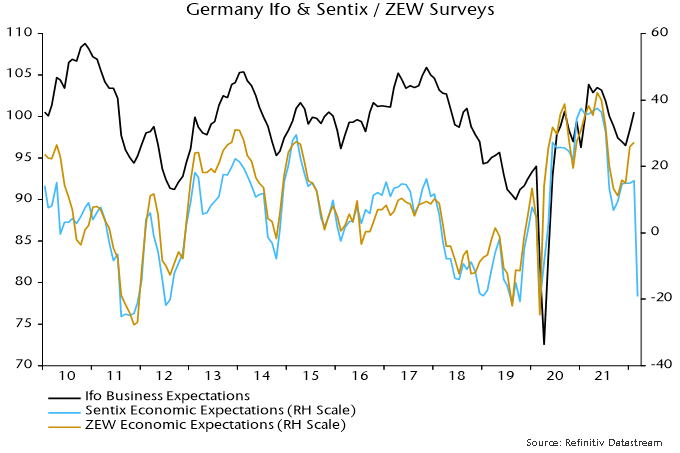
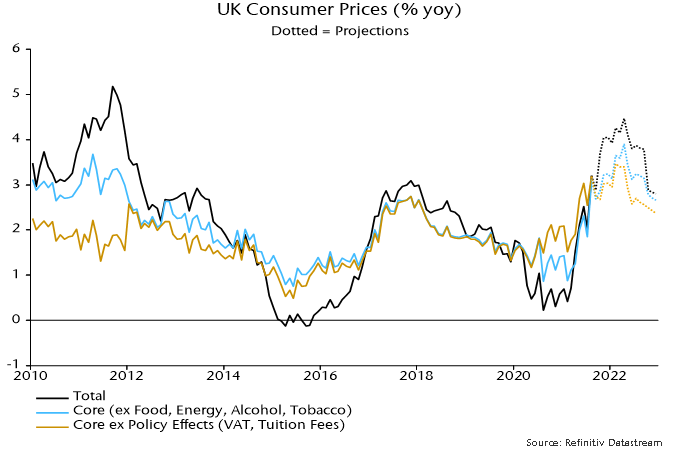
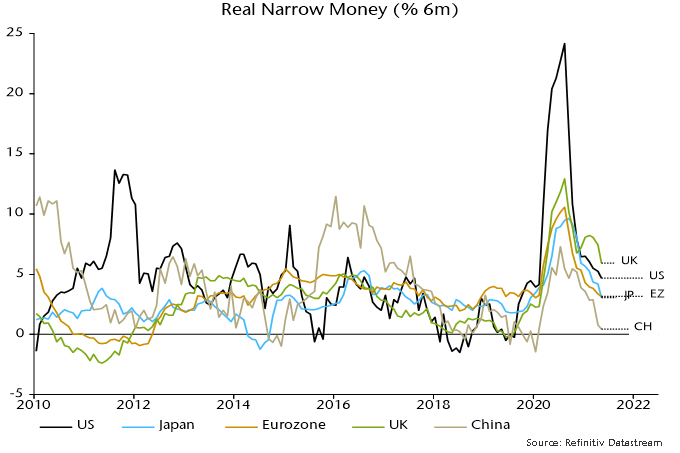
The outperformance of Eurozone equities in 2025 was consistent with relative money trends, which remain favourable but less than a year ago – the money growth gap with Japan and the UK has narrowed. In Germany fiscal expansion focused on infrastructure and defence spending is offsetting weaker exports due to falling US demand and tariffs. In the UK uncertainty ahead of the November Budget against a backdrop of weak government finances weighed on consumer and business confidence. Inflation has undershot expectations allowing the Bank of England to cut rates but Chancellor Rachel Reeves has prioritised spending and deficit control over avoiding growth-damaging tax rises.

In Japan Sanae Takaichi became the country’s first female prime minister after leading her Liberal Democratic Party into a new post-election coalition. Her key policy aims are higher defence spending, investment in AI and nuclear power, lower interest rates and increased spending, representing a return towards the Abe playbook. However, the Bank of Japan has continued to raise interest rates as it ‘normalizes’ policy, although the Yen has remained under pressure, partly reflecting fiscal concerns. Rising Japanese bond yields could represent a global liquidity risk for markets in 2026 if Japanese investors repatriate funds attracted by higher domestic returns.

Stock selection was the main negative in both Japan and Europe. Performance was weak notably in industrials, IT, and consumer areas. Concerns about AI disruption continued to negatively impact UK-listed publisher Relx (-16%), UK online property marketer Rightmove (-28%) and Australian accounting software company Xero (-28%). Rightmove was also hit by an increase in investment, partly in AI tools, that will significantly impact margins. Meanwhile, Xero’s acquisition of Melio, a payments company, was viewed negatively: while accelerating Xero’s US growth ambitions, the US$2.5bln price was high and negatively impacts near term return on invested capital. In utilities UK power generator SSE (+24%) raised capital to increase network capex which should generate attractive total shareholder returns out to 2030. In materials, the rising copper price has driven Rio Tinto (+19%) higher while banks such as Caixabank (+17%) and Natwest (+23%) have continued to report well and the sector has been a standout multi-year performer within EAFE.

In Japan, food products and specialty chemicals company Ajinomoto (-28%) fell after weak Q2 numbers impacted by tariffs in the US, supply disruptions in Brazil and a timing mismatch in frozen food promotions. The hope is that these are one-off factors and management has maintained full year guidance but the market was skeptical. Japan Steel Works (-21%) was also weak as demand for petrochemical products has slowed in China while signs of progress in the Russia/Ukraine peace talks were viewed negatively. Other defence related stocks saw profit taking including Thales (-15%) in France and the unowned Rheinmetal in Germany (-23%) – the latter shows as a positive in attribution. The Japanese banks also fared badly versus their European counterparts with Rakuten (-22%) and Mitsubishi UFJ (-3%) both down despite the interest rate hike, with the market less confident about further rises after the more expansionary Prime Minister Takaichi came to power.

Activity over the quarter has moved the portfolio overweight the more defensive healthcare sector while reducing IT and industrials. We have re-introduced Swiss pharmaceutical giant Roche, which is growing its topline at ~6% and earnings at double digits for the next five years with upside potential from a strong drug pipeline. In financials UK-listed Standard Chartered has been bought, reducing the underweight in financials and bringing an attractive geographical exposure notably to Hong Kong and Singapore. The company is returning cash to shareholders, has strong local franchises in the fast-growing countries where it operates and is expanding its affluent wealth management business across its Asian footprint. We favour emerging markets as an asset class and have purchased Chinese multi-media giant Tencent which is benefiting from AI integration across its businesses and user base.

We have also added Swedish industrial equipment maker Atlas Copco which has returned to orders growth driven by semiconductor capex ramps. Atlas has suffered from its end markets such as automotive and construction stalling but the slowdown in growth can be reversed as interest rates fall and the valuation is attractive as key markets return to expansion. We have also purchased Japan Steel Works which operates in attractive areas such as defence, nuclear and power, but is on a valuation that has lagged other stocks in these areas. On the sell side in industrials we have reduced perceived AI-threatened business service companies such as UK-listed Relx and Experian, and taken profits in some defence-orientated stocks such as Thales and Safran, both in France.

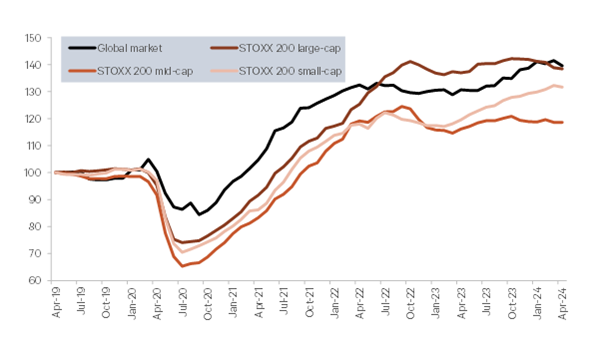
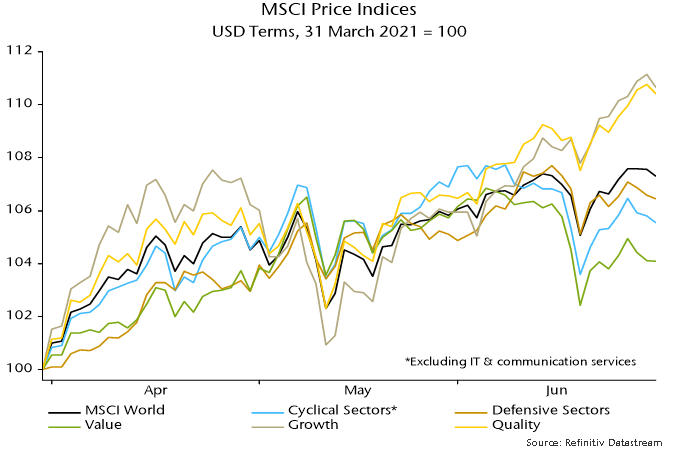
2026 has been a challenging year for active managers with the significant underperformance of quality as a factor impacting fundamental stock pickers. The advent of AI as a major theme has negatively affected many of our favoured asset-light, high return companies across sectors in areas such as software and business services, while cyclical value stocks such as banks and defence-related industrials have enjoyed a significant re-rating.

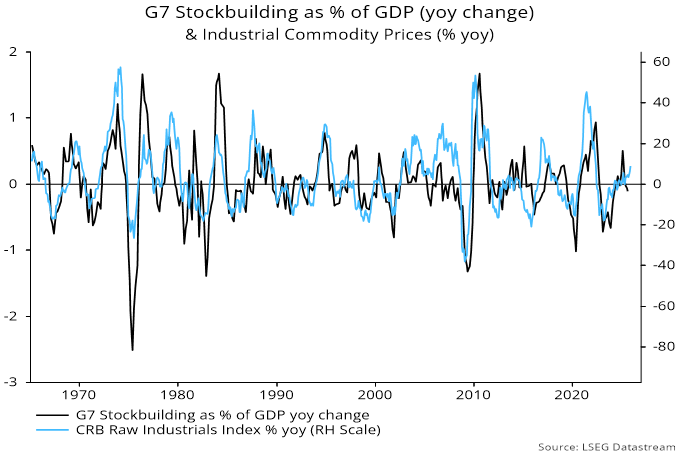
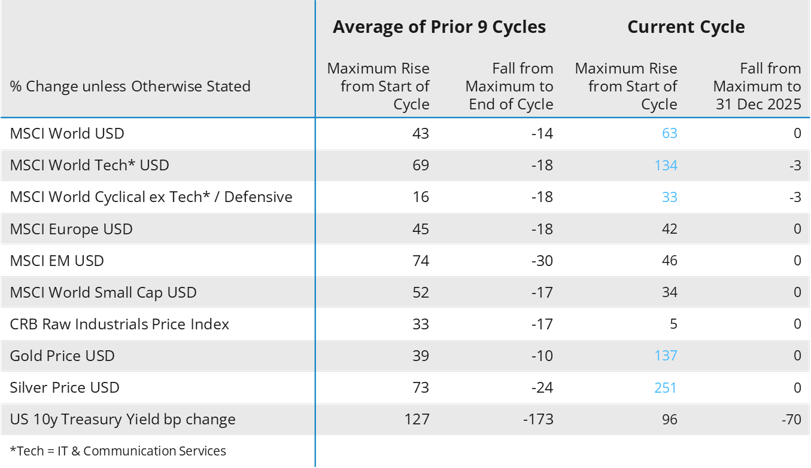
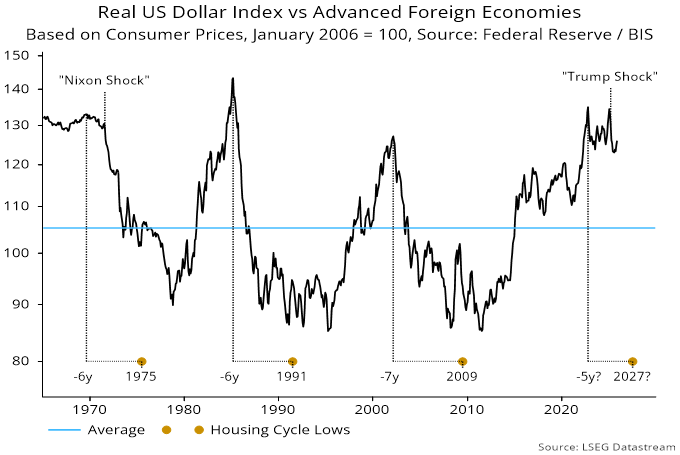
We continue to view further market upside as limited given the maturity of the stockbuilding cycle – downswings are usually associated with underperformance of equities and other cyclical assets. Cyclical considerations similarly support our preference for quality, which may also act as a hedge against a recovery in the US dollar – sentiment and positioning are much less unfavourable for the dollar than a year ago. Our investment approach remains centred on high-quality, resilient businesses with durable competitive advantages and long-term growth potential. In the current market environment favouring speculative AI-related equities and interest rate-sensitive cyclicals, our strategy has lagged the broader index. We continue to monitor elevated valuations and capital deployment risks within the AI infrastructure space. Many firms are committing substantial investment with uncertain long-term returns. Should enthusiasm around AI moderate, we believe our portfolio is well-positioned to preserve capital and deliver attractive relative returns over time.

The Composite rose by 1.96% (1.81% Net) versus a 4.86% rise for the benchmark.

The analytical approach used here is giving mixed messages for 2026 prospects. Global monetary trends appear modestly supportive of economic growth and markets, but the stockbuilding cycle remains on course to enter a downswing this year, with the housing cycle also in a time window for weakness.

Further considerations are likely suppression of labour demand from AI deployment and the unusual magnitude of gains in risk asset prices during the upswing phase of the current stockbuilding cycle.

The judgement here is to give greater weight to cyclical influences and plan for a negative shift in the investment environment during 2026, with caution to be reinforced in the event of deterioration in monetary indicators and / or data confirmation that a stockbuilding downswing is under way.

Global six-month real narrow money momentum – the key monetary leading indicator employed here – fell between March and July 2025 but recovered into November. The decline and rebound were driven by nominal money trends, with global CPI momentum stable at around its pre-pandemic pace (vindicating the monetarist forecast of full retracement of the 2021-22 inflation spike) – see chart 1.

Chart 1

Chart 1 showing G7 + E7 Real Narrow Money (% 6m)

The earlier fall in real money momentum has been reflected in a decline in global manufacturing PMI new orders – a timely indicator of economic momentum – from an October peak. Based on recent lead times, however, the monetary rebound suggests that the PMI will bottom out in early 2026, with a recovery into mid-year – chart 2.

Chart 2

Chart 2 showing Global Manufacturing PMI New Orders & G7 + E7 Real Narrow Money (% 6m)

While global growth may hold up in H1, it may not be strong enough to prevent a further rise in unemployment rates, partly reflecting AI job displacement – chart 3.

Chart 3

Chart 3 showing G7 Unemployment Rate & Consumer Survey Labour Market Weakness Indicator

Meanwhile, the stockbuilding cycle – averaging 3.5 years in length historically – remains on course to enter a downswing in 2026, with a possible low in H1 2027. The focus here is on the survey-based indicator shown in chart 4, which has been moving sideways at a level consistent with a cycle peak – a decline into negative territory would confirm a phase shift.

Chart 4

Chart 4 showing G7 Stockbuilding as % of GDP (yoy change) & Business Survey Inventories Indicator

Global inflation is expected to be little changed in 2026, with downside risk judged greater than upside. A key consideration is that G7 annual broad money growth, while recovering further over the past year, remains below its pre-pandemic average – chart 5.

Chart 5

Chart 5 showing G7 Consumer Prices & Broad Money (% yoy)

A downside surprise could arise from AI job displacement depressing wage growth. One upside risk is a near-term burst of commodity price strength before the stockbuilding cycle moves into a downswing. Industrial commodity prices rose by less than usual earlier in the upswing and a catch-up could be in progress – chart 6.

Chart 6

Chart 6 showing G7 Stockbuilding as % of GDP (yoy change) & Industrial Commodity Prices (% yoy)

The expected transition in the stockbuilding cycle coincides with the housing cycle – averaging 18 years, with a previous trough in 2009 – being in a time window for weakness. G7 housing investment moved sideways between 2023 and H1 2025 but fell to a new low in Q3 – chart 7.

Chart 7

Chart 7 showing G7 Housing Investment (Q1 1970 = 100)

Cyclical hopes rest on further strength in business investment, which follows an average 9-year cycle, with a previous low in 2020. While tech capex is booming, however, it accounts for only one-third of US business investment (and less than 5% of GDP), with other segments weak – chart 8.

Chart 8

Chart 8 showing US Business Investment* (% yoy) *Current Prices

The dispersion of real narrow money momentum across countries has narrowed – chart 9. Adjusted for a recent apparent data distortion, US momentum remains slightly below the Eurozone level. Japan is still a negative outlier but the UK has returned to mid-range. Strength in Australia / Canada suggests upside economic and rates risk, with an opposite message from a Swedish move into contraction.

Chart 9

Chart 9 showing Real Narrow Money (% 6m)

Global real narrow money momentum remains below its long-run average but is nevertheless above weak industrial output momentum, suggesting “excess” money support for markets – chart 10.

Chart 10

Chart 10 showing G7 + E7 Industrial Output & Real Narrow Money (% 6m)

Against this, risk assets have usually corrected – or worse – in the 18 months leading up to stockbuilding cycle troughs, with another such window now open on the analysis here. Table 1 compares moves in selected asset prices in the current cycle with averages across the previous nine cycles, with the mean maximum rise from the beginning of the cycle in column 1 and the subsequent fall into the cycle trough in column 2.

Table 1

Table 1 compares moves in selected asset prices in the current cycle with averages across the previous nine cycles, with the mean maximum rise from the beginning of the cycle in column 1 and the subsequent fall into the cycle trough in column 2.

Global / US equities, tech and other cyclical sectors, and precious metals have significantly outperformed their average gains in the current cycle, suggesting larger-than-normal reversals into the cycle trough. By contrast, European equities, EM, small caps and industrial commodity prices are lagging their respective averages, so may have more upside potential while a positive environment persists and / or prove more resilient in a subsequent risk-off phase.

A fall in the US dollar boosted risk appetite in 2025. The timing of the decline echoes the last three housing cycles, in which the dollar trended lower from an overvalued level in the years preceding and beyond the cycle trough – chart 11.

Chart 11

Chart 11 showing Real US Dollar Index vs Advanced Foreign Economies Based on Consumer Prices, January 2006 = 100, Source: Federal Reserve / BIS

US currency weakness could become market-negative if a decline becomes disorderly, resulting in upward pressure on longer-term rates, for example in the event of further fiscal profligacy or unwarranted additional rate cuts by a politically controlled Fed. Alternatively, a negative market shift could be triggered by a temporary dollar rebound, if US economic news surprises positively and the Fed remains orthodox. Dollar sentiment and positioning were contrarian-bearish at the start of 2025 but current signals are neutral / positive.

Woman visiting beautiful town in Cinque Terre coast, Italy.

Despite ongoing macroeconomic uncertainties and some softness in business activity, financial results published from our holdings for 2023 reassured us. On average, both margins and earnings held up relatively well. Here are two examples of holdings that contributed positively during the first quarter of 2024.

Sopra Steria Group:

Sopra has historically managed mid-single digit organic growth in addition to consistent quality M&A to enhance topline growth. Its historical margins, however, have lagged larger peers like Accenture or CapGemini due to the acquisition of Steria in 2014 which was dilutive to margins [Steria was 350 basis points (bps) below Sopra’s margin], as well as some segments and geographies where management has somewhat sacrificed margins for growth. In 2023, despite additional margin dilution from recent acquisitions, Sopra achieved a 9.4% operating margin, its highest since 2011, and much closer to the 10% to 12% expectation for a major European IT service firm. This was driven by increased pricing, operational efficiencies and scale. We expect Sopra to reach and maintain this improved margin profile in the next couple of years, while maintaining a defensive end-market profile than peers. As such, we remain optimistic on the name.

Melia Hotels International:

After the initial collapse of travel in 2020, when Melia saw its sales drop 70% year over year, the resort hotel operator enjoyed explosive revenue growth due to what analysts coined “revenge travel.” While 2023 saw more normalized 14% topline growth after two years of high double-digit growth, there is still plenty of room for sustainable growth on both the top and bottom line. Despite reaching peak EBITDA from 2018, margins remain a full 200 bps before pre-COVID and there is no reason to believe pre-COVID margins cannot be reached again as the inflationary environment normalizes. Furthermore, the company announced earlier this year the sale of 38% of three of its hotels to Santander for €300 million, strengthening Melia’s balance sheet through deleveraging, while highlighting the bank’s confidence in Melia’s growth prospects. Overall, the company appears quite confident in its 2024 outlook. Despite concerns that inflation could impact discretionary spending including travel and lodging, Melia expects low double-digit RevPAR growth driven equally by price and occupancy, which seems supported by strong January and February data.

Over the next weeks, European companies will start publishing their Q1 revenues, and with it, their outlooks for 2024. The comparison basis with Q1 of 2023 could prove challenging, but we are still projecting companies to generate positive earnings growth for this calendar year. Here are some observations that tend to support our view that the economic improvement could continue:

Real wage growth and savings rates are supportive: After experiencing negative mid-single digit growth in 2022, the Eurozone and the UK are now back to positive real wage growth. As a result, saving rates have started to climb and the gap with the US has widen. As shown below, EU and UK gross savings rates are very supportive compared to the US. The economic activity could react positively to a scenario where households decide to shift a portion of that disposable income into consumption.

Savings rates across the US, the UK and the Eurozone

Chart 1: Line graph showing EU, UK and US gross savings rates, 2015 to 2024.
Source: Berenberg.

European optimism is growing: Business surveys and confidence indices are showing early signs of recovery, as indicated by the latest release on the German business outlook. Although it may not immediately translate into new orders, it could play an important role in how the second half of this year develops.

The housing market is stabilizing: Mortgage approvals in the UK bounced back in February to a level not seen since September 2022. A similar picture can be observed in Germany after two years of excessive contractions. Although corporate loans were still declining in the first quarter of 2024, we are starting to see credit conditions easing for mortgages, a first since 2021.

The destocking cycle is coming to an end: The destocking cycle that started in early 2023 has contributed to a very low level of stocks. Some industries might even carry too low a level of stocks in the event that pent-up demand returns in the second half. Any uplift in order intake would require a higher level of stocks, which would revitalize the manufacturing sector.

Valuation discount: The wide valuation gap that exists between Europe and Global could be narrowing as economic indicators and confidence improve. As shown by the 12-month forward earnings index below, small and mid-cap stocks are still trading at discount vis-a-vis Global. A potential rate cut, expected in June, combined with a reacceleration of demand, would likely drive small and mid-cap companies.

Forward 12-month earnings for European companies vs. the Global market

Chart 2: Line graph showing 12-month forward earnings index for Europe and Global small, mid- and large-cap indicies, 2019 to 2024.
Source: Berenberg.

In a world where the unexpected has become the norm, our holdings’ resilience through last year’s ups and downs offers a sense of stability and growth potential amid uncertainty – and an opportunity to think beyond the immediate to what could be on the horizon.

The ECB under former President Jean-Claude Trichet twice raised interest rates into oncoming recessions (in 2008 and 2011). The current ECB hasn’t raised rates yet but is scaling back QE much faster than was expected late last year.

The six-month rate of change of Eurozone real narrow money had turned negative before the 2008 / 2011 rate rises and subsequent recessions. It is about to do so again now.

In an eerie replay, M. Trichet yesterday gave an interview in which he opined that the Eurozone was “far from recession territory”.

The current ECB seems equally complacent. The staff forecast for GDP growth in 2022 was yesterday lowered from 4.2% to 3.7% but still incorporates quarterly increases of 1.0% in Q2 and Q3, i.e. a combined 2.0% or 4% annualised.

The “best” monetary leading indicator of Eurozone GDP, according to the ECB’s own research, is real non-financial M1, i.e. holdings of currency and overnight deposits by households and non-financial corporations deflated by consumer prices.

The six-month change in real non-financial M1 fell to zero in January and is likely to have been negative in February, based on a further increase in six-month consumer price momentum – see chart 1.

Chart 1

Chart showing Eurozone Narrow Money & Consumer Prices.

The six-month real narrow money change was negative in 18% of months between 1970 and 2019. The average change in GDP in the subsequent two quarters combined was zero. The average since the inception of the euro in 1999 was -0.8%.

Business surveys could be about to crater: the March Sentix survey of financial analysts is ominous – chart 2. The ECB and consensus may portray weakness as a temporary response to Russia’s invasion of Ukraine, drawing a parallel with past geopolitical events that had little lasting economic impact. Monetary trends suggest that a slowdown to stall speed was already in prospect and the Ukraine shock may tip the economy over into recession.

Chart 2

Chart showing Germany Ifo & Sentix / ZEW Surveys.

The ECB is in a policy bind of its own making. The view here is that it is too late to tighten and the only option is to ride out the current inflation storm. The worry for policy-makers is that inflation expectations will become “unanchored”. Fake hawkish rhetoric backed by fantasy GDP forecasts may be their attempted escape route.

Global industrial output has flatlined since early 2021, reflecting supply disruptions but also a loss of demand momentum. Output may recover into 2022 as supply problems ease but money trends signal a further weakening of underlying momentum. Second-round inflation effects, meanwhile, may force central banks to bring forward plans for stimulus withdrawal – unless markets weaken sharply. This backdrop suggests retaining a cautious investment strategy unless money trends rebound in late 2021 – possible but not a central scenario.

The ”monetarist” forecasting approach used here relies on the rules of thumb that 1) real narrow money growth directionally leads demand / output growth by 6-12 months (average 9 months) and 2) nominal broad money growth directionally leads inflation by 1-3 years (average 2+ years). Global narrow / broad money growth surged in 2020 but has slowed this year. This slowdown is being reflected in a loss of economic momentum but the inflationary impact of the 2020 bulge will continue well into 2022. Current “stagflation” concerns, therefore, are likely to persist.

Supply chain disruption is distorting economic data, complicating analysis. The presumption here is that the global manufacturing PMI new orders index is a reasonable guide to underlying industrial demand momentum. The index has fallen since May, mirroring an earlier decline in global (i.e. G7 plus E7) six-month real narrow money growth from a July 2020 peak – see chart 1. With real money growth sliding further into July / August 2021, the suggestion is that the PMI new orders index is unlikely to reach a bottom before early 2022.

Chart 1

Supply chain disruption, however, has resulted in a substantial undershoot of industrial output relative to the growth rate suggested by the PMI new orders index, implying scope for a short-term catch-up – chart 2. Market participants could wrongly interpret such a pick-up as a reversal in trend momentum. Confusing signals could lead to greater market volatility but any revival in the cyclical / reflation trade is likely to be short-lived unless monetary trends – and hence PMI prospects – improve.

Chart 2

The approach here uses cycle analysis to cross-check monetary signals and provide longer-term context. The 3-5 year stockbuilding and 7-11 year business investment cycles are judged to have bottomed in Q2 2020 and are currently providing a tailwind to the global economy, cushioning the impact of less expansionary monetary conditions.

The next cyclical “event” will be a peak and downswing in the stockbuilding cycle. Based on its average historical length of 3 1/3 years, the next cycle low could occur in H2 2023, implying a peak by H2 2022 at the latest. The business survey inventories indicator calculated here, however, suggests that the cycle upswing is already well-advanced, hinting at an early peak – chart 3.

Chart 3

The upshot is that monetary trends suggest a slowdown in global economic momentum through early 2022 while the stockbuilding cycle is likely to act as a drag from H2 2022. This leaves open the possibility of a resumption of strong economic growth in a 2-3 quarter window around mid-2022. An immediate rebound in global real narrow money growth, however, is needed to validate this scenario.

Such a rebound is possible despite the Fed and other central banks moving to wind down stimulus. It could be driven, for example, by Chinese policy easing to support a weak economy, a sharp reversal in commodity prices as industrial momentum softens (boosting real money growth via a near-term inflation slowdown) or a pick-up in bank lending (normal at this stage of stockbuilding / business investment cycle upswings). It is, however, unnecessary to speculate – it is usually sufficient for forecasting purposes to respond to monetary signals rather than try to anticipate them.

Chart 4 shows a breakdown of G7 plus E7 six-month real narrow money growth. Earlier US relative strength / Chinese weakness has been reflected in divergent year-to-date equity market performance, with DM ex. US and EM ex. China indices charting a middle course. A recent cross-over of US real money growth below the G7 ex. US average suggests reducing US exposure in favour of other developed markets.

Chart 4

Chinese real money growth, meanwhile, was showing signs of bottoming before the recent escalation of financial difficulties at property developer Evergrande. This could result in faster policy easing, an “endogenous” tightening of credit conditions, or both. The net monetary impact is uncertain but a recovery in money growth in late 2021 would argue for adding Chinese exposure in global and EM portfolios despite likely further weakness in economic data.

Investors continue to debate whether high inflation is “transitory” as central bankers naturally assert. The monetarist view is straightforward: the roughly 2-year transmission of money to prices implies no significant inflation relief before H2 2022, while a return to pre-covid levels requires a further slowdown in global broad money growth.

Inflation drivers are likely to shift, with energy and other industrial commodity prices cooling as the global economy slows but offsetting upward impulses from food, rents and accelerating unit wage costs as labour shortages and mismatches force pay rises above productivity growth.

Rising labour costs could, in theory, be absorbed by a reduction in profit margins rather than being passed on in prices. Recent profits numbers, however, overstate underlying health because of stock appreciation and pandemic-related government support. The share in US national income of an “economic” measure of corporate profits (i.e. adjusted for inventory valuation effects and Paycheck Protection Program subsidies, and to reflect “true” depreciation) is in line with its average over 2010-19, in contrast to inflated book profits – chart 5.

Chart 5

G7 annual broad money growth has fallen from a peak of 17.3% in February 2021 to 8.3% in August, with 3-month annualised growth at 6.2%. This is still high by pre-covid standards: annual growth averaged 4.5% over 2015-19. Reduced support to money growth from QE could be offset by faster expansion of bank balance sheets, reflecting strong capital / liquidity positions and rising credit demand. US commercial bank loans and leases have recently resumed growth, with the Fed’s senior loan officer survey suggesting a further pick-up – chart 6. The ECB’s lending survey is similarly upbeat.

Chart 6

Adding in the E7, annual broad money growth is closer to the pre-covid level, at 8.2% in August versus a 2015-19 average of 6.4% – chart 7. Growth is below average in China, Mexico and Russia and in line in India. Inflationary pressures are more likely to prove “transitory” in these economies, suggesting support for local bond markets.

Chart 7

Global equities held up over the summer despite weaker activity news and upside inflation surprises. A monetarist explanation is that markets were supported by “excess” money, as supply disruptions contributed to global six-month industrial output growth falling below real narrow money growth – chart 8. A temporary output catch-up as supply problems ease could reverse this crossover – a further argument for maintaining a cautious investment stance emphasising defensive sectors and quality.

Chart 8

An FTarticle lists “Five big questions facing the Bank of England over rising inflation”. The most important one is missing: will broad money growth return to its pre-covid pace?

The current inflation increase, from a “monetarist” perspective, is directly linked to a surge in the broad money stock starting in spring 2020. Annual growth of non-financial M4 – the preferred aggregate here, comprising money holdings of households and private non-financial corporations (PNFCs) – rose from 3.9% in February 2020 to a peak of 16.1% a year later.

The monetarist rule of thumb is that money growth leads inflation with a long and variable lag averaging about two years. This is supported by research on UK post-war data previously reported here – turning points in broad money growth preceded turning points in core inflation by 27 months on average.

The lead time is variable partly because of the influence of exchange rate variations. For example, the disinflationary impact of UK monetary weakness after the GFC was delayed by upward pressure on import prices due to sterling depreciation.

The exchange rate has been relatively stable recently but the rise in inflation has been magnified by pandemic effects, which may mean that a peak occurs earlier than suggested by the February 2021 high in money growth and the average 27 month lag. The working assumption here is that core inflation will peak during H1 2022.

CPI inflation, however, is likely to overshoot the current Bank of England forecast throughout 2022 – chart 1 shows illustrative projections for headline and core rates.

Chart 1

The past mistakes of monetary policy are baked in. The MPC should focus on current monetary trends in assessing how to respond to its current / prospective inflation headache.

Annual broad money growth has fallen steadily from the February peak but, at 9.0% in July, remains well above the 4.2% average over 2010-19, a period during which CPI inflation averaged 2.2%. So monetary data have yet to support the MPC’s assertion that the inflation overshoot is “transitory”.

The pace of increase, however, slowed to 4.4% at an annualised rate in the three months to July – chart 2. Household M4 rose by 5.8% with PNFC holdings little changed. In terms of the credit counterparts, bank lending to households and PNFCs grew modestly (4.1%) while a continued QE boost was offset by negative external flows, suggesting balance of payments weakness.

Chart 2

With QE scheduled to finish at end-2021 (if not before), and a temporary boost to mortgage lending from the stamp duty holiday over, money growth couldbe gravitating back to its pre-covid pace.

An early interest rate rise, on the view here, is advisable to reinforce the recent monetary slowdown and push back against rising inflation expectations. It is premature, however, to argue that a sustained and significant increase in rates will be needed to return inflation to target beyond 2022 – further monetary evidence is required.

It would be unfortunate if, having fuelled the current inflation rise by questionable policy easing, the MPC were now to raise expectations of multiple rate hikes at a time when monetary growth could be returning to a target-consistent level.

Detailed monetary data for July released yesterday suggest that recent policy easing is beginning to support money growth, in turn hinting at a recovery in economic momentum from end-2021.

A sustained slowdown in six-month narrow money growth from July 2020 correctly signalled “surprise” Chinese economic weakness so far in 2021. The expectation here was that the PBoC would ease policy in Q2, supporting economic prospects for later in 2021. Adjustment was delayed but the reserve requirement ratio cut on 9 July appeared to mark a significant shift. The hope was that July monetary data would confirm a bottom in money growth.

The headline July numbers released on 11 August seemed to dash this hope, with six-month of “true M1” falling to a new low – see chart 1*.

Chart 1

The additional data released yesterday allow a breakdown of the deposit component of this measure between households, non-financial enterprises and government departments / organisations. It turns out that the further fall in growth in July was due to the latter public sector element, which is volatile and arguably less important for assessing prospects for demand and output.

Six-month growth of “private non-financial M1”, i.e. currency in circulation plus demand deposits of households and non-financial enterprises, rose for a second month in July. So did the corresponding broader M2 measure – chart 1.

This improvement needs to be confirmed by a recovery in overall narrow money growth in August, ideally accompanied by a further increase in the private sector measure. One concern is that the rebound in the latter has so far been driven by the household component – enterprise money growth remains weak.

Increased bond issuance and fiscal easing could lift public sector money growth during H2.

The corporate financing index in the Cheung Kong Graduate School of Business monthly survey is a useful corroborating indicator of money / credit trends – a rise signals easier conditions. The index bottomed in March but has yet to improve much – chart 2. August survey results will be released shortly.

Chart 2

*True M1 includes household demand deposits, which are omitted from the official M1 measure.

The fall in UK CPI inflation in July reported this week will be of limited comfort to policy-makers – a decline had been expected because of a large base effect and will be more than reversed in August. A bigger story was the further widening of the RPI / CPI inflation gap to an 11-year high. RPI inflation could top 5.5% in Q4 2021, boosting interest payments on index-linked gilts by a whopping £15 billion relative to the OBR’s Budget forecast.

CPI inflation fell from 2.5% in June to 2.0% in July but RPI Inflation eased by only 0.1 pp to 3.8%. RPIX inflation – excluding mortgage interest – was stable at 3.9%.

The RPI / CPI inflation gap, therefore, widened to 1.8 pp, its largest since June 2010. The RPIX / CPI inflation gap of 1.9 pp is the biggest on record since the inception of CPI inflation data in 1989 – see chart 1.

Chart 1

The widening gaps mainly reflect surging house prices, driven partly by Chancellor Sunak’s stamp duty holiday. House prices enter the RPI via the housing depreciation component*, which is linked to ONS house price data with a short lag – chart 2. This component has a 9.0% weight and rose by 9.9% in the year to July, contributing 0.9 pp to RPI inflation of 3.8%. The CPI omits owner-occupier housing costs.

Chart 2

Note that the housing depreciation weight has risen from 5.8% in 2014, i.e. the sensitivity of the RPI to house prices has increased by more than 50% since then.

The RPI / CPI and RPIX / CPI inflation gaps, however, have widened by more than implied by house prices alone – chart 3.

Chart 3

A likely additional influence has been the ONS decision to depart from its normal procedure and base 2021 CPI weights on 2020 rather than 2019 expenditure data. As previously explained, this has lowered the weight of categories hit hardest by the pandemic but now experiencing a rebound in demand and prices. An alternative calculation carrying over 2020 weights (based on 2018 expenditure data) to 2021 produces an annual inflation number for July of 2.5% rather than 2.0% – chart 4.

Chart 4

The RPI has been less affected because the normal procedure was followed of basing weights on expenditure shares in the 12 months to June of the previous year. 2021 weights, therefore, reflect spending in the year to June 2020 – the impact of the pandemic was smaller over this period than in calendar 2020.

So weighting effects are likely to have had a larger negative impact on CPI than RPI inflation.

The phase-out of the stamp duty holiday is being reflected in a slowdown in housing market activity but estate agents expect a shortage of supply to support prices, according to the RICS survey. Recent strength may not yet have fed through fully to the RPI housing depreciation component – the annual rise in the latter of 9.9% in July compares with a 13.2% increase in the ONS house price index in the year to June.

Assume, as a reasonable base case, that that the annual increase in the housing depreciation component moderates to 8.0% in Q4 2021 while other influences on the RPI / CPI inflation gap are stable. This would imply a decline in the gap from the current 1.8 pp to 1.6 pp. The Bank of England’s August forecast of CPI inflation of 4.0% in Q4 would then read across to RPI inflation of 5.6%.

The OBR’s March Economic and fiscal outlook projected a 2.4% rise in the RPI in the year to Q4 2021. According to its debt interest ready reckoner, a 1% rise in the RPI boosts interest costs on index-linked gilts by £4.8 billion in the following year. The suggested Q4 overshoot of 3.2 pp, therefore, implies a spending increase of £15.2 bn – or 0.6% of annual GDP – relative to Budget plans.

*House prices also feed into the mortgage interest component, as well as estate agents’ fees and ground rent.

Monetary trends continue to suggest a slowdown in global industrial momentum in H2 2021, with a rising probability that weakness will be sustained into H1 2022 – contrary to the prior central view here that near-term cooling would represent a pause in a medium-term economic upswing. Pro-cyclical trends in markets have corrected modestly but reflationary optimism remains elevated, indicating potential for a more significant setback if economic data disappoint. Chinese monetary policy easing is judged key to stabilising global prospects and reenergising the cyclical trade.

Global six-month real narrow money growth – the “best” monetary leading indicator of the economy – peaked in July 2020 and extended its fall in May, dashing a previous hope here of a Q2 stabilisation / recovery. This measure typically leads turning points in the global manufacturing PMI new orders index by 6-7 months but a PMI peak was delayed on this occasion by a combination of US fiscal stimulus and economic reopening. A June fall in new orders, however, is expected to mark the start of a sustained decline, confirming May as a significant top – see chart 1.

Chart 1

The magnitude of the fall in global real narrow money growth and its current level suggest a move in the manufacturing new orders index at least back to its long-run average of 52.5 during H2 (May peak = 57.3, June = 55.8).

China continues to lead global monetary / economic trends, as it has since the GFC. A strong recovery in activity through 2020 prompted the PBoC to withdraw stimulus in H2, resulting in a money / credit slowdown that has fed through to weaker H1 2021 economic data. The central bank, however, has been reluctant to change course, partly to avoid fuelling house and commodity price speculation, and six-month real narrow money growth has now fallen to a worryingly low level, suggesting rising risk of a “hard landing” in H1 2022 – chart 2.

Chart 2

Real narrow money growth remains above post-GFC averages in other major economies but has also fallen significantly, reflecting both slower nominal expansion and a sharp rise in consumer price inflation. Six-month inflation is likely to fall back during H2 but nominal trends could weaken further in response to higher long-term rates and as money-financed fiscal stimulus moderates.

The suggestion from monetary trends of a deeper and more sustained economic slowdown could be argued to be inconsistent with cycle analysis. In particular, the global stockbuilding or inventory cycle bottomed in Q2 2020 (April) and, based on its 40-month average length, might be expected to remain in an upswing through early 2022, at least. This understanding informed the previous view here that a cooling of industrial momentum in mid-2020 would prove temporary.

A reassessment, however, may be warranted to take account of the distorting impact of the covid shock, which stretched the previous cycle to 50 months. A compensating shortening of the current cycle to 30 months would imply a cycle mid-point – and possible peak – in July 2021.

This alternative assessment is supported by a rise in the business survey inventories indicator monitored here to a level consistent with prior cycle peaks – chart 3.

Chart 3

The previous quarterly commentary suggested that cyclical equity market sectors and value were less attractive in the context of an approaching PMI peak, while quality stocks had potential to rally. MSCI World non-tech cyclical sectors lagged defensive sectors during Q2, with quality and growth outperforming value – chart 4. These trends could extend if the slowdown scenario described above plays out. Chinese policy easing would support the cyclical / value trade but the impact could prove temporary unless the Chinese shift resulted in an early rebound in global real narrow money growth.

Chart 4

Counter-arguments to the relatively pessimistic economic view outlined above include the following:

1. Fiscal policy remains highly expansionary and will offset monetary weakness.

Response: Economic growth is related to the change in the fiscal position and deficits, while large, are falling in most countries. Even in the US, President Biden’s stimulus package served mainly to neutralise a potential drag as earlier measures expired. The US fiscal boost peaked with the disbursement of stimulus cheques in March / April.

2. Household saving rates and money balances are high, implying pent-up consumer demand.

Response: Savings rates have been temporarily inflated by government transfers and will normalise as these fall back and consumption recovers to its pre-covid level. High money balances probably reflect “permanent” savings. US households planned to spend only 25% of the most recent round of stimulus checks, according to the New York Fed, using the rest to increase savings and reduce debt. The implied spending boost has already been reflected in retail sales, which may fall back in Q3.

3. Services strength as economies reopen will offset any industrial slowdown.

Response: The services catch-up effect is temporary and momentum is likely to reconnect with manufacturing in H2. Industrial trends dominate economic fluctuations and equity market earnings.

4. Profits are rising strongly, with positive implications for business investment and hiring.

Response: Profits are still receiving substantial support from government subsidies, withdrawal of which will offset much of the additional boost from economic normalisation. An increase in net subsidies relative to their Q4 2019 level accounted for 10% of US post-tax corporate economic profits in Q1, according to national accounts data – see chart 4.

Chart 5

5. Inventories to shipments ratios remain low, implying that the stockbuilding cycle is far from peaking.

Response: Economic growth is related to the change in stockbuilding, not its level. Stockbuilding is highest when inventories are low – the subsequent fall is a drag on growth even though stockbuilding usually remains high until inventories normalise. Low inventories to shipments ratios, therefore, are consistent with a cycle peak.

6. Industry has been held back by supply constraints – output and new orders will surge as these ease.

Response: Supply difficulties have probably resulted in firms placing multiple orders for inputs, inflating PMI readings – this effect will unwind as bottlenecks ease. Historically, manufacturing PMI new orders have fallen, not risen, following a peak in supply constraints.

7. Rising inflation will boost bond yields, supporting cyclical / value outperformance.

Response: Last year’s global money surge was expected here to be reflected in high inflation in 2021-22 but six-month broad money growth has moved back towards its pre-covid average, suggesting that medium-term inflation risks are receding. Bond yields usually track industrial momentum more closely than inflation data so would probably remain capped in a slowdown scenario even if inflation news continues to surprise negatively.

This year has started on strong footing for global mergers and acquisitions (M&A). According to Refinitiv, global M&A hit a new record of $1.3 trillion as of March 31st, 2021.[1] What is driving this boom? On the news we have seen many big deals take shape, from GE divesting its business to Canadian Pacific expanding its footprint. But behind the headlines, something else is accelerating M&A activities, especially in the Unites States (US). We are talking about SPAC, which alone represent about 25% of the total deal volume in the US.

The first quarter of this year was also one of the busiest for IPOs, of which, once again, SPACs took the limelight. There were 296 SPACs raising $87 billion, a 20-fold increase over the same period last year.

What is a SPAC?

A SPAC or “Special Purpose Acquisition Corporation” is a vehicle used to acquire a private company and make it public without going through the traditional IPO process. Back in the 1980s, there was something called a “blank check offering”. These were companies focused on finding promising operating enterprises — prospects that sounded great on brokers’ cold call pitches (typical “pump and dump” schemes). Fraud and manipulation was so rampant among these blank check companies, the SEC adopted Rule 419 under the Securities Act of 1933 , “requiring investors’ funds to be held in escrow, filing of a post-effective amendment upon execution of an acquisition agreement, and the return of the escrowed funds if an acquisition has not occurred within 18 months of the effective date of the initial registration statement.”.

David Nussbaum, a Long Island based lawyer and CEO of GKN Securities, understood the new rules would reduce interest from investors. So he reinvented the blank check concept in 1992, and SPACs were born. The SPAC structure allowed for trading, but included many provisions to protect investors — like allowing investors to opt out of the merged company and get their money back once a deal is done.

How do SPACs work?

First, a sponsor raises capital and incurs the cost of an IPO in a new shell company. To make the deal attractive to investors, the units are usually priced at $10 each and provide a warrant to buy more shares. The sponsor then has 12 to 24 months to find the target. If no target is found, or if the investors decide to vote “no” on the deal, the holders can redeem their investments.

We have seen this movie before

SPACs are in their third decade of existence. In the early 1990s, they were marketed as vehicles that helped small companies go public, while offering outsized favourable terms to their sponsors. In the late 90s, SPACs took a back seat. After all, why would a company do a reverse merger when you could easily raise money during the tech bubble? SPACs enjoyed a renaissance in late 2002, peaking at 66 IPOs just before the great financial crisis. They reappeared in early 2016, and have been going strong ever since. According to SPAC Analytics, in 2020, SPACs were 55% of IPOs, compared to 4% in 2013. So far this year, SPACs represent 79% of total IPOs.

SPACs versus a traditional IPO

SPACs are a pure genius way of going public. Since there is no identified target, a sponsor’s prospectus has no information about the business or the strategy. On the other hand, an IPO roadshow raises a lot of questions and invites a lot of scrutiny from investors.

In an IPO, there is no guarantee on the final valuation of the company. With a SPAC, the IPO has been done, and you have negotiated the valuation of your company with the sponsor. Plus the due diligence required for a merger is much less than SEC requirements for a regular IPO.

Cost could be another key factor. An IPO can cost anywhere between one to seven percent in fees for investment banks. With a SPAC, the underwriter may charge about five to six percent. However, there are other fees associated with the merger, which can end up being almost 20-25 percent of the total money the sponsor may raise.

Why are SPACs so popular?

A recent Wall Street Journal article counted 61 sports-related SPACs formed this year alone, compared to just five in 2019.[2] Athletes from Serena Williams, Stephen Curry, Naomi Osaka, Tony Hawk, Colin Kaepernick, and even Shaquille O’Neal, have shown interest in SPACs.

Everyone loves money, especially free money. SPAC founders and sponsors generally get about 20% of the shares of the SPAC as a fee for raising capital, finding the target, and, of course, giving it their brand name. Hedge Funds like it because they can use leverage to buy SPACs and also get preferential access to SPAC deals at the $10 share price. Everyone else has to wait and likely pay a higher price.

Most investors don’t read the annual reports of the companies they own, so they miss out on the fine print in the SPAC prospectus. For example, many are unaware of the lock-up period, which can be anywhere from six months to a year. Once the lock-up period is over, the floodgates open and add pressure to the stock price. 

The clock is ticking?

SPACs don’t have time on their side because there is a limited window to close a deal. Targets are well aware of this restriction. They also know that a SPAC is required to spend at least 80% of its assets on a single deal. So the target always has the advantage. SPACs are paying a median price-to-sales ratio of 12.9, compared to 4.1 paid by other companies, according to 451 Research.[3]

SPAC-mania has been going on for a few years now, which means there is a lot of capital chasing deals, combined with ticking clock syndrome, which signals an inevitable decline in deal quality. We could easily see the SPAC bubble go bust once again.

How have SPACs performed historically?

A team of researchers analyzed completed mergers from January 2019 and June 2020, and found that SPACs lost 12% within the first six months, and dropped 35% on average after the first year. Bain & Co looked at 121 SPAC mergers from 2016 to 2020 and concluded that “more than 60% have lagged the S&P 500 since their merger dates, and 50% are trading down post-merger”. The other 40% are trading below the $10 IPO price.

Portfolio Impact

Regulators like the SEC are beginning to take a closer look at SPACs. SEC recently issued an investor alert pointing out that just because celebrities are backing SPACs doesn’t mean retail investors should follow suit.

At Global Alpha, we do not invest in SPACs. Our focus is on finding high-quality companies with defensible business models and strong balance sheets that should outperform the small-cap benchmark.


[1] https://news.yahoo.com/deal-making-smashed-records-q1-141243172.html  

[2] https://www.wsj.com/articles/the-celebrities-from-serena-williams-to-a-rod-fueling-the-spac-boom-11615973578

[3] https://usa-latestnews.com/technology/with-valuations-on-us-startups-skyrocketing-spacs-are-starting-to-shop-overseas/