The assessment in the previous quarterly commentary was that the monetary backdrop for markets had deteriorated at end-2020. This was arguably reflected in weak bond market performance during Q1 but global equities rose further as earnings expectations were revised higher. The monetary indicators followed here continue to give a cautionary message for markets while suggesting that global industrial momentum will slow into late Q3. A summer growth “scare” could trigger a correction in equities and a recovery in defensive sectors.
The market assessment relies on two indicators of “excess” money, which, according to the “monetarist” view, is a key influence on demand for financial assets: the difference between global six-month real narrow money and industrial output growth, and the deviation of 12-month real money growth from a long-term moving average. The entire outperformance of global equities relative to US dollar cash since 1970 occurred during periods when both indicators were positive. Equities underperformed cash on average when either or both were negative.
Allowing for data publication lags, the indicators gave a joint positive signal at end-April 2020. The MSCI All Country World Index (ACWI) returned 33.9% in US dollar terms between then and end-2020, reflecting both a recovery in earnings expectations and a rerating of markets. The “buy” signal, however, was rescinded at end-December following a cross-over of real narrow money growth beneath industrial output growth – see chart 1.
Chart 1
Global equities derated during Q1 – the ACWI 12-month-forward PE ratio fell by 4.2% – but the index nevertheless returned 4.7% as forecast earnings rose by a further 8.6%. Earnings optimism was boosted by confirmation of additional large-scale US fiscal stimulus, which also contributed to continued outperformance of cyclical sectors. The view here, however, is that global industrial momentum is peaking and will slow through late 2021. This would be a shock to the consensus and could trigger an unravelling of recent market trends.
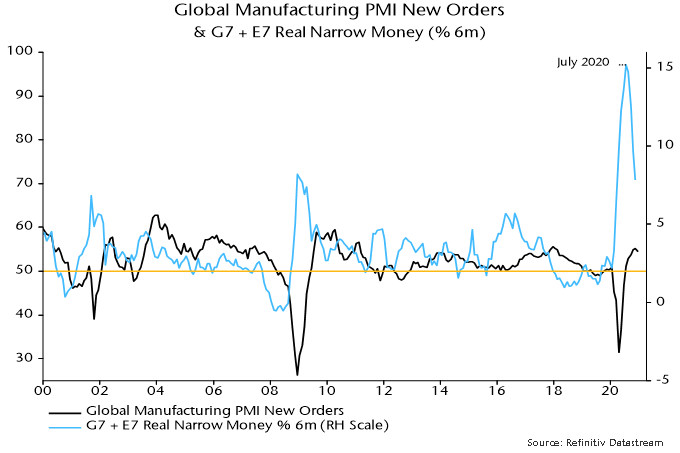
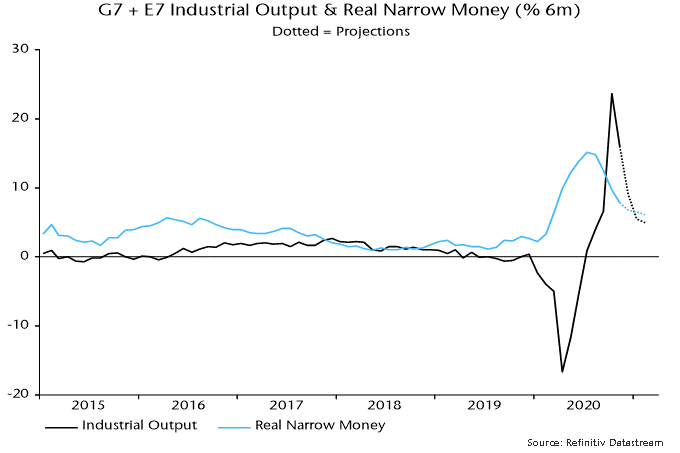
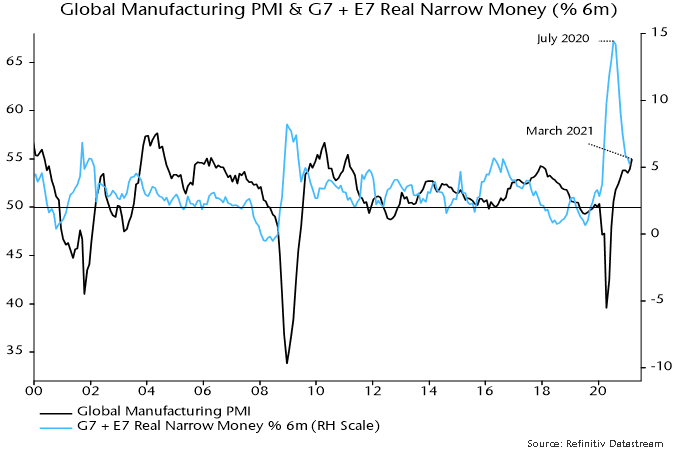
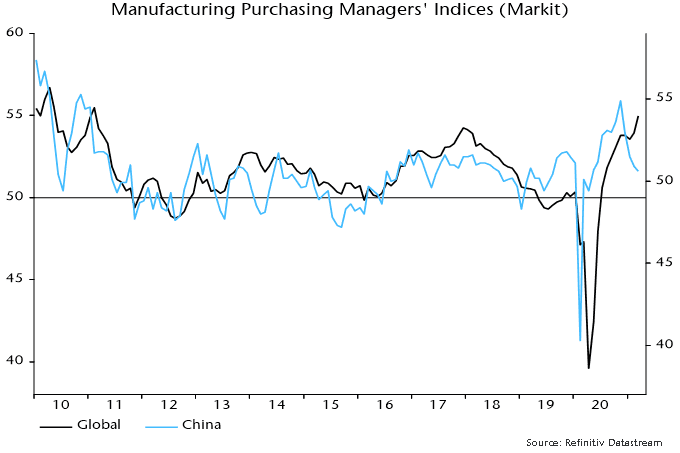
The slowdown forecast rests on the relapse of global six-month real narrow money growth from its July-August 2020 peak – turning points have led those in industrial output growth by nine months on average historically. The lead time on the global manufacturing purchasing managers’ index (PMI) is slightly shorter, suggesting that a new high in the index reached in March will mark the peak of the current upswing – chart 2.
Chart 2
China’s industrial recovery has already decelerated, with the Markit / Caixin manufacturing PMI falling to an 11-month low in March. Chinese monetary policy was less stimulative than elsewhere in H1 2020 and retightened in H2, explaining relatively weak money trends – chart 3. China’s PMI has led the global measure since the GFC – chart 4.
Chart 3
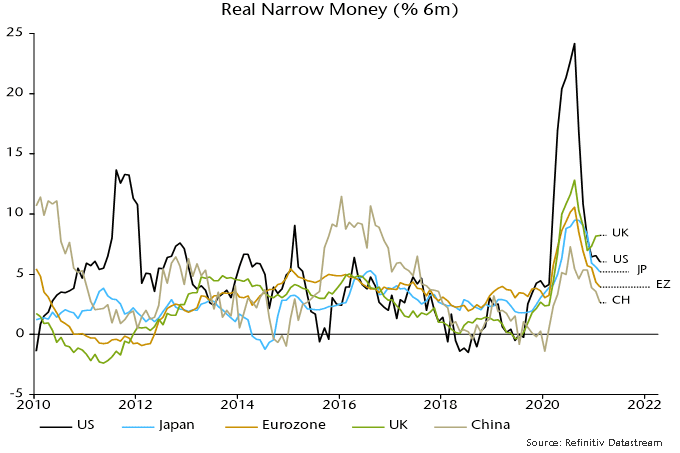
Chart 4
Global six-month real narrow money growth continued to subside in February. A recovery could unfold into the summer as US money numbers are boosted by disbursement of fiscal stimulus and if the PBoC relaxes policy in response to softer economic data. Such a scenario could result in another “excess” money buy signal by mid-year while suggesting industrial reacceleration from late 2021. A money growth rebound, however, is likely rather than guaranteed and the judgement here is that the focus for now should be on downside economic / market risks.
An industrial slowdown could be offset in GDP terms by services strength if covid developments allow economic reopening. This could, however, contribute to industrial deceleration by reversing last year’s substitution by consumers of goods for services spending. Industrial trends are likely to be more important for markets, partly reflecting a stronger correlation with equity earnings. Services-driven GDP strength could make central banks less inclined to offer support in the event of industrial / market weakness.
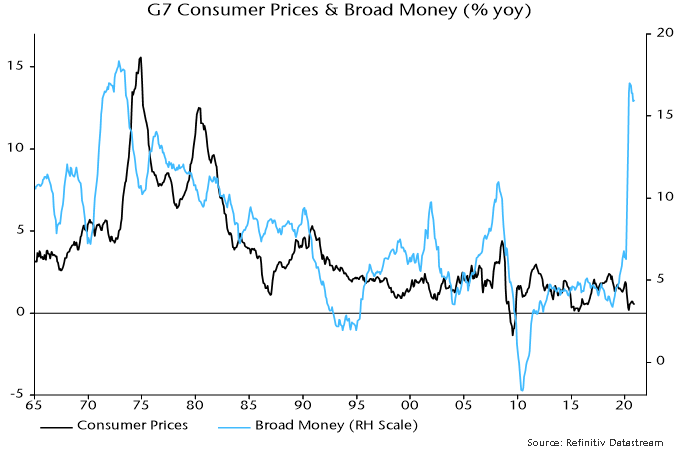
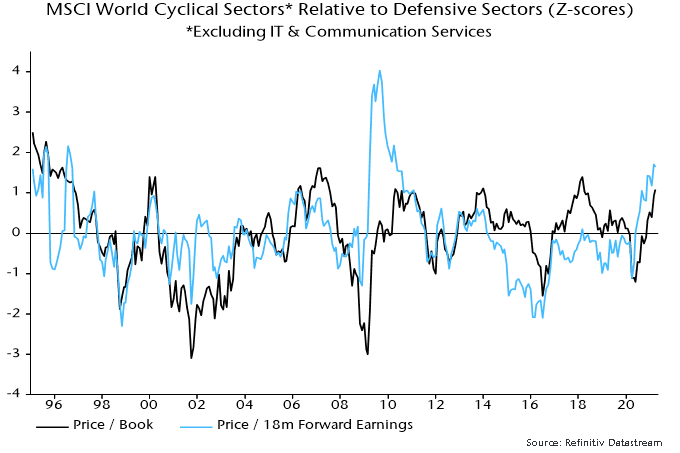
Global CPI inflation rates are spiking higher in reflection of recent commodity price moves and base effects but inflation worries could be near a short-term peak if the above industrial scenario unfolds – another reason for doubting that the cyclical / value rally will extend in Q2. Input price components of business surveys will fall away into the summer barring another surge in oil and other industrial commodities – chart 5. Cyclical sectors may be fully discounting “reflation”, judging by valuation relative to defensive sectors – chart 6.
Chart 5
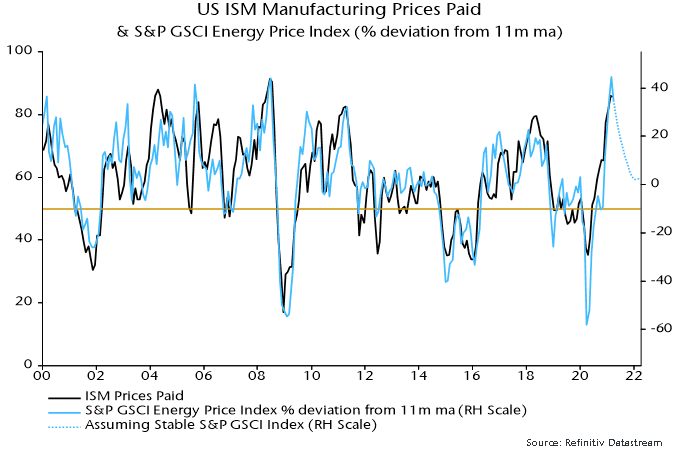
Chart 6
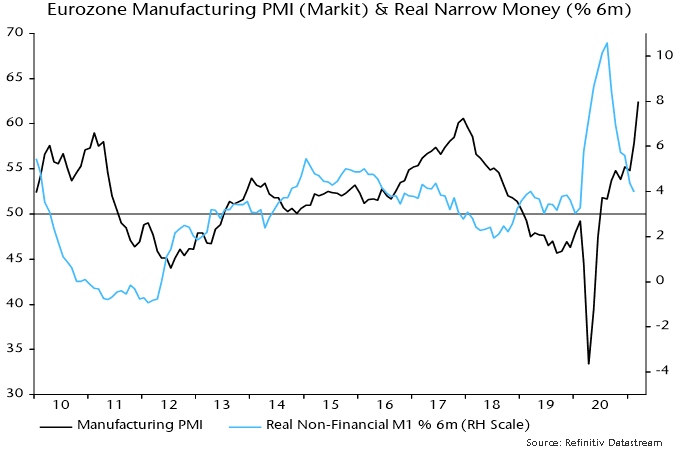
The March rise in the global manufacturing PMI was driven by European components, with the US PMI little changed and China’s – as noted – easing further. Eurozone strength is consistent with a real money growth spike last summer but a subsequent slowdown argues against current levels being sustained – chart 7.
Chart 7
UK money trends, by contrast, are diverging positively from other majors, signalling a relatively bright economic outlook and possible support for UK equities – chart 3. Money growth strength reflects larger-scale monetary deficit financing than in other countries, which may continue given PM Johnson’s big spender bias and a supine Bank of England. “Excess” money could partly flow overseas, suggesting downside risk for sterling, in which speculators appear to have accumulated a significant long position.
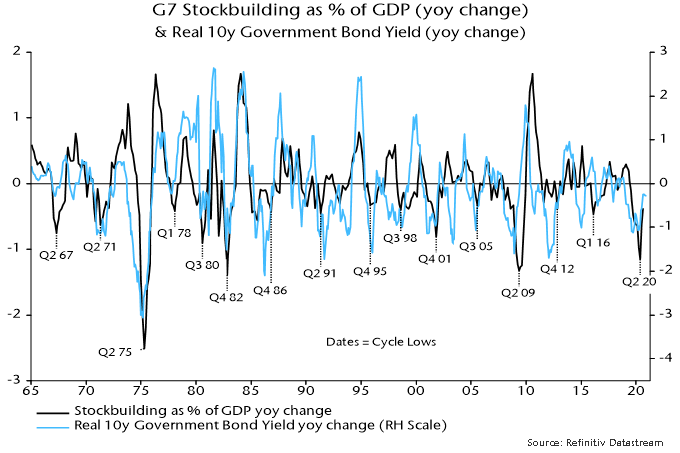
The forecasting approach here uses cycle analysis as a cross-check of the monetary analysis and to provide longer-term perspective. The previous assessment, which is maintained, was that the stockbuilding and business investment cycles bottomed in Q2 2020, while the long-term housing cycle remains in an upswing. The suggestion that all three cycles were turning supportive for the global economy and markets reinforced the positive message from monetary trends in mid-2020.
The next scheduled low is in the short-term stockbuilding cycle. Based on an average historical cycle length of 3.5 years, this could occur in late 2023, with the downswing into the low starting 12-18 months earlier, i.e. in mid- to late 2022. Risk markets tend to weaken in the 18 months leading up to a cycle trough – major equity bear markets have usually occurred during this time window.
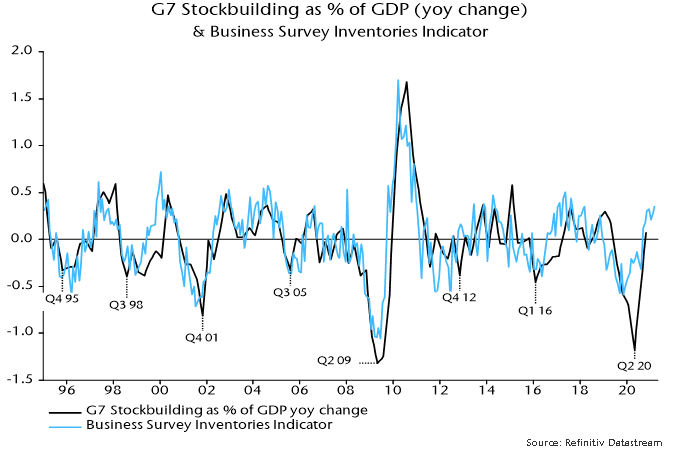
The suggestion is that the primary trend in the global economy and markets will remain up through H1 2022. Stockbuilding cycle upswings, however, typically unfold in a zig-zag pattern, with an initial upthrust followed by a corrective phase before a final move higher into the peak. The judgement here is that the initial phase is ending and cycle momentum will diminish into H2, consistent with the monetary forecast of an industrial slowdown. The view that the initial phase is mature is supported by the business survey inventories indicator in chart 8.
Chart 8
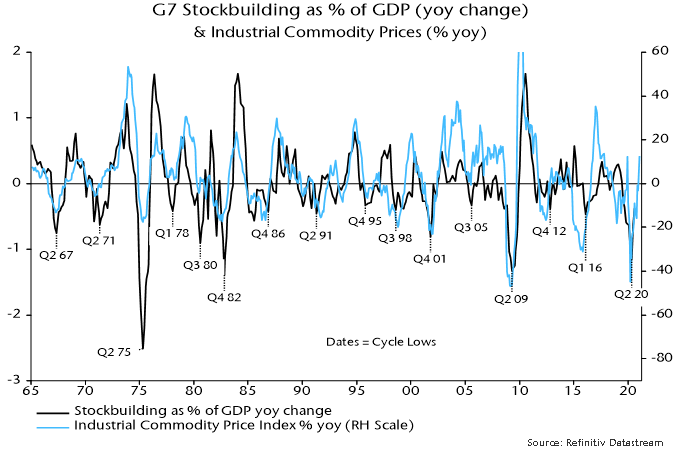
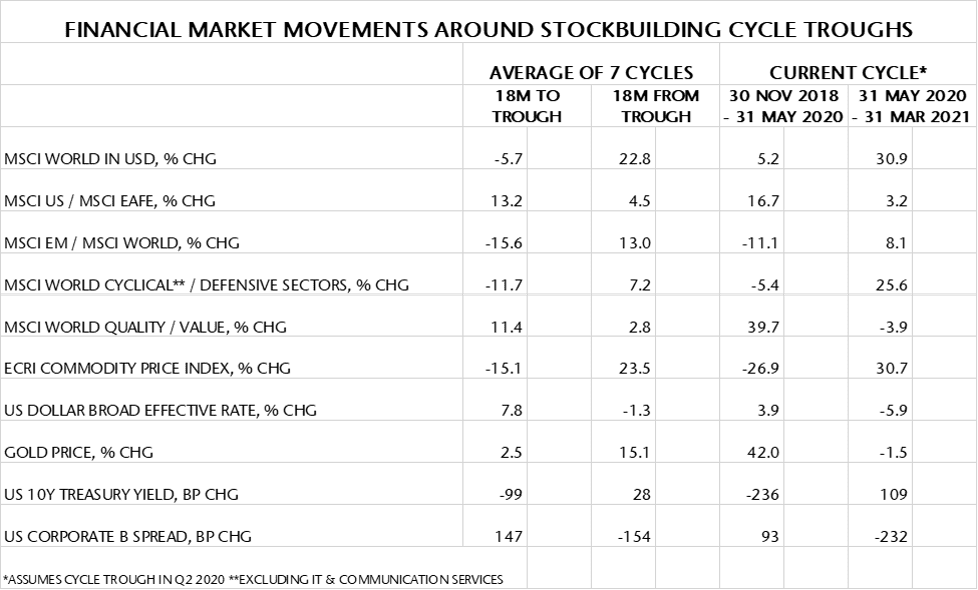
Market moves since Q2 last year, moreover, have in most cases matched or exceeded averages during 18-month periods following previous stockbuilding cycle lows – see table 1. Developed market equities, cyclical sectors and commodity prices, in particular, have performed strongly, suggesting limited further upside even though a stockbuilding cycle downswing may be a year or more away.
Table 1
A further consideration is that the current stockbuilding cycle could be shorter than average. The covid shock appears to have extended the previous cycle to 4.25 years. If the current cycle were to display an offsetting deviation from the average 3.5 years, the next low would occur in early rather than late 2023 (i.e. 2.75 years from the Q2 2020 trough). This, in turn, would imply that the 18-month negative period for markets ahead of the low would start in H2 2021.
The latter possibility, it should be emphasised, is not the central case here and would require confirmation from a further fall in global six-month real narrow money growth during H1 2021 rather than the US-led rebound suggested earlier.
The comparison of recent returns with stockbuilding upswing averages, as well as supporting the case for reducing cyclical sector exposure in favour of defensive sectors, suggests relative value in emerging market equities, quality and gold, and scope for a further rally in the US dollar. Stronger EM equity performance, however, may be conditional on a recovery in Chinese money growth, probably requiring a prior PBoC policy shift.
These are the views of the author at the time of publication and may differ from the views of other individuals/teams at Janus Henderson Investors. Any securities, funds, sectors and indices mentioned within this article do not constitute or form part of any offer or solicitation to buy or sell them.
Past performance does not predict future returns. The value of an investment and the income from it can fall as well as rise and you may not get back the amount originally invested.
The information in this article does not qualify as an investment recommendation.
Marketing Communication.