Woman visiting beautiful town in Cinque Terre coast, Italy.

Despite ongoing macroeconomic uncertainties and some softness in business activity, financial results published from our holdings for 2023 reassured us. On average, both margins and earnings held up relatively well. Here are two examples of holdings that contributed positively during the first quarter of 2024.

Sopra Steria Group:

Sopra has historically managed mid-single digit organic growth in addition to consistent quality M&A to enhance topline growth. Its historical margins, however, have lagged larger peers like Accenture or CapGemini due to the acquisition of Steria in 2014 which was dilutive to margins [Steria was 350 basis points (bps) below Sopra’s margin], as well as some segments and geographies where management has somewhat sacrificed margins for growth. In 2023, despite additional margin dilution from recent acquisitions, Sopra achieved a 9.4% operating margin, its highest since 2011, and much closer to the 10% to 12% expectation for a major European IT service firm. This was driven by increased pricing, operational efficiencies and scale. We expect Sopra to reach and maintain this improved margin profile in the next couple of years, while maintaining a defensive end-market profile than peers. As such, we remain optimistic on the name.

Melia Hotels International:

After the initial collapse of travel in 2020, when Melia saw its sales drop 70% year over year, the resort hotel operator enjoyed explosive revenue growth due to what analysts coined “revenge travel.” While 2023 saw more normalized 14% topline growth after two years of high double-digit growth, there is still plenty of room for sustainable growth on both the top and bottom line. Despite reaching peak EBITDA from 2018, margins remain a full 200 bps before pre-COVID and there is no reason to believe pre-COVID margins cannot be reached again as the inflationary environment normalizes. Furthermore, the company announced earlier this year the sale of 38% of three of its hotels to Santander for €300 million, strengthening Melia’s balance sheet through deleveraging, while highlighting the bank’s confidence in Melia’s growth prospects. Overall, the company appears quite confident in its 2024 outlook. Despite concerns that inflation could impact discretionary spending including travel and lodging, Melia expects low double-digit RevPAR growth driven equally by price and occupancy, which seems supported by strong January and February data.

Over the next weeks, European companies will start publishing their Q1 revenues, and with it, their outlooks for 2024. The comparison basis with Q1 of 2023 could prove challenging, but we are still projecting companies to generate positive earnings growth for this calendar year. Here are some observations that tend to support our view that the economic improvement could continue:

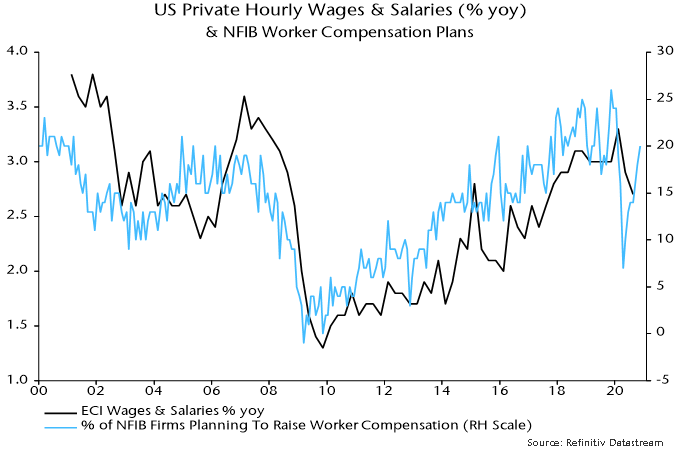
Real wage growth and savings rates are supportive: After experiencing negative mid-single digit growth in 2022, the Eurozone and the UK are now back to positive real wage growth. As a result, saving rates have started to climb and the gap with the US has widen. As shown below, EU and UK gross savings rates are very supportive compared to the US. The economic activity could react positively to a scenario where households decide to shift a portion of that disposable income into consumption.
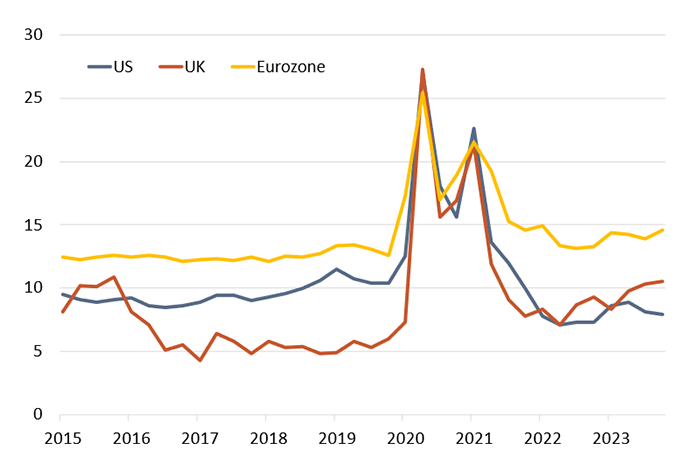
Chart 1: Line graph showing EU, UK and US gross savings rates, 2015 to 2024.
Source: Berenberg.

European optimism is growing: Business surveys and confidence indices are showing early signs of recovery, as indicated by the latest release on the German business outlook. Although it may not immediately translate into new orders, it could play an important role in how the second half of this year develops.

The housing market is stabilizing: Mortgage approvals in the UK bounced back in February to a level not seen since September 2022. A similar picture can be observed in Germany after two years of excessive contractions. Although corporate loans were still declining in the first quarter of 2024, we are starting to see credit conditions easing for mortgages, a first since 2021.

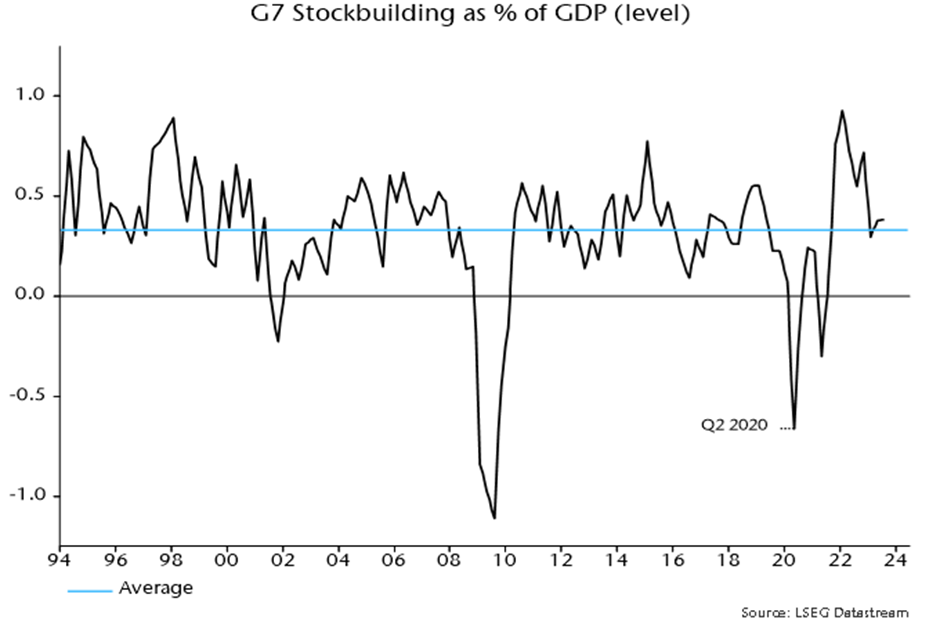
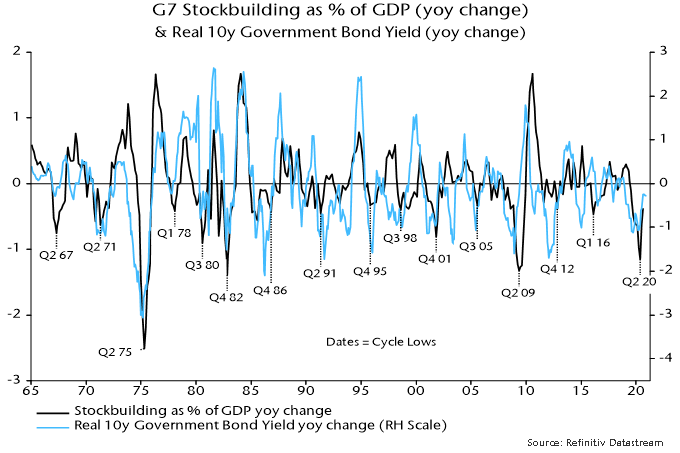
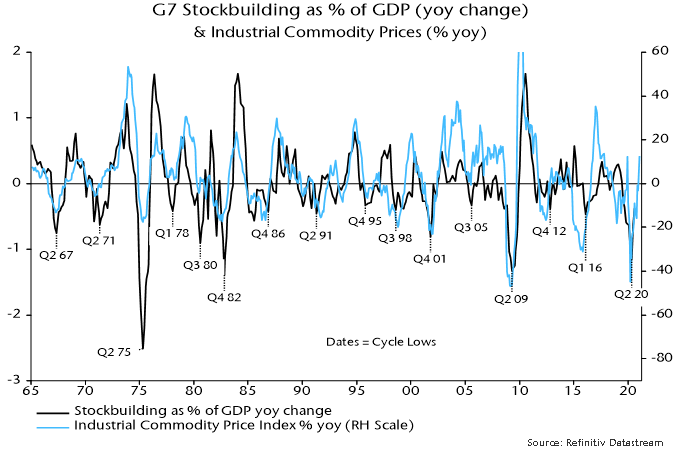
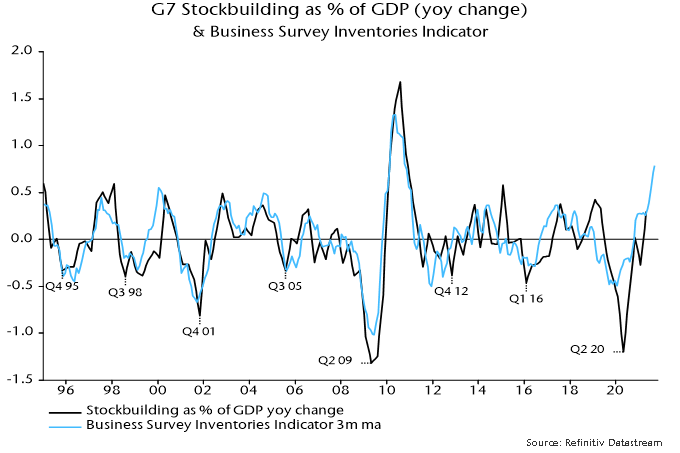
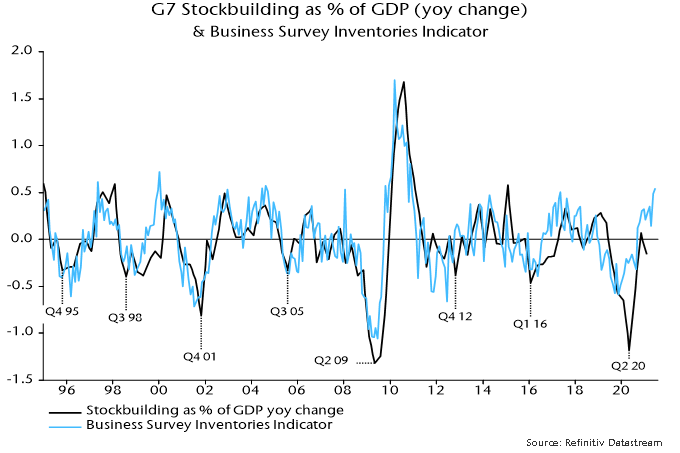
The destocking cycle is coming to an end: The destocking cycle that started in early 2023 has contributed to a very low level of stocks. Some industries might even carry too low a level of stocks in the event that pent-up demand returns in the second half. Any uplift in order intake would require a higher level of stocks, which would revitalize the manufacturing sector.

Valuation discount: The wide valuation gap that exists between Europe and Global could be narrowing as economic indicators and confidence improve. As shown by the 12-month forward earnings index below, small and mid-cap stocks are still trading at discount vis-a-vis Global. A potential rate cut, expected in June, combined with a reacceleration of demand, would likely drive small and mid-cap companies.
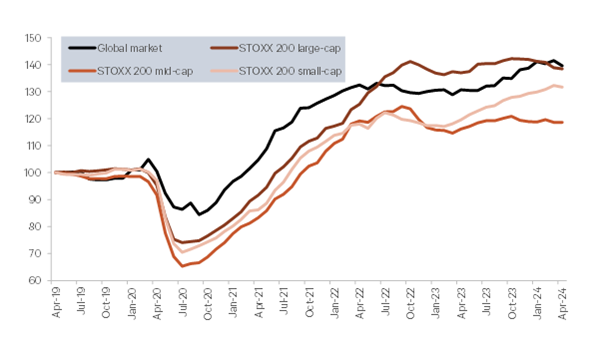
Chart 2: Line graph showing 12-month forward earnings index for Europe and Global small, mid- and large-cap indicies, 2019 to 2024.
Source: Berenberg.

In a world where the unexpected has become the norm, our holdings’ resilience through last year’s ups and downs offers a sense of stability and growth potential amid uncertainty – and an opportunity to think beyond the immediate to what could be on the horizon.

The money and cycles forecasting approach suggested that global inflation would fall rapidly during 2023 but at the expense of significant economic weakness. The inflation forecast played out but activity proved more resilient than expected. What are the implications for the coming year?

One school of thought is that economic resilience will limit further inflation progress, resulting in central banks disappointing end-2023 market expectations for rate cuts, with negative implications for growth prospects for late 2024 / 2025.

A second scenario, favoured here, is that the economic impact of monetary tightening has been delayed rather than avoided, and a further inflation fall during H1 2024 will be accompanied by significant activity and labour market weakness, with corresponding underperformance of cyclical assets.

The dominant market view, by contrast, is that further inflation progress will allow central banks to ease pre-emptively and sufficiently to avoid material near-term weakness and lay the foundation for economic acceleration into 2025.

On the analysis here, the second scenario might warrant a two-thirds probability weighting versus one-sixth for the first and third. This assessment reflects several considerations.

First, on inflation, developments continue to play out in line with the simplistic “monetarist” proposition of a two-year lead from money to prices. G7 annual broad money growth formed a double top between June 2020 and February 2021 – mid-point October 2020 – and declined rapidly thereafter. Annual CPI inflation peaked in October 2022, falling by 60% by November 2023 – chart 1.

Chart 1

Chart 1 showing G7 Comsumer Prices and Broad Money.

Broad money growth returned to its pre-pandemic average in mid-2022 and continued to decline into early 2023. The suggestion is that inflation rates will return to targets by H2 2024 with a subsequent undershoot and no sustained revival before mid-2025.

Secondly, economic resilience in 2023 partly reflected post-pandemic demand / supply catch-up effects. On the demand side, an analytical mistake here was to downplay the supportive potential of an overhang of “excess” money balances following the 2020-21 monetary explosion. Globally, this excess stock has probably now been eliminated – chart 2.

Chart 2

Chart 2 showing ratio of G7 and E7 Narrow Money to Nomial GDP.

The moderate economic impact of monetary tightening to date, moreover, is consistent with historical experience. Major lows in G7 annual real narrow money momentum led lows in industrial output momentum by an average 12 months historically – chart 3. With a trough in the former reached as recently as August 2023, economic fall-out may not be fully apparent until H2 2024.

Chart 3

Chart 3 showing G7 Industrial Output and Real Narrow Money

The suggestion that economic downside is incomplete is supported by a revised assessment of cyclical influences. The previous hypothesis here was that the global stockbuilding cycle would bottom out in late 2023 and recover during 2024. Recent stockbuilding data, however, appear to signal that the cycle has extended, with a recovery pushed back until H2 2024.

The assumption of a late 2023 trough was based on a previous low in Q2 2020 and the average historical cycle length of 3 1/3 years. This seemed on track at mid-2023: G7 stockbuilding had crossed below its long-run average in Q1, consistent with a trough-compatible level being reached in H2 – chart 4. The downswing, however, was interrupted in Q2 / Q3, with a further decline likely to be necessary to complete the cycle and form the basis for a recovery.

Chart 4

Chart 4 showing G7 stockbuilding as a percent of GDP

A resumed drag from stockbuilding may be accompanied by a further slowdown or outright weakness in business investment, reflecting recent stagnation in real profits – chart 5. Capex is closely correlated with hiring decisions, so this also argues for a faster loosening of labour market conditions.

Chart 5

Chart 5 showing G7 Business investment and real gross domestic operating profits.

Real narrow money momentum remains weaker in Europe than the US, suggesting continued economic underperformance and a more urgent need for policy relaxation – chart 6. Six-month rates of change are off the lows but need to rise significantly to warrant H2 recovery hopes. Globally, the US / European revivals have been partly offset by a further slowdown in China, suggesting still-weakening economic prospects.

Chart 6

Chart 6 showing Real Narrow Money for U.S., Japan, Eurozone, UK and China

The frenetic rally of the final two months resulted in global equities delivering a strong return during 2023 despite the two “excess” money indicators tracked here* remaining negative throughout the year. The indicators, however, started flashing red around end-2021, since when the MSCI World index has slightly underperformed US dollar cash.

Historically (i.e. since 1970), equities outperformed cash on average only when both indicators were positive, a condition unlikely to be met until mid-2024 at the earliest.

The late 2023 rally was led by cyclical sectors as investors embraced a “soft landing” scenario. Non-tech cyclical sectors ended the year more than one standard deviation expensive relative to history versus defensive ex. energy sectors on a price / book basis – chart 7. Current prices appear to discount an early / strong PMI recovery, which the earlier discussion suggests is unlikely.

Chart 7

Chart 7 showing MSCI World Cyclical excluding Tech versus Defensive excluding Energy Price over Book z-score and Global Manufacturing PMI New Orders.

Quality stocks outperformed during 2023, reversing a relative loss in 2022 and consistent with the historical tendency when “excess” money readings were negative. Earlier underperformance partly reflected an inverse correlation with Treasury yields, a relationship now suggesting further catch-up potential.

Contributing factors to the dramatic underperformance of Chinese stocks during 2023 include excessively optimistic post-reopening economic expectations at end-2022 and unexpectedly restrictive monetary / fiscal policies. MSCI China is at a record** valuation discount to the rest of EM – chart 8 – while monetary / economic weakness suggests an early policy pivot.

Chart 8

Chart 8 showing MSCI China Price over Book and Forward Price over Earnings relative to MSCI EM excluding China.

A key issue for 2024 is the extent to which central bank policy easing will revive money growth. While inflation is expected to trend lower into early 2025, the cycles framework suggests another upswing later this decade – the 54-year Kondratyev price / inflation cycle last peaked in 1974. Aggressive Fed easing 54 years ago – in 1970 – pushed annual broad money growth into double-digits the following year, creating the conditions for the final Kondratyev ascent. Signs that a similar scenario is playing out would warrant adding to inflation hedges.

*The differential between G7 plus E7 six-month real narrow money and industrial output momentum and the deviation of 12-month real narrow money momentum from a long-term moving average.

**Since June 2000. MSCI China included only B-shares through May 2000, when red chips and H-shares were added.


International equity markets were weak in Q1 2022, initially on poor inflation news and the Federal Reserve turning more hawkish, then in response to the Russian invasion of Ukraine.  Markets hit a closing low on 8th March and recovered into the quarter end.  The EAFE index fell 3.6% in local currency terms and 5.79% in US dollars.  Energy was the strongest sector, gaining 17.22% as oil and gas prices rose sharply.  IT, considered a long duration sector sensitive to interest rates in the short term, was the weakest, falling 16% as bond yields rose.

The invasion has united Western leaders in condemnation of President Putin’s regime and the world’s liberal democracies have responded with sanctions and military aid to Ukraine.  The need to spend more on defence and reduce reliance on Russian commodities has become clear and Germany has had to reverse its policy of economic and business engagement with the Kremlin.  The extraordinary bravery of the Ukrainian forces matched by a poorly performing Russian military have denied Putin a swift victory and a longer conflict has ensued.  NATO leaders have avoided an escalation involving member nations so far.  A negotiated peace settlement, however distasteful that process may be, will be the solution but Putin will come to the table seriously only when he believes he has enough gains to sell his actions to the Russian people as a victory.  Given his autocratic control of the media that may come sooner than expected.

Economic growth expectations have been revised down across Europe as consumer confidence has fallen and real wages are squeezed by higher inflation.  Monetary authorities have been behind the curve and are responding too late, probably making another policy mistake by tightening policy as the global economy slows sharply.  President Macron’s attempts at diplomacy with Putin initially served him well in the polls for the French presidency but his ratings have since been slipping and he will face the right wing Marine Le Pen in the run-off, a repeat of the 2017 election.  Eurozone real money growth has slowed significantly suggesting the economy could tip over into recession later this year or in 2023.  In the United Kingdom the squeeze on real incomes is particularly acute as consumers experience significant rises in energy bills as the price cap rolls off exposing users to the surge in European gas prices.  The invasion of Ukraine has reduced the pressure on Prime Minister Johnson from the ‘Partygate’ scandal but the cost of living crisis with higher taxes and higher prices may undermine his premiership further.

In Asia the Japanese yen was notably weaker as the Bank of Japan maintained its 25bp 10 year yield ceiling in its ongoing efforts to stimulate inflation.  A higher oil price is bad for a country that imports most of its energy but the weaker currency should help competiveness.  Another problem for Japan is the weakness of the Chinese economy which has had to instigate more lockdowns as Covid infections rise in many regions.  The outlook improved for the beleaguered Chinese tech stocks, which had been under regulatory pressure in 2021.  An announcement from China’s state council signalled a desire to keep its capital markets stable, an end to the regulatory clampdown on big tech soon and support for overseas stock listings.  There remains a risk of a negative response from trading partners if China provides support for Russia but policy-makers now seem to realise that continuing to punish the big internet stocks is no way to build a cutting edge technology sector.

Our liquidity indicators continue to give a negative signal for the global economy and risk assets.  The rise in inflation is probably peaking but tighter monetary policy implemented belatedly by central banks will continue to suppress real money growth.  The negative excess liquidity signal usually coincides with relative underperformance by tech and other cyclical sectors while energy and other defensive sectors outperform.  Normally high yield and quality outperform while momentum suffers.  Higher bond yields due to stronger commodity prices have prevented the usual outperformance by quality which often trades at a valuation premium.  The drag from the stockbuilding cycle should ease the upward pressure on commodity prices allowing bond yields to fall and quality stocks to reassert their usual pattern of outperformance in slow growth environments.          

Transactions over the quarter reduced the underweight in Europe, moved Japan underweight, reduced emerging markets and moved Asia ex Japan overweight.  At the sector level we have added to energy moving slightly overweight and are also now overweight communications.  IT has been reduced and we have exited some UK domestically orientated stocks where we fear the economy faces a hard landing.  The focus has been to add to defensive stocks reducing cyclical exposure.  Stock and sector selection were both negative over the quarter with our preferred quality and growth factors lagging value and high yield.  The average underweight in financials, energy and miners was negative as was the overweight in IT.  Stock picks were negative across regions and most sectors the exceptions being energy and IT.

The Composite fell 9.42% (9.56% Net) versus a 5.91% fall for the benchmark.

The ECB under former President Jean-Claude Trichet twice raised interest rates into oncoming recessions (in 2008 and 2011). The current ECB hasn’t raised rates yet but is scaling back QE much faster than was expected late last year.

The six-month rate of change of Eurozone real narrow money had turned negative before the 2008 / 2011 rate rises and subsequent recessions. It is about to do so again now.

In an eerie replay, M. Trichet yesterday gave an interview in which he opined that the Eurozone was “far from recession territory”.

The current ECB seems equally complacent. The staff forecast for GDP growth in 2022 was yesterday lowered from 4.2% to 3.7% but still incorporates quarterly increases of 1.0% in Q2 and Q3, i.e. a combined 2.0% or 4% annualised.

The “best” monetary leading indicator of Eurozone GDP, according to the ECB’s own research, is real non-financial M1, i.e. holdings of currency and overnight deposits by households and non-financial corporations deflated by consumer prices.

The six-month change in real non-financial M1 fell to zero in January and is likely to have been negative in February, based on a further increase in six-month consumer price momentum – see chart 1.

Chart 1

Chart showing Eurozone Narrow Money & Consumer Prices.

The six-month real narrow money change was negative in 18% of months between 1970 and 2019. The average change in GDP in the subsequent two quarters combined was zero. The average since the inception of the euro in 1999 was -0.8%.

Business surveys could be about to crater: the March Sentix survey of financial analysts is ominous – chart 2. The ECB and consensus may portray weakness as a temporary response to Russia’s invasion of Ukraine, drawing a parallel with past geopolitical events that had little lasting economic impact. Monetary trends suggest that a slowdown to stall speed was already in prospect and the Ukraine shock may tip the economy over into recession.

Chart 2

Chart showing Germany Ifo & Sentix / ZEW Surveys.

The ECB is in a policy bind of its own making. The view here is that it is too late to tighten and the only option is to ride out the current inflation storm. The worry for policy-makers is that inflation expectations will become “unanchored”. Fake hawkish rhetoric backed by fantasy GDP forecasts may be their attempted escape route.

The forecasting approach employed here – relying on monetary and cycle analysis – turned positive on the global economy and risk markets in early Q2 2020 but is giving a more cautionary message at the start of 2021. The suggestion is that underlying economic momentum will slow temporarily while monetary support for markets has diminished, together raising the risk of a correction. The central view remains that global growth will be strong over the course of 2021 as a whole but with the adverse corollary of a significant pick-up in inflation into 2022.

The monetary aspect of the forecasting approach can be summarised as “real money leads the economy while excess money drives markets”. Six-month growth of real (i.e. inflation-adjusted) narrow money in the G7 economies and seven large emerging economies (the “E7”) was weak at the start of 2020 but surged from March, correctly signalling a strong rebound in global economic activity during H2.

Real money growth, however, peaked in July, falling steadily through November, the latest data point – see chart 1. Turning points in real money growth have led turning points in the global manufacturing PMI new orders index – a key coincident indicator – by 6-7 months on average historically, suggesting that the PMI will move lower in early 2021. The level of money growth remains high, arguing against economic weakness (except due to “lockdowns”), but a directional shift in activity momentum could act as a near-term drag on cyclical assets.

Chart 1

“Excess” money refers to an environment in which actual real money growth exceeds the level required to support economic expansion, with the surplus likely to be invested in markets. Two gauges of excess money are monitored here: the gap between six-month growth rates of G7 plus E7 real narrow money and industrial output, and the deviation of year-on-year real money growth from a long-run moving average. Historically, global equities performed best on average when both measures were positive, worst when they were negative, and were lacklustre when they gave conflicting signals.

Following a joint positive signal (allowing for data release lags) at end-April 2020, the measures became conflicting again at end-December – year-on-year real money growth remains well above its long-run average but six-month growth fell below that of industrial output in October / November. Markets, therefore, may no longer enjoy a monetary “cushion” against unfavourable news, including the expected PMI roll-over.

The expectation here is that markets will become more volatile but risk assets are unlikely to be outright weak – any sizeable set-back would probably represent another buying opportunity. As noted, real money growth remains at an expansionary level and may stabilise soon, while the cycle analysis is giving a positive economic message for the next 12+ months, as explained below.

The cross-over of six-month real narrow money growth below industrial output growth, moreover, could prove short-lived, with output momentum about to fall back sharply as positive base effects fade. Assuming a stabilisation of monthly money growth, a positive differential could be restored as early as January – see chart 2 – in which case the assessment of the monetary backdrop for markets would shift back to favourable from Q2.

Chart 2

The cycle analysis provides a medium-term perspective and acts as a cross-check of the monetary analysis. There are three key economic activity cycles: the stockbuilding or inventory cycle, which averages 3.5 years (i.e. from low to low); a 9-year business investment cycle; and a longer-term housing cycle averaging 18 years. These cycles are essentially global in nature although housing cycles in individual countries can sometimes become desynchronised.

The cycle analysis was cautionary at the start of 2020, reflecting a judgement that the stockbuilding and business investment cycles were in downswings that might not complete until mid-year. The covid shock magnified but ended these downswings, with both cycles bottoming in Q2 and entering a recovery phase in H2. With the housing cycle still in an upswing from a 2009 low, all three cycles are now acting to lift global economic momentum.

The next scheduled cycle trough is a low in the stockbuilding cycle, due to be reached in late 2023 if the current cycle conforms to the average 3.5 year length. The downswing into this low would probably start about 18 months earlier, i.e. around Q2 2022. The cycle analysis, therefore, is giving an “all-clear” signal for the global economy for the next 15-18 months, implying that any data weakness – such as suggested by monetary trends for early 2021 – is likely to be minor and temporary.

Financial market behaviour is strongly correlated with the stockbuilding cycle in particular. Cycle upswings are usually associated with rising real government bond yields and strong commodity markets – see charts 3 and 4 – as well as low / falling credit spreads and outperformance of cyclical equity sectors. The latter three of these trends, of course, were in place during H2 2020 and may extend during 2021 after a possible Q1 correction. A surprise to the consensus in 2021 could be a rebound in real bond yields, which would challenge current equity market valuations and could favour “value”.

Chart 3

Chart 4

To sum up, monetary data in early 2021 will be important for the strategy assessment here. The current monetary backdrop and possible weaker near-term economic data suggest reducing cyclical exposure relative to H2 2020 but a stabilisation or revival in real money growth would support the positive message from the cycle analysis, arguing for using any setback in cyclical markets to rebuild positions in anticipation of a strong H2.

Consumer price inflation rates are widely expected to rise during H1 2021, reflecting recent commodity price strength, a reversal of temporary tax cuts (Germany / UK) or subsidies (Japan), and base effects. The policy-maker and market consensus is that this will represent a temporary “cyclical” move of the sort experienced regularly in recent decades. The suspicion here is that it will prove more lasting and significant, because the monetary backdrop is much more expansionary / inflationary than before those prior run-ups.

Broad rather than narrow money trends are key for assessing medium-term inflation prospects. This is illustrated by Japan’s post-bubble experience: narrow money has grown strongly on occasions but annual broad money expansion never rose above 5% over 1992-2019, averaging just 2.1% – the monetary basis for sustained low inflation / mild deflation. Similarly, G7 annual broad money growth averaged only 3.7% in the post-GFC decade (i.e. 2010-19).

2020 may have marked a transformational break in monetary trends. G7 annual broad money growth peaked at 17.0% in June, the fastest since 1973 – see chart 5. Monthly growth has subsided but there has been no “payback” of the H1 surge. At the very least, this suggests a larger-than-normal “cyclical” upswing in inflation in 2021-22. Ongoing monetary financing of large fiscal deficits may sustain broad money growth at well above its levels of recent decades, embedding the inflation shift.

Chart 5

The consensus view that an inflation pick-up will prove temporary rests on weak labour markets bearing down on wage growth. Unemployment rates adjusted for short-time working / furlough schemes, however, fell sharply as the global economy rebounded in H2 2020 and structural rates have probably risen – labour market “slack”, therefore, may be less than widely thought and much lower than after the 2008-09 recession. The slowdown in wages to date has been modest and some business surveys are already hinting at a rebound – see chart 6.

Chart 6

Commentators who take seriously the prospect of a sustained inflation rise often argue that real bond yields would take the strain by moving deeper into negative territory, the view being that central banks will cap nominal yields. Such a scenario would be bullish for risk assets but probably overstates the power of the policy emperors. Pegged official rates and a QE flow currently running at about 10% of the (rapidly rising) outstanding stock of G7 government bonds per annum could prove insufficient to offset selling by existing holders in the event of an unexpected inflation surge.

Global industrial output has flatlined since early 2021, reflecting supply disruptions but also a loss of demand momentum. Output may recover into 2022 as supply problems ease but money trends signal a further weakening of underlying momentum. Second-round inflation effects, meanwhile, may force central banks to bring forward plans for stimulus withdrawal – unless markets weaken sharply. This backdrop suggests retaining a cautious investment strategy unless money trends rebound in late 2021 – possible but not a central scenario.

The ”monetarist” forecasting approach used here relies on the rules of thumb that 1) real narrow money growth directionally leads demand / output growth by 6-12 months (average 9 months) and 2) nominal broad money growth directionally leads inflation by 1-3 years (average 2+ years). Global narrow / broad money growth surged in 2020 but has slowed this year. This slowdown is being reflected in a loss of economic momentum but the inflationary impact of the 2020 bulge will continue well into 2022. Current “stagflation” concerns, therefore, are likely to persist.

Supply chain disruption is distorting economic data, complicating analysis. The presumption here is that the global manufacturing PMI new orders index is a reasonable guide to underlying industrial demand momentum. The index has fallen since May, mirroring an earlier decline in global (i.e. G7 plus E7) six-month real narrow money growth from a July 2020 peak – see chart 1. With real money growth sliding further into July / August 2021, the suggestion is that the PMI new orders index is unlikely to reach a bottom before early 2022.

Chart 1

Supply chain disruption, however, has resulted in a substantial undershoot of industrial output relative to the growth rate suggested by the PMI new orders index, implying scope for a short-term catch-up – chart 2. Market participants could wrongly interpret such a pick-up as a reversal in trend momentum. Confusing signals could lead to greater market volatility but any revival in the cyclical / reflation trade is likely to be short-lived unless monetary trends – and hence PMI prospects – improve.

Chart 2

The approach here uses cycle analysis to cross-check monetary signals and provide longer-term context. The 3-5 year stockbuilding and 7-11 year business investment cycles are judged to have bottomed in Q2 2020 and are currently providing a tailwind to the global economy, cushioning the impact of less expansionary monetary conditions.

The next cyclical “event” will be a peak and downswing in the stockbuilding cycle. Based on its average historical length of 3 1/3 years, the next cycle low could occur in H2 2023, implying a peak by H2 2022 at the latest. The business survey inventories indicator calculated here, however, suggests that the cycle upswing is already well-advanced, hinting at an early peak – chart 3.

Chart 3

The upshot is that monetary trends suggest a slowdown in global economic momentum through early 2022 while the stockbuilding cycle is likely to act as a drag from H2 2022. This leaves open the possibility of a resumption of strong economic growth in a 2-3 quarter window around mid-2022. An immediate rebound in global real narrow money growth, however, is needed to validate this scenario.

Such a rebound is possible despite the Fed and other central banks moving to wind down stimulus. It could be driven, for example, by Chinese policy easing to support a weak economy, a sharp reversal in commodity prices as industrial momentum softens (boosting real money growth via a near-term inflation slowdown) or a pick-up in bank lending (normal at this stage of stockbuilding / business investment cycle upswings). It is, however, unnecessary to speculate – it is usually sufficient for forecasting purposes to respond to monetary signals rather than try to anticipate them.

Chart 4 shows a breakdown of G7 plus E7 six-month real narrow money growth. Earlier US relative strength / Chinese weakness has been reflected in divergent year-to-date equity market performance, with DM ex. US and EM ex. China indices charting a middle course. A recent cross-over of US real money growth below the G7 ex. US average suggests reducing US exposure in favour of other developed markets.

Chart 4

Chinese real money growth, meanwhile, was showing signs of bottoming before the recent escalation of financial difficulties at property developer Evergrande. This could result in faster policy easing, an “endogenous” tightening of credit conditions, or both. The net monetary impact is uncertain but a recovery in money growth in late 2021 would argue for adding Chinese exposure in global and EM portfolios despite likely further weakness in economic data.

Investors continue to debate whether high inflation is “transitory” as central bankers naturally assert. The monetarist view is straightforward: the roughly 2-year transmission of money to prices implies no significant inflation relief before H2 2022, while a return to pre-covid levels requires a further slowdown in global broad money growth.

Inflation drivers are likely to shift, with energy and other industrial commodity prices cooling as the global economy slows but offsetting upward impulses from food, rents and accelerating unit wage costs as labour shortages and mismatches force pay rises above productivity growth.

Rising labour costs could, in theory, be absorbed by a reduction in profit margins rather than being passed on in prices. Recent profits numbers, however, overstate underlying health because of stock appreciation and pandemic-related government support. The share in US national income of an “economic” measure of corporate profits (i.e. adjusted for inventory valuation effects and Paycheck Protection Program subsidies, and to reflect “true” depreciation) is in line with its average over 2010-19, in contrast to inflated book profits – chart 5.

Chart 5

G7 annual broad money growth has fallen from a peak of 17.3% in February 2021 to 8.3% in August, with 3-month annualised growth at 6.2%. This is still high by pre-covid standards: annual growth averaged 4.5% over 2015-19. Reduced support to money growth from QE could be offset by faster expansion of bank balance sheets, reflecting strong capital / liquidity positions and rising credit demand. US commercial bank loans and leases have recently resumed growth, with the Fed’s senior loan officer survey suggesting a further pick-up – chart 6. The ECB’s lending survey is similarly upbeat.

Chart 6

Adding in the E7, annual broad money growth is closer to the pre-covid level, at 8.2% in August versus a 2015-19 average of 6.4% – chart 7. Growth is below average in China, Mexico and Russia and in line in India. Inflationary pressures are more likely to prove “transitory” in these economies, suggesting support for local bond markets.

Chart 7

Global equities held up over the summer despite weaker activity news and upside inflation surprises. A monetarist explanation is that markets were supported by “excess” money, as supply disruptions contributed to global six-month industrial output growth falling below real narrow money growth – chart 8. A temporary output catch-up as supply problems ease could reverse this crossover – a further argument for maintaining a cautious investment stance emphasising defensive sectors and quality.

Chart 8

An FTarticle lists “Five big questions facing the Bank of England over rising inflation”. The most important one is missing: will broad money growth return to its pre-covid pace?

The current inflation increase, from a “monetarist” perspective, is directly linked to a surge in the broad money stock starting in spring 2020. Annual growth of non-financial M4 – the preferred aggregate here, comprising money holdings of households and private non-financial corporations (PNFCs) – rose from 3.9% in February 2020 to a peak of 16.1% a year later.

The monetarist rule of thumb is that money growth leads inflation with a long and variable lag averaging about two years. This is supported by research on UK post-war data previously reported here – turning points in broad money growth preceded turning points in core inflation by 27 months on average.

The lead time is variable partly because of the influence of exchange rate variations. For example, the disinflationary impact of UK monetary weakness after the GFC was delayed by upward pressure on import prices due to sterling depreciation.

The exchange rate has been relatively stable recently but the rise in inflation has been magnified by pandemic effects, which may mean that a peak occurs earlier than suggested by the February 2021 high in money growth and the average 27 month lag. The working assumption here is that core inflation will peak during H1 2022.

CPI inflation, however, is likely to overshoot the current Bank of England forecast throughout 2022 – chart 1 shows illustrative projections for headline and core rates.

Chart 1

The past mistakes of monetary policy are baked in. The MPC should focus on current monetary trends in assessing how to respond to its current / prospective inflation headache.

Annual broad money growth has fallen steadily from the February peak but, at 9.0% in July, remains well above the 4.2% average over 2010-19, a period during which CPI inflation averaged 2.2%. So monetary data have yet to support the MPC’s assertion that the inflation overshoot is “transitory”.

The pace of increase, however, slowed to 4.4% at an annualised rate in the three months to July – chart 2. Household M4 rose by 5.8% with PNFC holdings little changed. In terms of the credit counterparts, bank lending to households and PNFCs grew modestly (4.1%) while a continued QE boost was offset by negative external flows, suggesting balance of payments weakness.

Chart 2

With QE scheduled to finish at end-2021 (if not before), and a temporary boost to mortgage lending from the stamp duty holiday over, money growth couldbe gravitating back to its pre-covid pace.

An early interest rate rise, on the view here, is advisable to reinforce the recent monetary slowdown and push back against rising inflation expectations. It is premature, however, to argue that a sustained and significant increase in rates will be needed to return inflation to target beyond 2022 – further monetary evidence is required.

It would be unfortunate if, having fuelled the current inflation rise by questionable policy easing, the MPC were now to raise expectations of multiple rate hikes at a time when monetary growth could be returning to a target-consistent level.

Detailed monetary data for July released yesterday suggest that recent policy easing is beginning to support money growth, in turn hinting at a recovery in economic momentum from end-2021.

A sustained slowdown in six-month narrow money growth from July 2020 correctly signalled “surprise” Chinese economic weakness so far in 2021. The expectation here was that the PBoC would ease policy in Q2, supporting economic prospects for later in 2021. Adjustment was delayed but the reserve requirement ratio cut on 9 July appeared to mark a significant shift. The hope was that July monetary data would confirm a bottom in money growth.

The headline July numbers released on 11 August seemed to dash this hope, with six-month of “true M1” falling to a new low – see chart 1*.

Chart 1

The additional data released yesterday allow a breakdown of the deposit component of this measure between households, non-financial enterprises and government departments / organisations. It turns out that the further fall in growth in July was due to the latter public sector element, which is volatile and arguably less important for assessing prospects for demand and output.

Six-month growth of “private non-financial M1”, i.e. currency in circulation plus demand deposits of households and non-financial enterprises, rose for a second month in July. So did the corresponding broader M2 measure – chart 1.

This improvement needs to be confirmed by a recovery in overall narrow money growth in August, ideally accompanied by a further increase in the private sector measure. One concern is that the rebound in the latter has so far been driven by the household component – enterprise money growth remains weak.

Increased bond issuance and fiscal easing could lift public sector money growth during H2.

The corporate financing index in the Cheung Kong Graduate School of Business monthly survey is a useful corroborating indicator of money / credit trends – a rise signals easier conditions. The index bottomed in March but has yet to improve much – chart 2. August survey results will be released shortly.

Chart 2

*True M1 includes household demand deposits, which are omitted from the official M1 measure.

The fall in UK CPI inflation in July reported this week will be of limited comfort to policy-makers – a decline had been expected because of a large base effect and will be more than reversed in August. A bigger story was the further widening of the RPI / CPI inflation gap to an 11-year high. RPI inflation could top 5.5% in Q4 2021, boosting interest payments on index-linked gilts by a whopping £15 billion relative to the OBR’s Budget forecast.

CPI inflation fell from 2.5% in June to 2.0% in July but RPI Inflation eased by only 0.1 pp to 3.8%. RPIX inflation – excluding mortgage interest – was stable at 3.9%.

The RPI / CPI inflation gap, therefore, widened to 1.8 pp, its largest since June 2010. The RPIX / CPI inflation gap of 1.9 pp is the biggest on record since the inception of CPI inflation data in 1989 – see chart 1.

Chart 1

The widening gaps mainly reflect surging house prices, driven partly by Chancellor Sunak’s stamp duty holiday. House prices enter the RPI via the housing depreciation component*, which is linked to ONS house price data with a short lag – chart 2. This component has a 9.0% weight and rose by 9.9% in the year to July, contributing 0.9 pp to RPI inflation of 3.8%. The CPI omits owner-occupier housing costs.

Chart 2

Note that the housing depreciation weight has risen from 5.8% in 2014, i.e. the sensitivity of the RPI to house prices has increased by more than 50% since then.

The RPI / CPI and RPIX / CPI inflation gaps, however, have widened by more than implied by house prices alone – chart 3.

Chart 3

A likely additional influence has been the ONS decision to depart from its normal procedure and base 2021 CPI weights on 2020 rather than 2019 expenditure data. As previously explained, this has lowered the weight of categories hit hardest by the pandemic but now experiencing a rebound in demand and prices. An alternative calculation carrying over 2020 weights (based on 2018 expenditure data) to 2021 produces an annual inflation number for July of 2.5% rather than 2.0% – chart 4.

Chart 4

The RPI has been less affected because the normal procedure was followed of basing weights on expenditure shares in the 12 months to June of the previous year. 2021 weights, therefore, reflect spending in the year to June 2020 – the impact of the pandemic was smaller over this period than in calendar 2020.

So weighting effects are likely to have had a larger negative impact on CPI than RPI inflation.

The phase-out of the stamp duty holiday is being reflected in a slowdown in housing market activity but estate agents expect a shortage of supply to support prices, according to the RICS survey. Recent strength may not yet have fed through fully to the RPI housing depreciation component – the annual rise in the latter of 9.9% in July compares with a 13.2% increase in the ONS house price index in the year to June.

Assume, as a reasonable base case, that that the annual increase in the housing depreciation component moderates to 8.0% in Q4 2021 while other influences on the RPI / CPI inflation gap are stable. This would imply a decline in the gap from the current 1.8 pp to 1.6 pp. The Bank of England’s August forecast of CPI inflation of 4.0% in Q4 would then read across to RPI inflation of 5.6%.

The OBR’s March Economic and fiscal outlook projected a 2.4% rise in the RPI in the year to Q4 2021. According to its debt interest ready reckoner, a 1% rise in the RPI boosts interest costs on index-linked gilts by £4.8 billion in the following year. The suggested Q4 overshoot of 3.2 pp, therefore, implies a spending increase of £15.2 bn – or 0.6% of annual GDP – relative to Budget plans.

*House prices also feed into the mortgage interest component, as well as estate agents’ fees and ground rent.

Monetary trends continue to suggest a slowdown in global industrial momentum in H2 2021, with a rising probability that weakness will be sustained into H1 2022 – contrary to the prior central view here that near-term cooling would represent a pause in a medium-term economic upswing. Pro-cyclical trends in markets have corrected modestly but reflationary optimism remains elevated, indicating potential for a more significant setback if economic data disappoint. Chinese monetary policy easing is judged key to stabilising global prospects and reenergising the cyclical trade.

Global six-month real narrow money growth – the “best” monetary leading indicator of the economy – peaked in July 2020 and extended its fall in May, dashing a previous hope here of a Q2 stabilisation / recovery. This measure typically leads turning points in the global manufacturing PMI new orders index by 6-7 months but a PMI peak was delayed on this occasion by a combination of US fiscal stimulus and economic reopening. A June fall in new orders, however, is expected to mark the start of a sustained decline, confirming May as a significant top – see chart 1.

Chart 1

The magnitude of the fall in global real narrow money growth and its current level suggest a move in the manufacturing new orders index at least back to its long-run average of 52.5 during H2 (May peak = 57.3, June = 55.8).

China continues to lead global monetary / economic trends, as it has since the GFC. A strong recovery in activity through 2020 prompted the PBoC to withdraw stimulus in H2, resulting in a money / credit slowdown that has fed through to weaker H1 2021 economic data. The central bank, however, has been reluctant to change course, partly to avoid fuelling house and commodity price speculation, and six-month real narrow money growth has now fallen to a worryingly low level, suggesting rising risk of a “hard landing” in H1 2022 – chart 2.

Chart 2

Real narrow money growth remains above post-GFC averages in other major economies but has also fallen significantly, reflecting both slower nominal expansion and a sharp rise in consumer price inflation. Six-month inflation is likely to fall back during H2 but nominal trends could weaken further in response to higher long-term rates and as money-financed fiscal stimulus moderates.

The suggestion from monetary trends of a deeper and more sustained economic slowdown could be argued to be inconsistent with cycle analysis. In particular, the global stockbuilding or inventory cycle bottomed in Q2 2020 (April) and, based on its 40-month average length, might be expected to remain in an upswing through early 2022, at least. This understanding informed the previous view here that a cooling of industrial momentum in mid-2020 would prove temporary.

A reassessment, however, may be warranted to take account of the distorting impact of the covid shock, which stretched the previous cycle to 50 months. A compensating shortening of the current cycle to 30 months would imply a cycle mid-point – and possible peak – in July 2021.

This alternative assessment is supported by a rise in the business survey inventories indicator monitored here to a level consistent with prior cycle peaks – chart 3.

Chart 3

The previous quarterly commentary suggested that cyclical equity market sectors and value were less attractive in the context of an approaching PMI peak, while quality stocks had potential to rally. MSCI World non-tech cyclical sectors lagged defensive sectors during Q2, with quality and growth outperforming value – chart 4. These trends could extend if the slowdown scenario described above plays out. Chinese policy easing would support the cyclical / value trade but the impact could prove temporary unless the Chinese shift resulted in an early rebound in global real narrow money growth.

Chart 4

Counter-arguments to the relatively pessimistic economic view outlined above include the following:

1. Fiscal policy remains highly expansionary and will offset monetary weakness.

Response: Economic growth is related to the change in the fiscal position and deficits, while large, are falling in most countries. Even in the US, President Biden’s stimulus package served mainly to neutralise a potential drag as earlier measures expired. The US fiscal boost peaked with the disbursement of stimulus cheques in March / April.

2. Household saving rates and money balances are high, implying pent-up consumer demand.

Response: Savings rates have been temporarily inflated by government transfers and will normalise as these fall back and consumption recovers to its pre-covid level. High money balances probably reflect “permanent” savings. US households planned to spend only 25% of the most recent round of stimulus checks, according to the New York Fed, using the rest to increase savings and reduce debt. The implied spending boost has already been reflected in retail sales, which may fall back in Q3.

3. Services strength as economies reopen will offset any industrial slowdown.

Response: The services catch-up effect is temporary and momentum is likely to reconnect with manufacturing in H2. Industrial trends dominate economic fluctuations and equity market earnings.

4. Profits are rising strongly, with positive implications for business investment and hiring.

Response: Profits are still receiving substantial support from government subsidies, withdrawal of which will offset much of the additional boost from economic normalisation. An increase in net subsidies relative to their Q4 2019 level accounted for 10% of US post-tax corporate economic profits in Q1, according to national accounts data – see chart 4.

Chart 5

5. Inventories to shipments ratios remain low, implying that the stockbuilding cycle is far from peaking.

Response: Economic growth is related to the change in stockbuilding, not its level. Stockbuilding is highest when inventories are low – the subsequent fall is a drag on growth even though stockbuilding usually remains high until inventories normalise. Low inventories to shipments ratios, therefore, are consistent with a cycle peak.

6. Industry has been held back by supply constraints – output and new orders will surge as these ease.

Response: Supply difficulties have probably resulted in firms placing multiple orders for inputs, inflating PMI readings – this effect will unwind as bottlenecks ease. Historically, manufacturing PMI new orders have fallen, not risen, following a peak in supply constraints.

7. Rising inflation will boost bond yields, supporting cyclical / value outperformance.

Response: Last year’s global money surge was expected here to be reflected in high inflation in 2021-22 but six-month broad money growth has moved back towards its pre-covid average, suggesting that medium-term inflation risks are receding. Bond yields usually track industrial momentum more closely than inflation data so would probably remain capped in a slowdown scenario even if inflation news continues to surprise negatively.