The FOMC’s updated economic forecast for the remainder of 2023 is inconsistent with Committee members’ median expectation of a further 50 bp rise in official rates during H2, according to a model based on the Fed’s past behaviour. Policy is more likely to be eased than tightened if the forecast plays out.
The model estimates the probability of the Fed tightening or easing each month from current and lagged values of core PCE inflation, the unemployment rate and the ISM supplier deliveries index, a measure of production bottlenecks. It provides a simple but satisfactory explanation of the Fed’s historical decision-making, i.e. the probability estimate was above 50% in most tightening months and below 50% in most easing months – see chart.
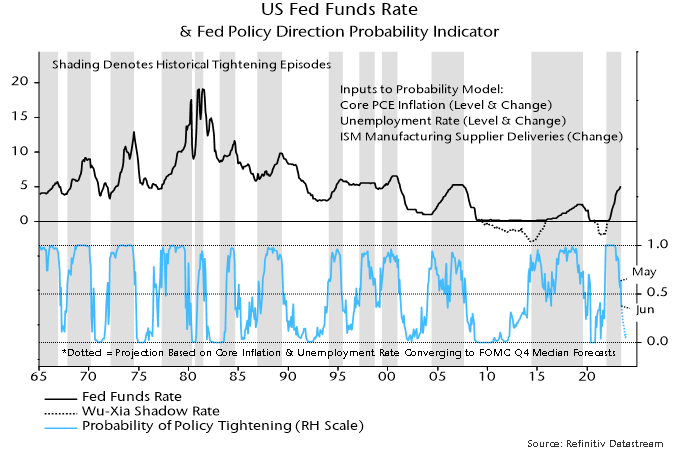
The probability of the Fed tightening at yesterday’s meeting had been estimated by the model at 36%, the first sub-50% reading since September 2021. (The FOMC started to taper QE at the following meeting in November.)
The FOMC’s median forecast for core PCE inflation in Q4 was revised up to 3.9% from 3.6% previously (currently 4.7%). The unemployment rate forecast was lowered to 4.1% from 4.5% (currently 3.7%).
The model projections shown in the chart assume that core PCE inflation and the unemployment rate converge smoothly to the Q4 forecasts, while the ISM supplier deliveries index remains at its current level. Despite the revisions, the probability estimate still falls to below 10% in Q4, consistent with the Fed beginning to ease by then.
The projections highlight the Fed’s historical sensitivity to the rates of change of core inflation and unemployment as well as their levels. It would be unusual for policy-makers to continue to tighten when inflation and unemployment are trending in the “right” directions, especially given the magnitude of the increase in rates to date.
One difference from the past is that Fed now forecasts its own actions. Has yesterday’s guidance that rates have yet to peak boxed policy-makers into at least one further rise? This may mean that the model’s probability estimate for July – currently 29% – is too low. Still, next month’s decision will hinge on data, with inertia plausible barring stronger-than-expected news.