President Trump introduced tariffs as part of his “America First” agenda to protect US industries and reduce trade deficits. These tariffs have led to volatility in global stock and currency markets, raising concerns about inflationary pressures and prolonged high interest rates. Additionally, there are questions about the US dollar’s role as the world’s reserve currency, which could affect its long-term stability. A weaker US dollar impacts Canadian investors’ foreign investments, depending on their currency hedging strategies.
This article reviews the longer-term relationship between the US dollar and Canadian dollar and places the recent currency volatility into perspective.
Historical perspective
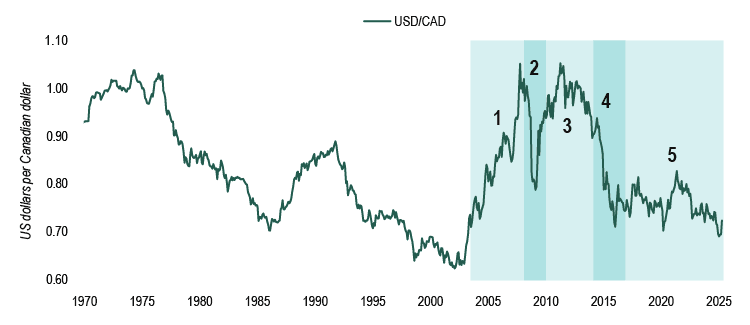
Figure 1 illustrates the historical exchange rates between the Canadian dollar and the US dollar from 1970 to the end of April 2025.
Figure 1 – Canadian-US exchange rates
 Source: Bank of Canada
- Rise of the Canadian dollar
The Canadian dollar experienced a long period of decline until the early 2000s when it began to rise, reaching parity with the US dollar in September 2007 for the first time in over 30 years. Several factors contributed to this surge:- Commodity boom: Canada is rich in natural resources, and the record-high prices for oil and other commodities played a significant role in strengthening the Canadian dollar.
- Strong economy: A robust global economy boosted demand for Canadian exports, further driving up the currency.
- US economic weakness: The United States was facing economic uncertainty, particularly with the subprime mortgage crisis, which weakened the US dollar relative to other currencies.
- Interest rate differentials: The Bank of Canada maintained higher interest rates compared to the US Federal Reserve, making Canadian assets more attractive to investors.
- Sharp downturn
In 2008, the Canadian dollar experienced a sharp downturn due to the global financial crisis. Investors moved their money into safe-haven assets like the US dollar, and oil prices plummeted from over USD140 per barrel to below USD40, which negatively impacted the value of the Canadian dollar.The financial crisis triggered a recession in Canada, leading to the Bank of Canada cutting interest rates to stimulate the economy, making Canadian assets less attractive to investors. By early 2009, the Canadian dollar had dropped to below 80 cents USD, a steep decline from its 2007 peak.
- Commodity-driven recovery
In 2009, the Canadian dollar rebounded, largely due to the recovery in commodity prices and Canada’s more stable banking system compared to other countries. The Canadian dollar regained much of its lost value and reached parity with the US dollar again in early 2011.
- Short-lived recovery
After 2011, the strength of the Canadian dollar was once again affected by commodity prices, with oil prices dropping from over USD100 per barrel to below USD30 by 2016. Concerns over European debt crises and slowing global growth also led investors to favour the US dollar. By 2016, the Canadian dollar had dropped to around 71 cents USD.
- Narrow trading range
Since 2016, the Canadian dollar has traded within a relatively narrow range, despite the uncertainty associated with the COVID-19 pandemic, recent high levels of inflation and the volatility caused by tariffs.
Recent perspective
Figure 2 highlights the more recent history of Canadian-US exchange rates from 2020 to the end of April 2025. The introduction of tariffs initially caused the Canadian dollar to hit a low of around 69 cents USD, but it subsequently rebounded and finished April at a little over 72 cents.
Figure 2 – Canadian-US exchange rates
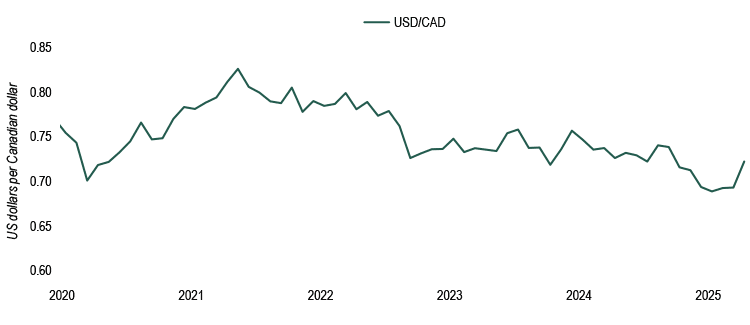
Source: Bank of Canada
To date, the volatility is much less compared to past periods when the Canadian dollar reached parity with the US dollar. For the Canadian dollar to reach parity again, several things would need to happen:
- Stronger Canadian economic growth compared to the United States.
- Higher interest rates in Canada to attract investment.
- Weaker US dollar due to inflation or economic downturns.
- Increased demand for Canadian exports, especially oil and natural resources.
The current economic environment does not suggest a rapid rise in the Canadian dollar relative to the US dollar. For example, oil prices are significantly below previous peak levels, and the bigger concern today for Canada is a prolonged recession.
Conclusion
The Canadian dollar has experienced cycles of decline and recovery, influenced by commodity prices, economic conditions and interest rate differentials. Recent volatility has been impacted by President Trump’s tariffs but is much less significant compared to previous events. The current economic environment does not suggest a rapid rise in the Canadian dollar. Investors should continue to monitor the situation.