Gas price relief and Chinese reopening have tempered pessimism about Eurozone economic prospects, contributing to a Q4 rally in equities. Monetary trends, by contrast, suggest a worsening outlook due to the ECB’s scorched earth policy tightening.
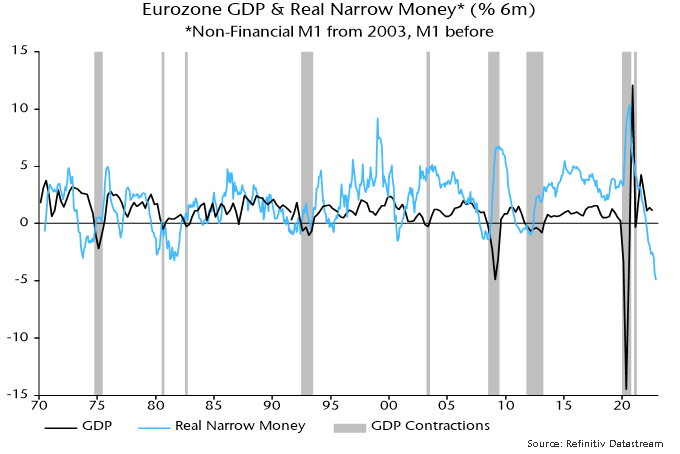
The preferred narrow money measure here – non-financial M1 – contracted for a third straight month in November. The three-month annualised rate of decline of 5.3% compares with a maximum fall of 1.7% during the GFC – see chart 1.
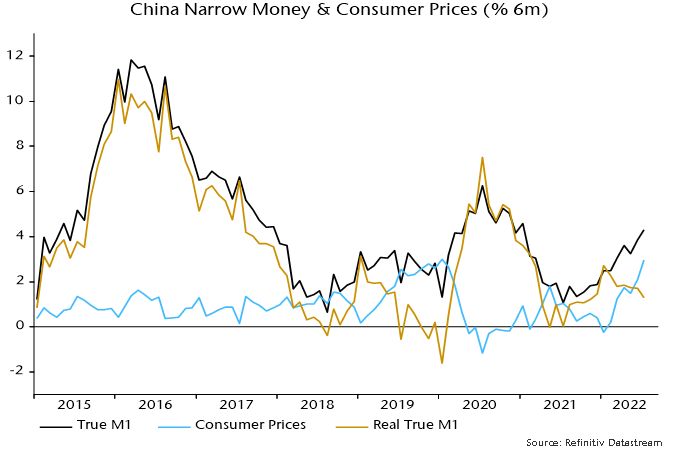
Chart 1
Narrow money weakness is being driven by households and firms switching out of overnight deposits into time deposits and notice accounts – a normal pre-recessionary development. Broad money, in addition, is slowing – non-financial M3 rose by only 0.2% in November, pulling three-month annualised growth down to 3.4%, the slowest since 2018.
The headline M1 and M3 measures are displaying greater weakness, reflecting a fall in money holdings of non-bank financial corporations.
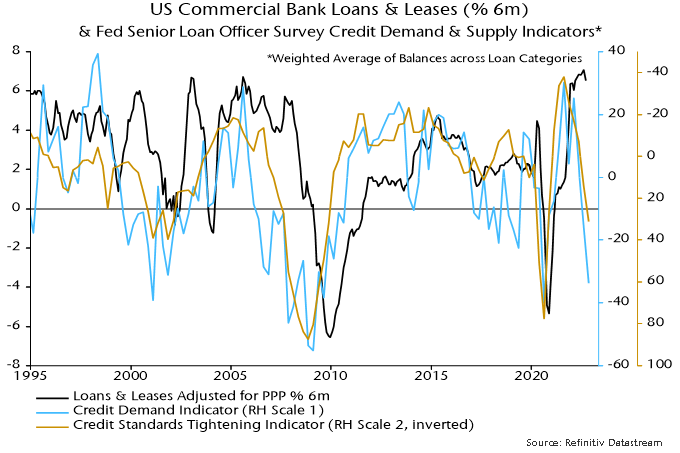
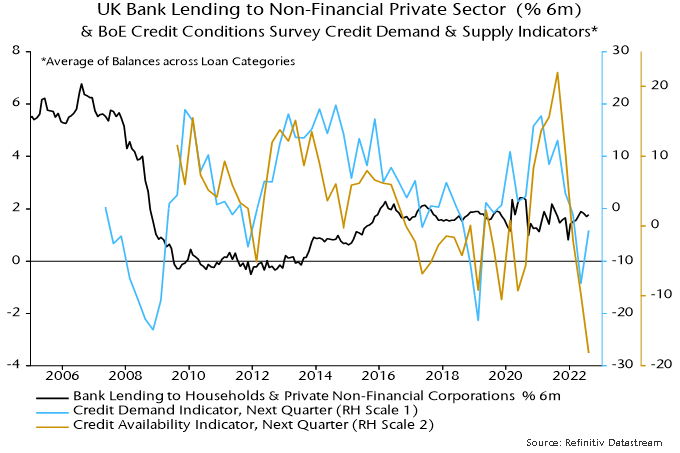
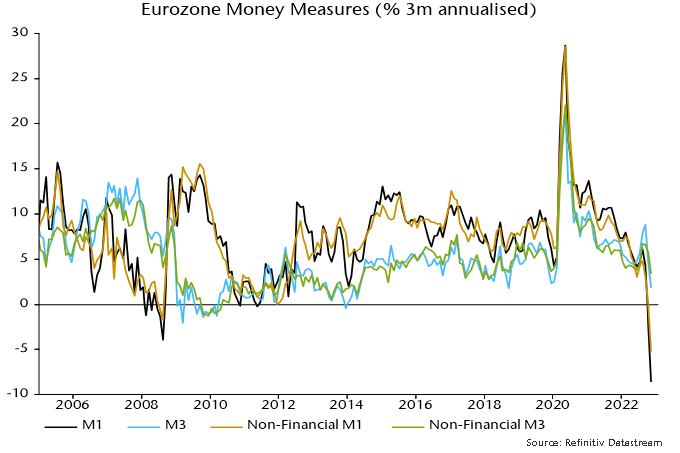
Broad money growth had been supported by solid expansion of bank loans to the private sector but, as expected and signalled by the ECB’s lending survey, momentum is now fading – chart 2. Slumping credit demand and forthcoming QT suggest that broad money will follow narrow into contraction.
Chart 2
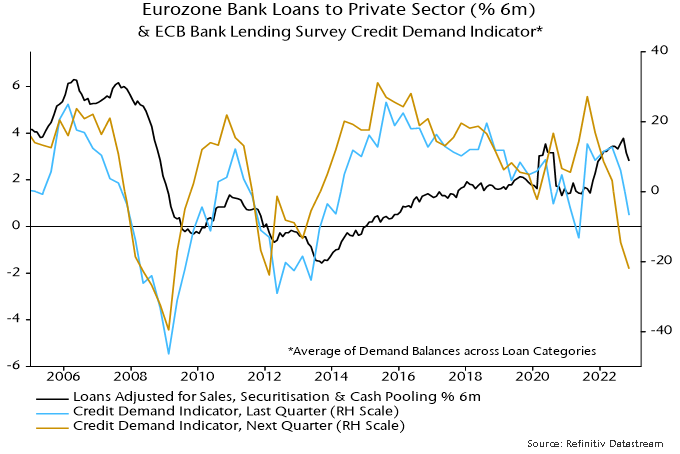
Corporate loan demand had been boosted by inventory financing but stockbuilding reached a record share of GDP in Q3 – chart 3 – and is probably now being cut back sharply, contributing to a move into recession. Consistent with this story, short-term loans to corporations contracted in both October and November.
Chart 3
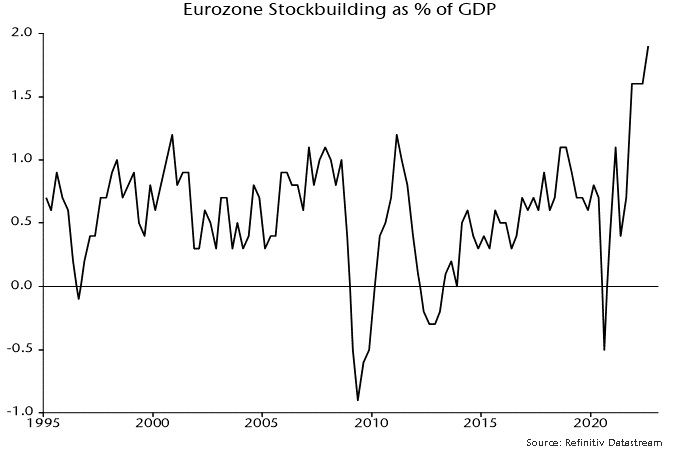
A sharp fall in inflation will support real money trends but has yet to arrive. The six-month rate of contraction of real non-financial M1 reached another new record in November – chart 4.
Chart 4
Monetary tightening in 2007-08 and 2010-11 was associated with a divergence of money trends across countries, reflecting and contributing to financial fragmentation. This is occurring again, with weakness focused on Italy.
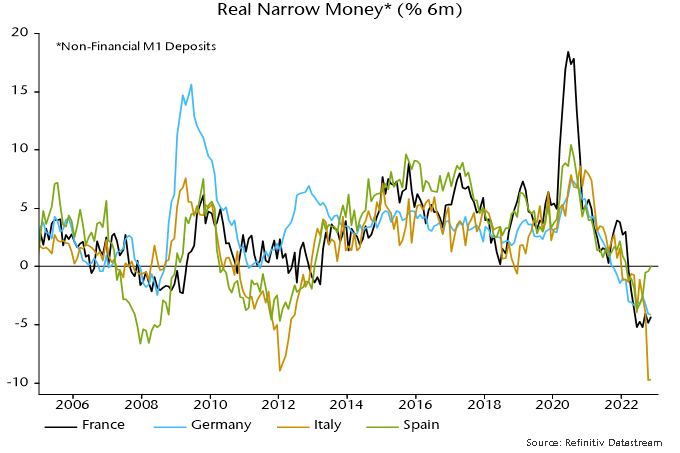
Italian real narrow money deposits contracted by 9.7%, or an annualised 18.4%, in the six months to November, with the larger decline than elsewhere due to both greater nominal weakness and higher CPI inflation – chart 5.
Chart 5
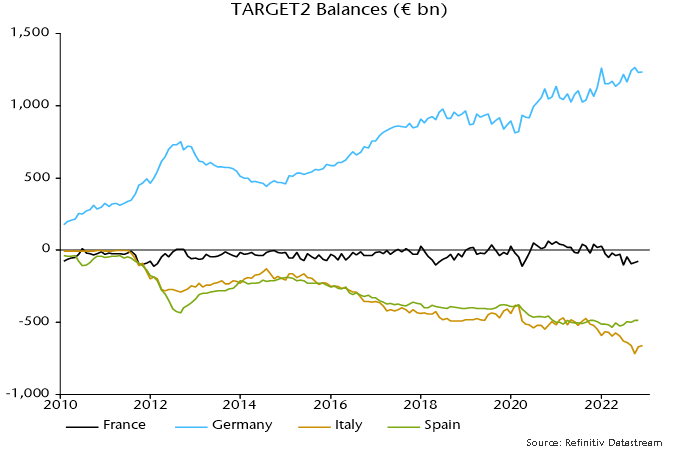
In nominal terms, total bank deposits in Italy were unchanged in the year to November – chart 6. Italian banks’ assets grew modestly over this period. The banks funded this expansion by increasing their net borrowing from Banca d’Italia, which in turn accessed additional funding from the Eurosystem, resulting in a further widening of its TARGET2 deficit. The deficit reached a record €715 billion in September following a surge in Italian BTP yields, falling back in October / November – chart 7. Another rise in yields since early December may have been associated with deposit outflows from the banking system and renewed upward pressure on the TARGET2 shortfall.
Chart 6
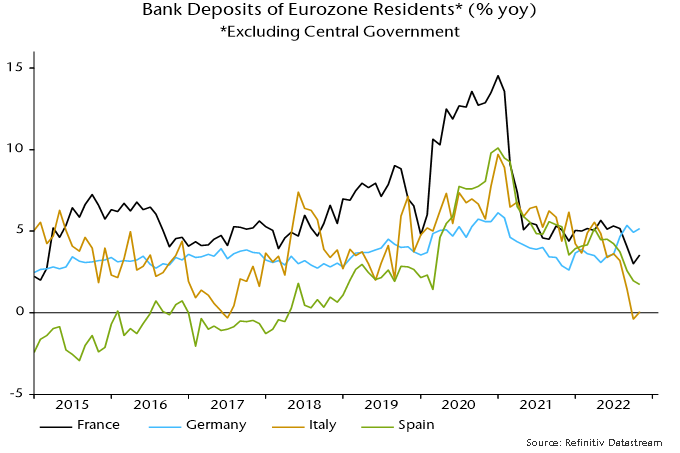
Chart 7