The fluctuation in mergers and acquisitions (M&A) activity in 2021 followed a typical cyclical pattern, echoing broader economic trends. The initial surge in M&A was propelled by low interest rates and a swift reopening from the COVID-19 pandemic that encouraged companies to pursue strategic acquisitions. This led to the highest M&A volumes since 2007.
However, several factors dampened the momentum in 2022-23. Aggressive interest rate hikes, rising inflation, geopolitical tensions such as the war in Europe, and an overall economic slowdown contributed to a decline in M&A activity. Additionally, decreasing confidence among C-suite executives and a wider bid-ask spread between buyers and sellers further reduced dealmaking.
As a result, total M&A volumes dropped by 18% to approximately $3 trillion in 2023, according to data from Dealogic. This marked the lowest level of M&A activity since 2013 when deal volumes were at $2.8 trillion, indicative of the challenges and uncertainties faced by global dealmakers amidst shifting economic conditions and geopolitical risks.
All of this changed when the Federal government started hinting about lowering interest rates in 2024. This week, we look at how this trend stands to benefit our portfolio.
Global M&A volumes
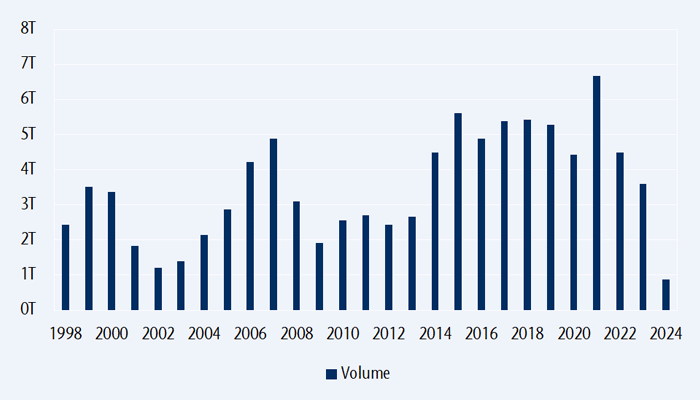
Source: Bloomberg
Starting bell sounding for an upswing in M&A activity
Despite ongoing macroeconomic and geopolitical uncertainties, signs are pointing to a potential turnaround for dealmaking in 2024. Three key factors support this optimism:
- Financial markets have rebounded significantly since the previous year, with expectations for declining interest rates.
- Considerable “dry powder” is waiting on the sidelines, coupled with a rise in board confidence.
- There is pent-up demand for deals, alongside an ample supply, reflecting a readiness to engage in M&A activity.
Global non-financial listed companies hold $5.6 trillion in cash, while private market investors possess $2.5 trillion in dry powder, providing substantial resources for dealmaking. Additionally, depressed small cap valuations along with structural factors such as advancements in AI, the transition to clean energy, innovation in life sciences, reshoring initiatives and geographic diversification are further driving demand for M&A.
The dismal performance of 2023, marked by the lowest completed M&A volumes in a decade relative to nominal US GDP, underscore the potential for a rebound in deal activity in 2024. So, how big can it get?
We could see up to $9.5 trillion of M&A in 2024
Based on Dealogic’s data, global M&A volume has averaged around $5.5 trillion per year since 2014. With corporations potentially aiming to catch up on the $2 trillion shortfall from the last two years, M&A volumes for 2024 could range from $5.5 trillion to about $9.5 trillion. Actual figures will depend on various factors such as economic conditions, geopolitical stability and corporate strategies.
The underlying drivers are especially visible in markets like Europe that have seen a drought in M&A activity.
Western Europe M&A volumes
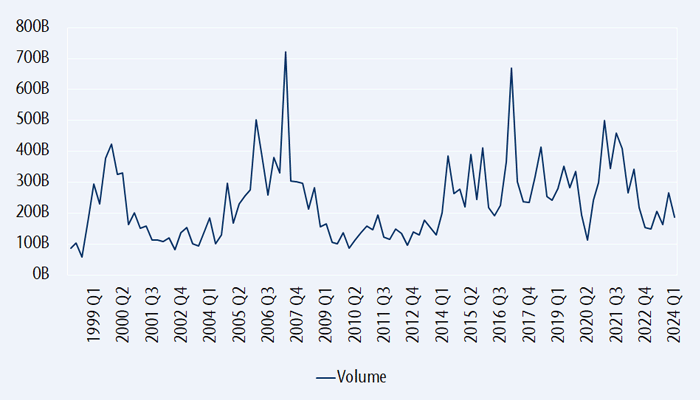
Source: Bloomberg
Looking at Japan, the structural shift towards greater corporate efficiency and activity is notable and expected to drive further M&A activity in the market. Despite the challenges faced by global markets, Japan has managed to maintain positive M&A volumes, demonstrating a resilience and proactive approach among Japanese companies.
Rising costs, stricter governance rules and mounting shareholder pressure are compelling companies in Japan to explore strategic options, including M&A. This trend is part of a broader effort to enhance corporate performance and unlock shareholder value.
Moreover, the potential wave of management buyout (MBO) activity in Japan is bolstered by recent reforms in the Tokyo Stock Exchange and guidelines by the Ministry of Economy, Trade and Industry (METI) for corporate takeovers. These reforms and guidelines are meant to promote shareholder earnings and increasing corporate value, aligning with the goals of enhancing efficiency and profitability.
For Japanese companies, especially those with lower capital efficiency, MBOs present an attractive way to streamline operations, improve governance and maximize shareholder returns. As a result, we can anticipate more M&A and MBO activity in Japan as companies adapt to evolving market dynamics and regulatory environments.
Japan M&A volumes
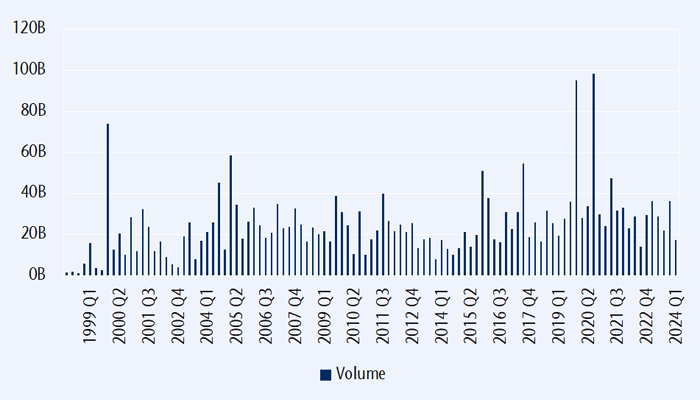
Source: Bloomberg
Many other markets like Australia, India, Korea and ASEAN are also expecting heightened M&A activity this year.
How does this impact the portfolio?
The accelerating M&A environment can be positive for smaller companies as their larger counterparts are willing to pay to acquire agile and innovative companies that can provide positive long-term growth perspectives. Furthermore, big companies seem to be diversifying by acquisition type. Larger, maturing companies can lack the same innovation capabilities as small companies to adjust, create and develop faster due to their nimble structure.
How else do we participate in the M&A cycle?
Another way to capitalize on this trend is by investing in a M&A advisory firm. These companies provide advice on corporate mergers, acquisitions and divestitures as well as debt and equity financing, acting as intermediaries in business sale transactions for either the selling company or the buyer.
We have profited from the M&A theme via Rothschild & Co., a France-based merger and acquisition boutique firm that has generated solid returns for our clients. Also, we recently initiated a position in Evercore, a name we have owned in the past and decided to repurchase because it is poised to outperform its competitors in the M&A space.
Founded in 1995, Evercore is an independent investment bank and asset manager, ranking #1 among independent firms and #4 among all M&A boutiques, including well-known players like Goldman Sachs. The company has a strong and liquid balance sheet, making it an excellent example of an investment that should benefit from the exciting uptick in M&A activity.