US economic “resilience” in 2023, recent inflation stabilisation and buoyant risk asset markets raise the question of whether the current level of policy rates is restrictive.

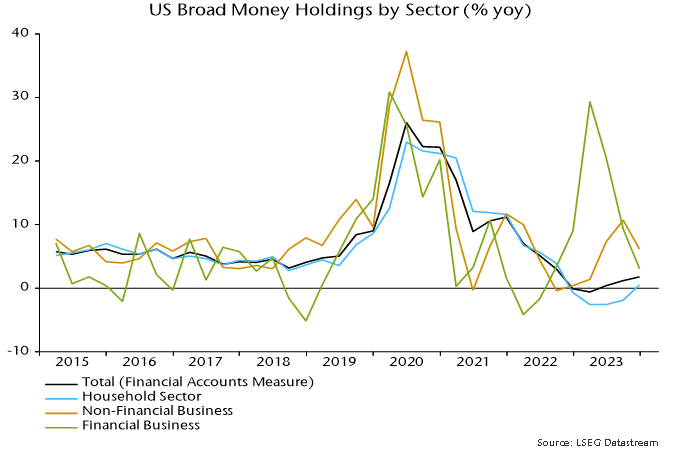
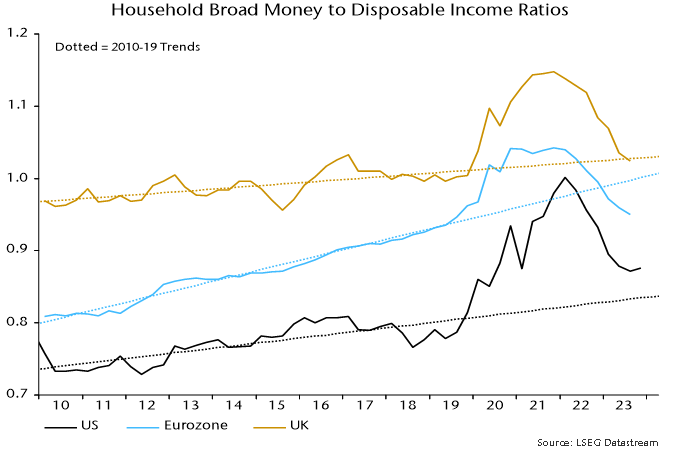
A “neutral” level of rates, according to the monetarist view, is one that results in monetary growth consistent with target inflation. Based on 2010s experience, US broad money expansion of about 5% pa could reasonably be expected to yield medium-term inflation of 2%. (“Broad money” here refers to an expanded M2 measure – “M2+” – incorporating large time deposits at commercial banks and institutional money funds.)

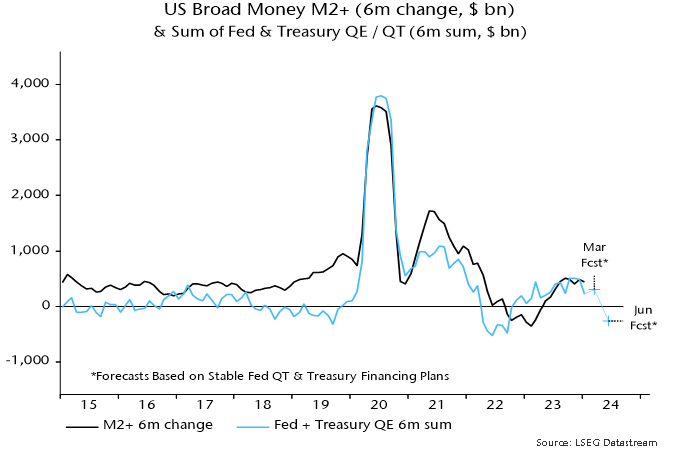
The six-month rate of change of broad money recovered from negative territory in early 2023 to 3.7% annualised in January, remaining at this level in February – see chart 1. This might be taken to suggest that the economy is adjusting to the higher level of rates and the current deviation from “neutral” is modest.

Chart 1

Chart 1 showing US Broad / Narrow Money (% 6m annualised)

Money growth over the past year, however, was boosted by unusual deficit financing operations, which more than offset monetary destruction due to the Fed’s QT. The Treasury’s plans to scale back bill issuance imply a sharp reversal in Q2, as previously discussed.

Put differently, the “neutral” level of rates may have been temporarily lifted by the Treasury’s financing operations but a relapse is now likely.

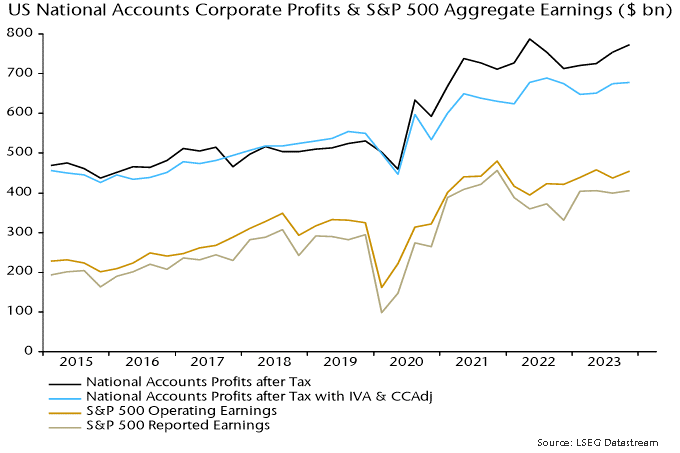
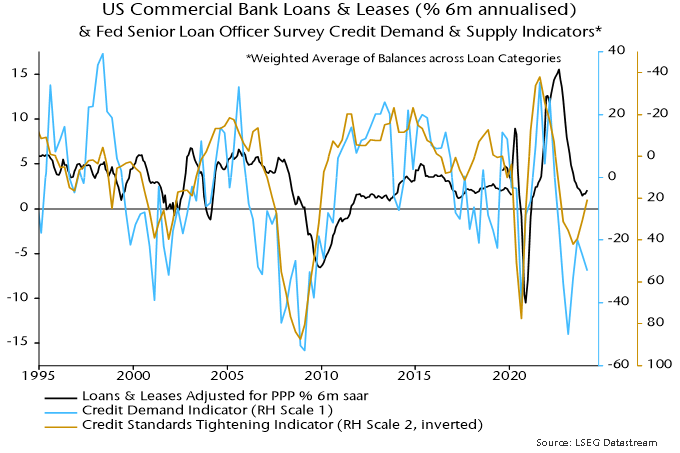
Could a recovery in bank lending offset a near-term drag on money growth from less expansionary Treasury operations and ongoing QT? Six-month growth of commercial bank loans appears to have bottomed in late 2023 but was only 2.1% annualised in February, while the last Fed loan officer survey remained downbeat – chart 2.

Chart 2

Chart 2 showing US Commercial Bank Loans & Leases (% 6m annualised) & Fed Senior Loan Officer Survey Credit Demand & Supply Indicators* *Weighted Average of Balances across Loan Categories

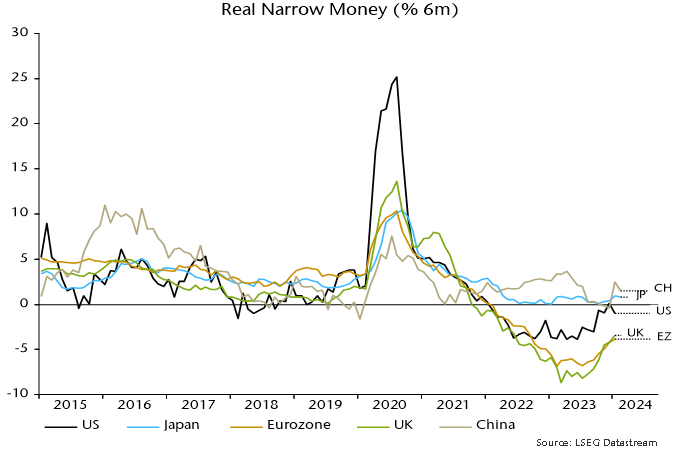
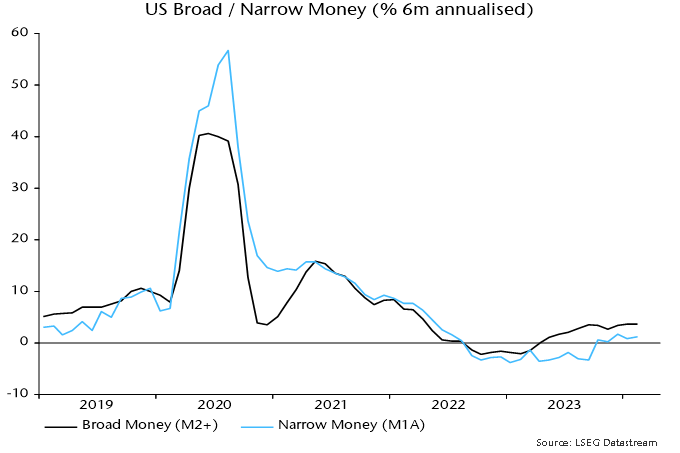
The suggestion that “neutral” is significantly lower than the current level of policy rates is supported by narrow money trends. (“Narrow money” = M1A = currency in circulation plus demand deposits.) Six-month momentum also recovered during 2023 but peaked at only 1.7% annualised in December, easing to 1.2% in February – chart 1.

Narrow money may be re-entering contraction – monthly changes were negative in January and February.

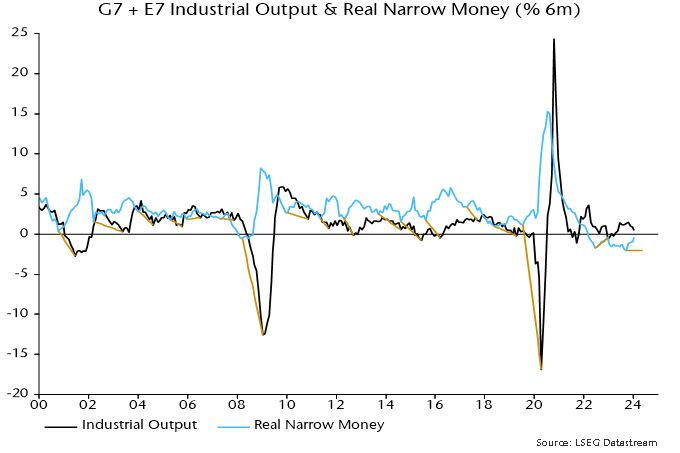
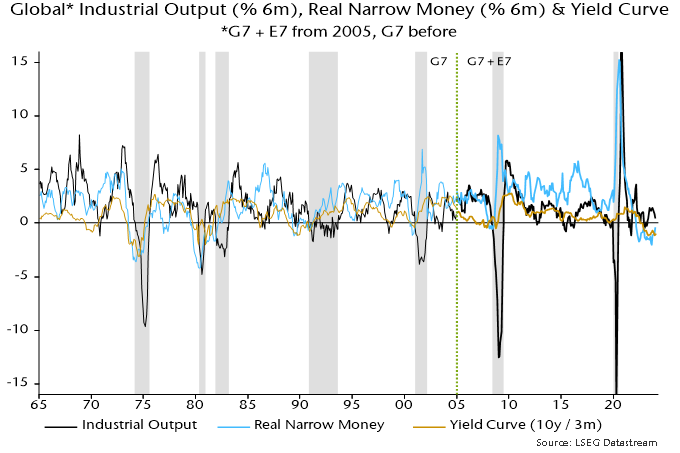
The latest US data support concern that a minor recovery in global six-month real narrow money momentum is about to go into reverse.

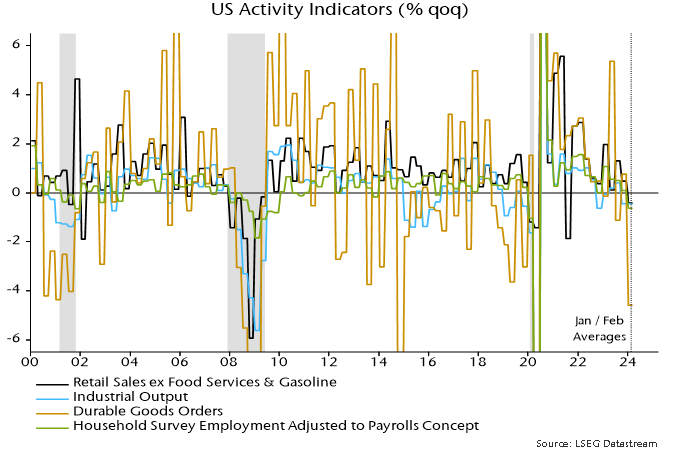
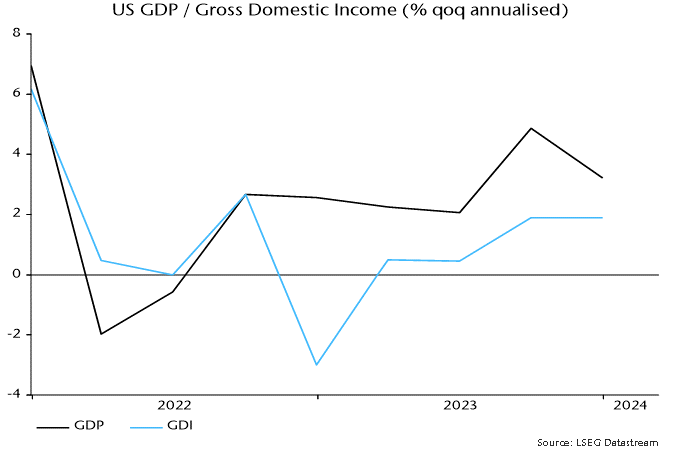
Meanwhile, weakness in US “hard” economic data for January / February has, perhaps, received less attention than it deserves. Average levels of retail sales, industrial production, durable goods orders and household survey employment were lower than in Q4 – chart 3. March data could change the story but joint quarterly declines were historically characteristic of recessions.

Chart 3

Chart 3 showing US Activity Indicators (% qoq)

View of Shibuya Crossing in Tokyo, Japan, one of the busiest crosswalks in the world.

Japan’s banking sector has long been overlooked by investors. It’s considered either not essential to own or to be avoided due to the challenges posed by negative interest rates and deflation, which have consistently squeezed bank profitability. However, the recent rally in Japanese banking stocks since 2023 signals a potential return to normalcy. So, what exactly is happening within Japan’s banking sector, what factors are driving the rally and is it sustainable?

Looking back – Deflation and Japan’s ultra-loose monetary policy

Understanding the current situation entails looking back on Japan’s prolonged battle with deflation and the rationale behind introducing negative interest rates.

Japan has experienced deflation since the mid-1990s, following the collapse of its economic bubble in the early 1990s. Various economic factors, including a domestic consumption tax hike from 3% to 5% and the Asian currency crisis in 1997, put downward pressure on the Japanese economy. In response, the Bank of Japan (BOJ) gradually reduced its policy rate throughout the 1990s, eventually adopting a zero-interest rate policy in 1999. Despite briefly abandoning this policy in 2000, the BOJ introduced quantitative easing in 2001 after the bursting of the IT bubble in the US. Further challenges emerged with China’s entry into the World Trade Organization in 2001, putting deflationary pressure on Japan by supplying cheap labour. The Great Financial Crisis of 2008 intensified the issues. Exports were sluggish due to a strong yen against dollar (USD/JPY fell below the 76 level), and declining demand amid a global recession.

Change began to emerge in late 2012 with the introduction of Prime Minister Abe’s economic policies, known as Abenomics, which included quantitative and qualitative easing measures. This initially signalled a shift away from deflation. But the momentum stopped when the government hiked the consumption tax rate from 5% to 8% in April 2014. Then BOJ Governor Kuroda committed the BOJ to achieving 2% inflation, but the target was pushed further into the future.

Recognizing the need for intervention, the BOJ introduced negative interest rates in January 2016, surprising the market and causing significant disruptions. Subsequently, the BOJ introduced its yield curve control policy in September 2016, which had been in effect until it was terminated by the BOJ earlier this week.

Turning the tides by escaping deflation and normalizing interest rates

Fast forward to today, after decades of efforts to fight deflation, Japan is finally seeing signs of progress. Inflation has been consistently above the BOJ’s targets of 2% since May 2022, helped by price hikes and wage increases.

Historically, Japanese companies are reluctant to pass on higher costs to consumers or clients, fearing it may damage the relationship. Instead, they turn to cost-cutting measures internally. However, the unprecedented challenges during the pandemic forced many companies to negotiate higher prices with customers. To their surprise, most customers were cooperative and willing to accept the price increase, leading to improved margins across industries. The mindset of Japanese companies is also starting to change, where they are becoming more willing to pass on higher costs and reduce unprofitable businesses.

Additionally, Prime Minister Kishida’s government has been pushing corporates to increase wages, a key policy of its “new form of capitalism” campaign. Finally in April 2023, labour unions in Japan won the biggest pay increase in 30 years in their spring wage negotiations with management, achieving an average wage hike of 3.7%. In 2024, the union group announced an even higher raise of 5.28%. Although this largely applies to the biggest companies in Japan, smaller employers are likely to follow suit given the country’s tight labour market. With higher disposable income and improved consumer sentiment, the virtuous cycle should be able to support the sustainability of inflation. As a result, the BOJ decided to guide overnight lending rates to 0% to 0.1%, up from -0.1% to 0%, marking the first time the BOJ has raised its interest rates in 17 years.

Rallying behind banking: Equity markets and corporate governance reform

Equity markets are starting to view Japanese banking stocks as normal investment targets once again due to the end of deflation and interest rate normalization.

Another positive change is corporate governance reform. Although it has been several years since the Corporate Governance Code was established by the Tokyo Stock Exchange (TSE) in 2015, 2023 saw the most changes at Japanese publicly listed companies after the TSE called on companies’ management to be more mindful of the cost of capital and stock prices to enhance corporate value. This initiative particularly targets companies with price-to-book ratios below 1x. The vast majority of Japanese banks trade at a significant discount to their book value. Responding to this request, many banks laid out improvement plans aimed at enhancing Return on Risk-weighted Assets (RORA), Return on Equity (ROE) and shareholder returns.

Looking ahead, the prospects of Japanese banks appear promising, with sustainable inflation driven by economic growth and wage increases. In addition, the relocating of manufacturing facilities back to Japan amid the onshoring and reshoring trend, and increased loan demand, are also expected to benefit the sector. Japan is still in the very early phase of rate normalization, and Japanese banking stocks are still in the process of returning to normal compared with Japanese stocks in general. The improving financial metrics should also help J-banks to be more comparable to their global peers.

Spotlight on Concordia Financial Group

We initiated a position in Japanese regional bank Concordia Financial Group (7186 JP) in 2023. Concordia FG consists of three banks – the core is Bank of Yokohama, with over 100 years of history – and two other smaller banks, Higashi-Nippon Bank and Kanagawa Bank, which the group acquired in the past few years. As one of Japan’s largest regional banks, Concordia FG boasts efficient operations and strong loan growth, particularly in Tokyo and the Kanagawa Prefecture, which have seen the highest net migration from other areas and strong banking demand due to high concentration of corporates and SMEs.

Unlike some of the problematic regional banks in the US that rely on corporate deposits, Japanese banks have accumulated their deposits over time from loyal retail customers. In the case of Concordia FG, over 70% of deposits are from retail channels. Even after the bank run at Silicon Valley Bank (SVB) in March 2023, deposits at Concordia FG continued to grow steadily, with no obvious change in customers’ banking behaviour. The bank maintains a low securities-to-asset ratio of 12%. The same ratio was over 50% for SVB. The bank also has very tight risk controls in its lending practices, maintaining a conservative loan-to-asset ratio of 85%. The banks’ loan portfolio is well-diversified, with no exposure to the commercial real estate sector in the US.

Further prospects and technological advances

Despite Japan’s rising personnel costs, Japanese banks’ management teams remain committed to controlling costs. Recent years have seen continued downsizing efforts, including branch closures and reductions in the number of ATMs. Branch closures are not simply an effort to reduce network size, but part of a strategic shift to increase online banking usage and enhance convenience for consumers. Efforts include expanding the number of ATMs at convenience stores and providing non-branch ATMs in collaboration with other major banks.

Another Japan-based bank we invest in, Seven Bank (8410 JP), is expected to benefit from this trend. With banks seeking to streamline their ATM fleets, some have chosen to partner with Seven Bank, boasting the largest ATM network in Japan with over 27,000 ATMs. Its next-generation ATMs offer advanced features beyond simple deposits and withdrawals, including face recognition for identity verification, settlement with QR codes and the ability to open bank accounts. It also utilizes AI and IoT to predict cash demand more precisely and detect potential component failures, which helps to optimize ATM operations.

As Japan’s banking sector continues to adapt to evolving economic conditions, we remain optimistic about its long-term prospects.

Global six-month real narrow money momentum – a key leading indicator in the forecasting approach employed here – has recovered from a low in September 2023 but remains negative and could be stalling. Allowing for the typical lead, this suggests a slide in economic momentum into mid-year with limited subsequent revival.

Monetary trends, therefore, cast doubt on the current market consensus view that a global cyclical upswing is under way.

The real money / economic momentum relationship is primarily directional, i.e. involving turning points rather than levels. Chart 1 highlights related troughs in six-month rates of change of global (i.e. G7 plus E7) real narrow money and industrial output since 2000. The average lead time at these lows was eight months, with a range of four to 14.

Chart 1

Chart 1 showing G7 + E7 Industrial Output & Real Narrow Money (% 6m)

So the September 2023 low in real money momentum could be associated with an output momentum low any time between January and December 2024.

The directional relationship was briefly disrupted during the pandemic but has since been reestablished: a trough in real money momentum in June 2022 was followed by an output momentum low in December 2022, with subsequent peaks in December 2022 and October 2023 respectively.

Six-month output growth in January was the slowest since May.

While the directional relationship is intact, output momentum in 2022-23 was much stronger than suggested by prior levels of real money momentum. As previously discussed, this is probably attributable to a monetary “overhang” from rapid growth in 2020-21. The ratio of the stock of global real narrow money to industrial output returned to its March 2020 level in September last year and has since moved sideways, arguing for a normalisation of the levels relationship of real money and economic momentum.

The recovery in real money momentum between September 2023 and January 2024 was broadly based across countries but the US pick-up reversed in January – see previous post – while Chinese / Japanese momentum declined in February – chart 2. So the global revival could be stalling with momentum still negative. (A February update will be provided following release of US / Eurozone monetary data next week.)

Chart 2

Chart 2 showing Real Narrow Money (% 6m)

How do monetary signals compare with messages from the yield curve?

Chart 3 shows a longer-term history of six-month rates of change of global industrial output and real narrow money, along with the differential between GDP-weighted averages of 10-year government bond yields and three-month money rates. (The chart splices together G7 data through 2004 with subsequent G7 plus E7 numbers.)

Chart 3

Chart 3 showing Global* Industrial Output (% 6m), Real Narrow Money (% 6m) & Yield Curve *G7 + E7 from 2005, G7 before

The directional leading relationship between real money and economic momentum is equally convincing pre-2000, with a similar average lead time.

The yield curve has broadly mirrored trends in real money momentum, with a slight tendency for money to lead. However, the curve predicted fewer output momentum turning points, particularly in recent years, i.e. monetary signals have been more informative and reliable.

Continued yield curve inversion is consistent with still-negative real money momentum. An increase in inversion since October, moreover, contrasts with the recent monetary recovery, supporting concern that the latter may be stalling.

Combinations of negative real money momentum and an inverted curve were always followed by global recessions. The longest interval between a joint signal and recession onset was in 1989-90: real money momentum and the yield curve were both negative in April 1989, with a recession judged to have started in November 1990*.

The most recent joint signal occurred in October 2022, when the yield curve moved into inversion. Based on history, a recession would be expected by May 2024 at the latest. Are markets premature in sounding the all-clear? Assuming no downturn through May, should the signal be disregarded? Do I feel lucky?

*The recession bands in the chart begin when the six-month change in industrial output turns negative ahead of a fall to below -1.25% (not annualised).

Asian traveler with suitcase next to row of luggage carts at airport.

Summary

  • A bounce in unloved Chinese equities led a positive month for EM stocks, with the MSCI EM Index up nearly 5% in USD terms.
  • Among the leaders was portfolio holding Trip.com, which surged over 25%, reflecting a recovery in consumer demand for travel in China.
  • Korean stocks continued a run of strong performance fed by enthusiasm for the government’s proposed Corporate Value-up Program (covered in detail in last month’s commentary: Super-cheap Korean equities rally on market reform talks).
  • With around a third of South Korea’s population actively participating in the stock market, the reforms have boosted the ruling Democratic Party’s legislative election prospects, its approval rating reaching 40% against 33% for the opposition. The chart below from CLSA shows the turnaround in fortunes since the program was announced earlier in the year.

Korea general election poll
Line graph showing election polling results in Korea, July 2023 to February 2024.
Source: Gallup Korea &  CLSA, March 2024.

  • With less than one month before the election, re-election of the Democratic Party with a mandate to press forward with the reforms could be a catalyst for further outperformance by Korean equities.


AI boom exposes supply chain bottlenecks

The global rush is on to harness an explosion of AI innovation, with investment by hyperscale cloud and consumer tech giants only the first wave of adoption powering demand for the technology.

Waves of AI adoption


Source: Nvidia Corporate Presentation, 2024.


What unleashed this step change? While some more complex neural network architectures and algorithms have emerged in recent decades, the real shift has been the rapid advances in brute processing power that enables machine learning.

The chart below illustrates the yawning gap which has opened up between the power of GPUs (green line) and conventional CPUs (blue line), with the former now capable of executing many trillions more operations per second (TOPS).

Explosion in power of high-end chips
Line graph showing increasing GPU computing performance relative to CPUs.
Source: Nvidia/Arteris, 2023.


The chart also hints at one of the key bottlenecks to scaling AI applications like ChatGPT – aside from the difficulty of meeting the sheer scale of demand for Nvidia’s high-end GPUs –  which is “memory wall.”

To illustrate the concept, one useful analogy we have heard is to imagine an AI server as a steam train, with the GPU being the engine, data being the coal, and the network being the person shovelling the coal. Getting all the juice out of the massive GPU engine depends in large part on how quickly that coal (data) can be shovelled into the furnace.

This is where High Bandwidth Memory (HBM) comes in. HBM is physically bonded to the GPUs in stacked layers via thousands of pins which enable “massively parallel data throughout” (The Pragmatic Engineer: Five Real-World Engineering Challenges).

HBM stack

Source: Semiconductor Engineering, 2023.


This tech enables the data transmission at a speed of about 3TB/second, around 100 times faster than conventional data transfer architecture powering PCs. This speed is crucial given the massive amounts of data that need to be fed into large language models like ChatGPT.

The issue (and opportunity) is that this wave of demand for leading-edge computing tech to power AI is far outpacing supply. HBM costs around five times more than conventional memory, with Korean memory giant SK Hynix controlling half of global supply, and the remainder split between Samsung and Micron. Hynix is set to enjoy a margin boost driven by premium memory products such as HBM, which it forecasts to grow at a 60-80% CAGR for the next five years.

Emerging markets are home to a host of companies like Hynix, which dominate their respective niches in the AI supply chain. Opportunities exist across multiple segments including fabrication, design, and testing capabilities, as well as key components (like HBM) that form the foundations of hyperscale computing that powers AI.

Chinese stocks outperform as stimulus efforts kick into gear

Chinese stocks are plumbing the depths, now trading at a CAPE of around 10X (from 21X in 2021) discounting a deflationary outlook. While Premier Li Qiang attended the World Economic Forum meeting in Davos earlier this year to announce that China met its 5% GDP growth target for 2023, investors were fretting about steepening consumer price declines. The stock market is signalling an increasing risk of corporate bankruptcies (BBC – Evergrande: Crisis-hit Chinese property giant ordered to liquidate) and financial instability in the absence of decisive monetary and/or fiscal intervention.

Will the authorities blink? It is certainly within the Party’s wheelhouse to pivot, especially given the risk that further economic malaise stokes political instability. The abrupt end to zero-COVID policy in 2022 is the most recent pragmatic policy turn under Xi. Could he reprise Deng Xiaoping’s dictum that “to get rich is glorious” alongside an announcement of fiscal stimulus?

That is doubtful to say the least, but recent activity suggests the authorities understand there is a problem. SOE and SOE-linked names outperformed through February on the back of the “national team” (state-backed financial services companies) ploughing US$57 billion into Chinese equities so far in 2024 (China ‘national team’ ETF buying reaches $57bn this year, says UBS). The chart below from fund data provider EPFR shows flows from local Chinese investors into domestically domiciled China funds (blue line) of just under $100 billion over the 12 months to 31st January 2024. Contrast this with negative flows for foreign-domiciled China funds (i.e. for foreign investors) over the same period.

Line graph comparing domestic and foreign investment in China-based equities, March 2023 to March 2024.
Source: EPFR


During the month, Xi Jinping was briefed by the China Securities Regulatory Commission (CSRC), coinciding with the replacement of the Commission’s chief Yi Huiman in favour of former banking regulation veteran Wu Qing (known as the “broker butcher”). Bloomberg noted that the move echoed government efforts in 2016 to boost market confidence by dismissing financial regulators amid a market rout (China Replaces Top Markets Regulator as Xi Tries to End Rout).

A visit to the central bank by Xi last year preceded record levels of lending from the PBoC to the banks in Q4, followed by an earlier and larger than expected cut in the reserve requirement ratio (RRR) in January, which suggests the central bank is now back on an easing track.

Money rates responding to liquidity injection

Interest rate movements in China, 2020 to 2024.
Source: LSEG Datastream.


On the fiscal side, the government revealed a GDP target of “around 5%” at its National People’s Congress, suggesting further modest stimulus is on the way.

We have flagged in previous commentary the risk that deteriorating institutional quality under Xi appears to be crushing the animal spirits of entrepreneurs and consumers. Indeed, we saw Xi tighten the CCP’s grip over the private sector, announcing new anti-corruption crackdowns across a host of key sectors in January.

Tone-deaf policymaking amid a fragile economic backdrop is causing economic paralysis and interferes with the credit impulse. No one is complaining about a shortage of credit. The real issue is a shortage of confidence among consumers and businesspeople. Consumers are hoarding cash in time deposits, while banks aren’t looking to borrow short and lend long to businesses to invest. While all of this is structurally negative for China over the long term, continued policy easing at these valuations could be the catalyst for a large trading rally in Chinese equities.

MSCI China at record discount to rest of EM

Line graph comparing the MSCI China Index and MSCI EM ex. China Index price-to-book and 12-month forward earnings.
Source: LSEG Datastream.
Our strategy is to maintain a modest underweight to China and position defensively while waiting for further confirmation that liquidity is improving.

A display of colorful woven fabrics from India.

One of the perks of being on the road to meet our holdings is the opportunity to see firsthand the daily challenges of running a business. It’s often said that the devil is in the details, and this holds particularly true in emerging markets, where every few kilometres bring a change in culture, customs and language. Some industries demand more from their execution strategies than others, with the microfinance sector standing out due to its complexity. While simple in concept, providing loans to underserved populations is more nuanced in practice.

The birth of microfinance

The microfinance business has its origins in Bangladesh, where Nobel Laureate Mohammed Yunus discovered that, despite their lack of resources, the impoverished were neither lacking in financial savvy nor in reliability as borrowers. In 1983, Yunus founded Grameen Bank, focusing on the strengths of his clients, including trustworthiness and creativity, rather than their lack of formal education or financial resources.

One of our holdings, CreditAccess Grameen (CREDAG IN), mirrors Grameen Bank’s business model and name. Our recent visit with CREDAG allowed us to observe its operations and engage with its customers, 99% of whom are women. As India’s largest microfinance institution, with 1,900 branches, 4.6 million clients and $2.7 billion in assets under management, CREDAG in our view exemplifies how to handle the complexities of a demanding businesses.

Ground-level insights

CREDAG’s strategy emphasizes local engagement and consistently doing the “little things” right. In a nation with 22 official languages, having branches staffed by locals who understand the regional dialect and economy are key. This local presence marks many employees’ first foray into the formal job market, fostering a strong sense of loyalty among them.


Outside a typical rural CREDAG branch in rural Bangladore.

We got to see CREDAG in action, where morning efforts focus on collections and afternoons on new client acquisition. The company’s investment in employee wellbeing, evidenced by providing kitchen spaces, covering grocery costs and reimbursing fuel expenses, further translates to high employee loyalty.

Relationship building – more than just transactions

The local economy in the villages we toured is driven by dairy and silk farming. In fact, the district is India’s largest cocoon silk producer.


A CREDAG client with her home silkworm business. The silkworms are feeding on mulberry leaves.


Silkworm cocoons in a bamboo tray for the local wholesale market.

Building customer relationships

Our participation in collection meetings highlighted the importance of CREDAG’s joint lending model.


A CREDAG collection meeting outside the village temple.

Meetings start and end with pledges, underscoring the powerful psychology of positive reinforcement to change borrowers’ behaviour for the better.

Leadership within borrower groups streamlines the payment process, allowing for relationship building, educational and sales opportunities. With most of its customers having no credit history or verifiable income, local connections (and intelligence) become crucial parts of good underwriting.

We also had the chance to see an income-generation loan being paid out to a dairy farmer.


Receipt for a 2-year, Rs 50,000 loan for buying a cow to be repaid in 104 installments.

Customized innovation: tradition meets tech

CREDAG leads in integrating technology, reducing client onboarding times and introducing new products rapidly. Its core banking solution caters to remote areas. Even with no internet connection, loan applications can be processed offline and then bulk uploaded when access is available. This allows CREDAG to offer flexible repayment options that align with its customers’ income cycle and new products like gold loans to reduce product time to market.

We also saw its technology in action. CREDAG offers cash emergency loans of up to RS 1000 as a complimentary service to creditworthy customers. This is especially beneficial to those in far-flung areas with no nearby bank branch. Customers can scan their biometric details to pull up their account information on the loan officer’s tablet. Once account details are verified, cash is disbursed on the spot. The whole exercise takes less than five minutes!


A CREDAG customer getting her biometrics scanned for account verification.

Details, details, details

Our visit with CREDAG reinforced how small details matter in building loyalty and maintaining operational efficiency. In the case of CREDAG, it translates to a best-in-class cost structure and customer retention ratio. While we recognize the inherent cyclicality of the microfinance sector, our visit helped us appreciate the need for rigorous execution and a deep understanding of the local context to achieve operational excellence.

Perceptions of UK labour market “resilience” rest partly on continued growth in the payrolled employees series, based on PAYE data. This series, however, is likely to have been boosted by a rise in the proportion of self-employed people included in PAYE.

Labour Force Survey (LFS) employment is, at least in concept, the most comprehensive measure of employed people, including all employees and self-employed. The payrolled employees series covers most employees* along with self-employed people who receive pay through PAYE. The latter group includes business owners who choose to draw a salary, contractors on the payroll of the client and self-employed people with second jobs as employees.

LFS employment peaked in the three months to April 2023, standing 150,000 below that level in the three months to January. This is consistent with GDP / gross value added data indicating a recession starting in Q2 2023.

The payrolled employees series, by contrast, grew by 270,000 over the same interval.

This continues a longer-term divergence. LFS employment in the latest three months was 85,000 above its pre-pandemic peak, reached in the three months to February 2020. Payrolled employees have increased by 1.3 million since then – see chart 1.

Chart 1

Chart 1 showing UK Employment Measures (mn, 3m ma)

There are two reasons for suspecting that the payrolled employees series has been swollen by increased PAYE coverage of the self-employed. First, reform of IR35 rules in the private sector in April 2021 are likely to have resulted in some contractors being moved onto clients’ payrolls.

Secondly, the number of employee jobs has risen by more than employee numbers, suggesting a rise in multiple job-holding**. This may have resulted in some people identifying as self-employed in the LFS being picked up in PAYE.

LFS self-employment was 4.33 million in the three months to January. A rough guide to the number included in PAYE is the difference between the payrolled employees series and the LFS measure of employees – 1.6 million.

Chart 2 shows that the latter differential mirrored changes in LFS self-employment until early 2021. It then embarked on a rising trend while LFS self-employment moved sideways. The timing is consistent with an impact from the IR35 reform.

Chart 2

Chart 2 showing UK LFS Self-Employment (mn, 3m ma) & Payrolled Employees / LFS Employees Differential (mn, 3m ma)

The rise in the payrolled employees / LFS employees differential is unlikely to be solely attributable to increased PAYE coverage of the self-employed. The decline in quality of LFS data due to a falling response rate may have been associated with underrecording of growth in employee numbers.

The payrolled employees series, nevertheless, warrants a health warning and its relative strength should be at least partly discounted, particularly as it jars with other evidence including an ongoing fall in vacancies, rising claimant unemployment, weak REC jobs reports and a recent increase in redundancies.

Addendum: Falling US temporary help services employment has been a harbinger of weakness in aggregate payrolls historically. UK LFS temporary employment has a patchier record as a leading indicator but a plunge since the summer is eye-catching – chart 3.

Chart 3

Chart 3 showing UK LFS Temporary Employees (mn, 3m ma)

*It does not include employees of companies paying below the national insurance lower earnings limit.

**The Workforce Jobs dataset shows a rise in employee jobs of 1.79 million between Q4 2019 and Q4 2023 versus a 955,000 increase in the LFS measure of employee numbers over the same period.

The Fed’s quarterly financial accounts provide information on sector money trends and funds flows. Several features of the Q4 accounts, released last week, are noteworthy.

First, net retirement of equities by non-financial corporations (via buy-backs and cash take-overs) reached a record dollar amount ($270 billion) in Q4, confirming that corporate buying was a key driver of the year-end rally – see chart 1.

Chart 1

Chart 1 showing US Non-Financial Corporations: Net Retirement of Equities ($ bn)

The rise in equity purchases followed strong growth of non-financial business broad money holdings in the year to end-Q3, discussed in a previous post. Such holdings, however, contracted slightly in Q4, pulling annual growth down from 10.6% to 6.2% – chart 2.

Chart 2

Chart 2 showing US Broad Money Holdings by Sector (% yoy)

Financial business money holdings had surged in the year to end-Q1 2023, perhaps partly reflecting cash-raising related to equity market weakness in 2022. These balances were run down during H2, though still finished the year slightly higher than at end-2022.

The recent weaker trends in non-financial and financial business money suggest less buying support for equities and other risk assets going forward.

Household broad money, by contrast, rose solidly in Q4, resulting in the annual change returning to positive territory. The ratio of money holdings to disposable income recovered slightly following six consecutive quarterly declines, remaining above its pre-pandemic trend, in contrast to shortfalls for corresponding Eurozone and UK ratios – chart 3.

Chart 3

Chart 3 showing Household Broad Money to Disposable Income Ratios

The Q4 financial accounts also contain initial estimates of corporate profits and gross domestic income (GDI). Profits after tax adjusted for stock appreciation and economic depreciation rose at a 2.5% annualised rate last quarter and remain below a peak reached in Q3 2022 – chart 4, blue line. The range-bound movement is consistent with S&P 500 earnings data and questions perceptions of economic / profits strength.

Chart 4

Chart 4 showing US National Accounts Corporate Profits & S&P 500 Aggregate Earnings ($ bn)

GDI is an alternative estimate of GDP and has consistently lagged the headline expenditure-based measure in recent quarters – see previous post. It did so again in Q4, rising at a 1.9% annualised rate versus headline GDP growth of 3.2% – chart 5. GDI grew by just 1.2% in the year to Q4.

Chart 5

Chart 5 showing US GDP / Gross Domestic Income (% qoq annualised)

Sunset view of high voltage electricity towers on the shoreline of San Francisco bay area; California.

It’s no secret that the US electrical grid is in a dire state now more than ever. Most of the infrastructure we see today was built in the 1960s and 1970s, with over 70% being more than 25 years old. Marked by significant and consistent underinvestment, the US grid continues to experience increasing supply disruptions, blackouts and fire incidents. Maintenance and repair are perpetual needs. A notable example of maintenance disrepair happened last year with the Hawaiian Electric fire. In August 2023, Maui County sued Hawaiian Electric, the state’s largest supplier of electricity, accusing the utility of negligence in what became the deadliest US fire in over a century resulting in thousands of acres burned and over 100 fatalities.

The push for electrification

Additionally, with rising population levels and the ongoing push for electrification, the grid is ill-equipped to manage the volume of electricity being transmitted through existing power lines. Electricity demand in the US is expected to increase by 18% by 2030 and 38% by 2035. This increased electricity transmission will be driven by the transition to electric vehicles as well as the build out of carbon-neutral energy sources, namely renewables.

Facing the future: investment and innovation

To meet the rising demand and supply of electricity, significant augmentation and expansion of the current grid, with substantial resources invested, will be necessary. Several states have already announced massive investment projects to address these needs. Notably, in October 2023, the Biden-Harris administration announced a USD$3.5 billion funding initiative for 58 projects across 44 states for grid infrastructure, signalling the beginning of extensive future investments. The International Energy Agency estimates that, by the end of the decade, over $600 billion a year will need to be invested globally to ensure a resilient supply of clean and reliable electricity. In fact, from 2020 to 2023, global grid investments have grown from USD$285 billion to over USD$310 billion.

Bar chart showing growth of energy transition investment, 2004 to 2023.

Source: BNEF

These developments make the grid infrastructure trend one we are closely watching as we seek to identify companies poised to benefit from this theme.

Nexans: a catalyst for change

One such company is Nexans (NEX FP), a recent addition to our portfolio that stands to gain from escalating investment in US grid infrastructure over the next decade. A France-based cable manufacturer with a significant presence in the US, Nexans specializes in producing high, medium and low voltage transmission cables and serves a variety of end markets.

Several years ago, recognizing the global trend towards electrification, Nexans decided to realign its portfolio to become a pure electrification player by 2024, committing to divest from three divisions unrelated to this goal, namely telecom, auto harness and a portfolio of small unrelated segments.

2023 marked a transition year for the company as it intensified its refocus efforts. This was met by some volatility in its stock price due to a challenging market environment that made divestment difficult along with uncertainties in offshore wind markets. However, the company has recently shown significant progress and is delivering on its portfolio transition ahead of schedule. Moreover, offshore wind markets in the US are experiencing renewed positive sentiment, evidenced by strong auction prices that de-risked them last week. Nexans’ stock price has rebounded from a multiyear low in October 2023 to a multiyear high and we remain optimistic about the company’s future prospects and its successful transition to full electrification.

Hands holding freshly roasted aromatic coffee beans.

Coffee is one of the most valuable agricultural commodities and the most widely used socially acceptable drug, yet few people take the time to understand its significance in modern society and human history. Originating from an Ethiopian mountainside a couple of thousand years ago, today’s coffee market sustains roughly 125 million jobs. With its total addressable market estimated at $468 billion, it’s on track to outpace global GDP, fueled by rising per capita consumption in emerging markets.

Medicinal luxury to cultural staple

Initially, coffee in Europe was a medicinal luxury for the elite. As it became more accessible, it gradually became the favoured drink of both blue- and white-collar workers, embedding itself in Western culture. The first English coffeehouse opened at Oxford University in 1650. By 1700, there were over 2,000 coffeehouses paying more rent than any other trade at the time. Coffee’s exploding popularity can be attributed to the historical British reputation for alcohol consumption; coffee presented a healthier alternative that still offered a communal space for socializing – and it helped with hangovers.

Coffee’s political and economic influence

In 18th century Germany, its popularity even led Frederick the Great to ban it to curb the outflow of money abroad and promote beer, Germany’s traditional beverage. This prohibition spurred a flourishing black market and large-scale protests that lasted four years before being revoked. The impact of coffee in England and Germany, however, pales in comparison to its role in shaping American culture and history.

Coffee and the American Revolution

The famous Boston Tea Party is often cited as the tipping point of coffee in the US. Americans were already avid consumers of tea, coffee and beer at the time and most taverns and coffeehouses offered all three options to their patrons. In an act of defiance against King George’s tea tax, Americans embraced coffee as a symbol of independence, significantly boosting its consumption. From 0.19 pounds per capita in 1772 to 1.41 pounds by 1799, coffee became intertwined with the fabric of the nation, a trend that has only grown stronger with time.

Why coffee captures our attention

So, why is Global Alpha excited about coffee? Are we investing in coffee beans? If you’ve been reading our commentaries for a while, you’ll know that we often seek creative and sometimes indirect exposure to secular themes that we favour. Like most commodities, coffee is a volatile and hard to predict market prone to oversupply and weather events – areas outside our expertise. Instead, we are invested in a company that provides tools for coffee enthusiasts to enjoy their drinks precisely as they want to.

Brewing success in the coffee appliance market

De’Longhi SpA (DLG IM) is an Italian global leader in the production of small domestic appliances, with a market-leading position among European coffee makers. The company designs its premium products in-house and its brand appeal is best-in-class, boasting a 35% global market share in the espresso coffee machine segment. It’s fitting that a company like De’Longhi originated in Europe, where per capita coffee consumption is the world’s highest.

Local success to global expansion

De’Longhi’s initial success lent strong credibility to its brands and has helped accelerate its global expansion in the last decade, especially in the US and Far East markets. Historically, the company sold professional coffee makers through its Eversys brand, but in December it announced the acquisition of La Marzocco to accelerate its leadership in the professional segment. The professional coffee-making market alone is a $5 billion industry growing at approximately 5% annually, driven by a long-term shift from making coffee at home to buying it from coffee shops. Starbucks for example plans to expand its current 38,000 stores to over 55,000 by 2030. This acquisition enables De’Longhi to cover virtually the entire coffee machine space, from budget-friendly to luxury household and high-output professional machines.

De’Longhi SWOT analysis

Strengths

  • Brand recognition in espresso machines (De’Longhi) and food preparation (Kenwood/nutribullet).
  • Strong distribution partnerships globally and owned manufacturing capacity.

Weaknesses

  • The household appliance market is highly competitive.
  • Consumer habits and preferences for coffee consumption are continuously evolving.

Opportunities

  • Expansion of the professional coffee segment following the acquisition of La Marzocco.
  • Opportunities for product innovation.

Threats

  • Consolidation of the distribution market.
  • Valuation of potential M&A targets.

Brewing beyond the bean

Most of our weekly readers, much like ourselves, are probably coffee consumers, yet many of us spend little time thinking about this beverage we crave each morning. This “taken-for-granted” product represents exactly the kind of space Global Alpha aims to invest in for the long term.

Source: Pendergrast, M. (2010). Uncommon Grounds: the history of coffee and how it transformed the world.

US monetary conditions eased during H2 2023, reflecting the Treasury’s decision to skew debt issuance towards bills and the Fed’s December pivot. This loosening is now reversing, partly because of the recent sticky inflation scare and associated back-up in yields, and prospectively as the Treasury scales back bill financing in Q2.

January monetary statistics are consistent with a turnaround. The narrow M1A measure followed here contracted by 1.4% on the month, more than reversing a 1.0% December gain. Broad money M2+ stagnated after a 0.8% December rise*.

Six-month M2+ growth appears to be rolling over in line with the forecast in a previous post – see chart 1. To recap, sales of Treasury bills to money funds should continue to offset the monetary impact of the Fed’s QT during Q1 but the Treasury’s plans to redeem bills in Q2 imply a dramatic contractionary shift – unless the Fed simultaneously halts QT.

Chart 1

Chart 1 showing US Broad Money M2+ (6m change, $ bn) & Sum of Fed & Treasury QE / QT (6m sum, $ bn)

Prospective monetary weakness poses a threat to risk assets and could coincide with economic news that derails the current soft / no landing consensus. This consensus has been bolstered by a recent pick-up in the ISM manufacturing new orders index, a widely-watched cyclical indicator. A post in July signalled a coming ISM rebound but suggested that it would prove temporary.

That remains the base-case view here. A relapse is expected in reflection of global real narrow money weakness into last autumn and on the view that the 2022-23 stockbuilding cycle downswing has yet to reach a final low.

US six-month real narrow money momentum has led swings in ISM new orders historically. The currency component has displayed a slightly stronger correlation than the aggregate, probably because of a linkage with retail goods spending – chart 2. Real currency momentum signalled the current ISM recovery but has been moving lower since last summer. January retail sales weakness may have been more than weather-related and the ISM recovery may be about to abort.

Chart 2

Chart 2 showing US ISM Manufacturing New Orders & Real Currency in Circulation (% 6m)

*M1A = currency in circulation plus demand deposits. M2+ = M2 plus large time deposits at commercial banks and institutional money funds.