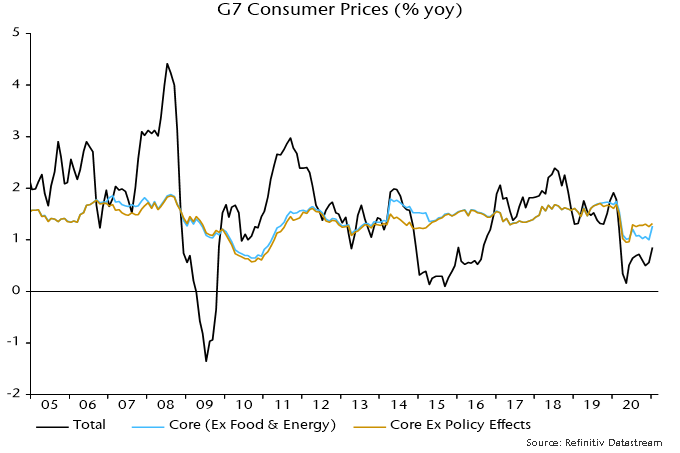
G7 headline consumer price inflation will spike in H1 2021, possibly reaching 3-4%, which would mark a 13-year high. Central banks will portray the rise as a temporary blip but the “monetarist” view is that higher inflation is related to the 2020 broad money surge and will be sustained into 2022. A key issue is whether G7 broad money growth will return to its low post-Global Financial Crisis (GFC) average in 2021. Monetary financing of enlarged fiscal deficits was the key driver of the 2020 surge and is likely to remain a significant contributor in 2021, suggesting that broad money will grow by 5-10% over the course of the year.

G7 core CPI inflation, i.e. excluding food / energy and adjusting for policy effects such as VAT changes in Germany / the UK and Japan’s travel subsidy programme, is estimated to have been stable at 1.3% in January – see chart 1. Mainstream forecasters had expected a significant fall in response to last year’s economic weakness but the latest reading is exactly in line with the post-GFC average (i.e. over 2010-19).

Chart 1
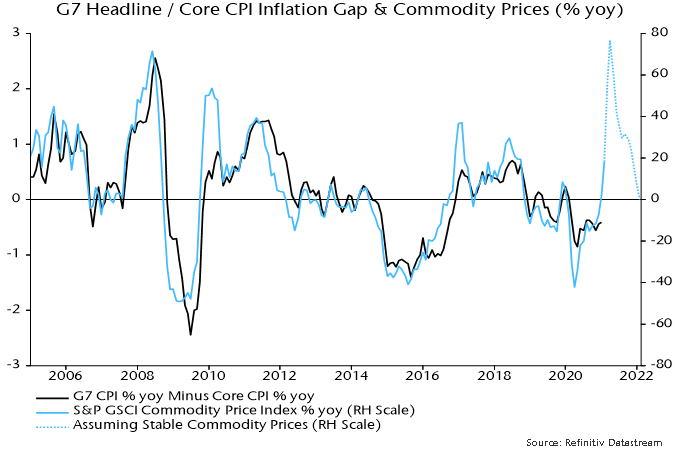
Headline inflation remained below core in January but the headline / core gap will spike during H1, reflecting recent commodity price strength and base effects. The relationship in chart 2 suggests that the gap will reach 2 percentage points or more, in which case stable core inflation of 1.3% would imply a headline rate peak of 3-4%.

Chart 2
Central banks and the consensus are expecting a pick-up, though probably not on this scale. The official response will be insouciance – an inflation comeback, it will be argued, would be welcome but the rise is temporary / technical, with output gapology signalling future weakness. Headline inflation is indeed likely to retreat during H2 but the “monetarist” view is that it will continue to exceed forecasts into 2022, reflecting last year’s broad money surge and an average two-year lead from money to prices. Commodity prices may strengthen further later in 2021, with core inflation lifting into 2022.

Chart 3
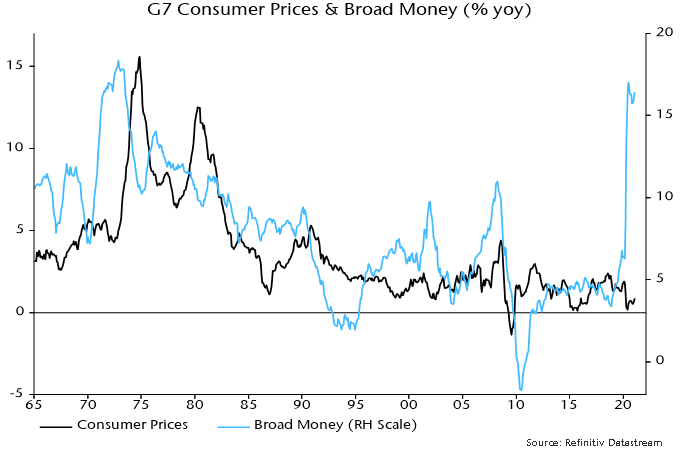
Medium-term inflation prospects, on this view, hinge critically on whether G7 broad money growth will return to around its low post-GFC average of 3.7% during 2021. Annual growth, estimated at 16.4% in January, will fall sharply from March as negative base effects kick in but the central case here is that it will end the year at 5-10%, consistent with a lasting inflation upshift.

The central case recognises that monetary financing of fiscal deficits was the key driver of the broad money surge and – with deficits remaining large – is likely to make another sizeable contribution this year. Bank lending to the private sector is projected to grow weakly but not to contract, as it did after the GFC as banks sought to pare their balance sheets to boost capital ratios.

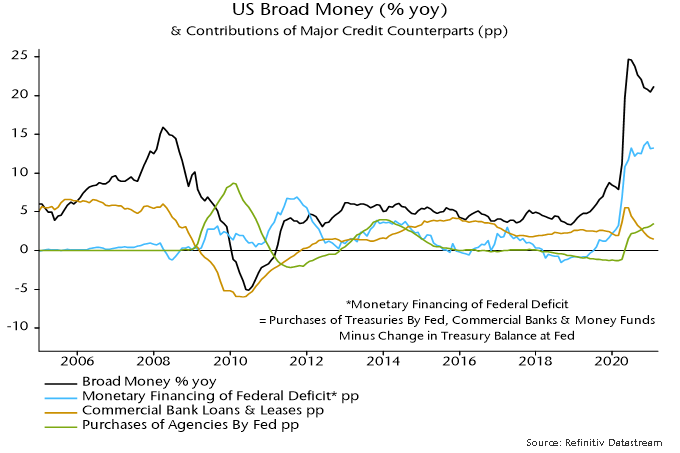
Chart 4 shows the main credit counterparts of US broad money* growth. Monetary deficit financing – defined as net lending to the federal government by the Fed and private monetary institutions – accounted for an estimated 13.2 percentage points (pp) of annual broad money growth of 21.2% in January. The Fed’s purchases of agency MBS added a further 3.5 pp, with growth of commercial banks’ loans and leases contributing only 1.5 pp.

Chart 4
The rise in monetary financing mirrored the blow-out of the federal deficit, which reached 16.0% of GDP in 2020 – chart 5. Non-monetary financing as a share of GDP – the gap between the black and blue lines – was slightly larger in 2020 than in 2019, though smaller than in 2018.

Chart 5
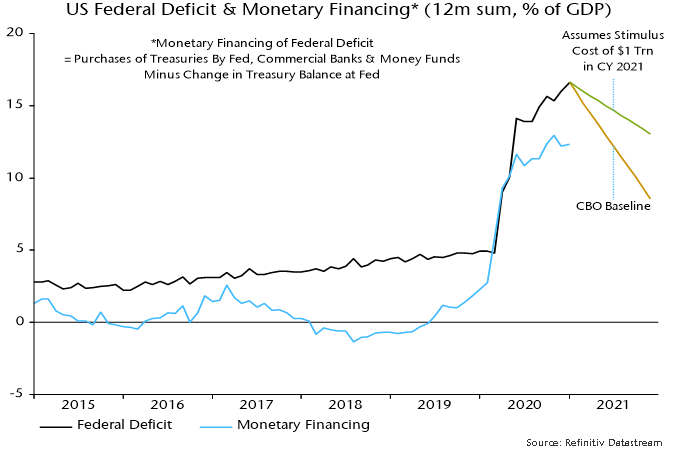
The CBO’s revised baseline budget forecasts released last week suggested a fall in the federal deficit to below 9% of GDP in 2021 on unchanged policies. President Biden’s stimulus package could, on a conservative estimate, maintain it at about 13% of GDP. Assuming that monetary financing covers the same proportion as in 2020, the implied contribution to broad money growth in the 12 months to December 2021 would be about 9 pp.

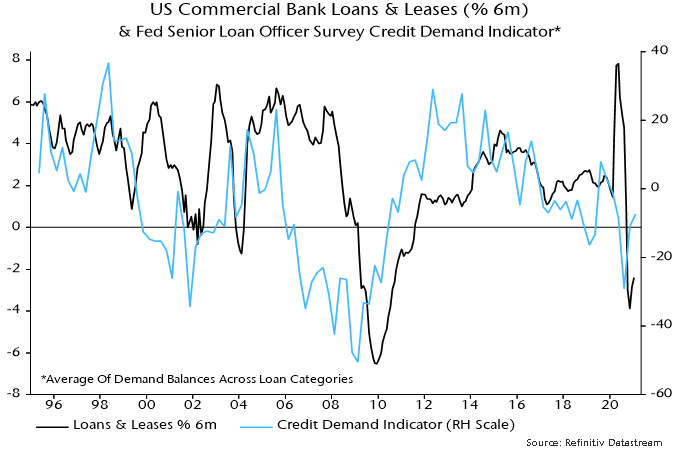
Will a contraction in commercial bank lending pull down broad money growth, as it did after the GFC recession? The latest Fed senior loan officer survey reported a reduction in credit tightening along with a modest recovery in demand – chart 6. Bank lending may make little contribution to money growth in 2021 but is unlikely to be a major drag.

Chart 6
Fed purchases of agency MBS are running at $40 bn per month, suggesting a 2 pp contribution to broad money growth over a year. Other credit counterparts could conceivably have a negative impact (e.g. banks’ net external lending if capital were to flow out of the US in scale) but a reasonable base case is money growth of at least 5% during 2021 and probably significantly higher.

A similar argument applies in other G7 economies. Monetary deficit financing accounts for the bulk of recent UK broad money growth and has also been a key influence in the Eurozone. Fiscal deficits may show an earlier decline than in the US but bank lending to the private sector could make a larger contribution, reflecting official subsidy and guarantee schemes.

*M2 plus large time deposits at commercial banks plus institutional money funds.

In the blink of an eye, the month of January is behind us. Despite the fact that most indices have barely moved (MSCI World Index -1.05%, Nasdaq 0.29%, S&P 500 -1.11%, MSCI World Small Cap 2.03%, MSCI EAFE Small Cap -0.42%, and Russell 2000 4.85% – as of January 31, 2021), the year has gotten off to an eventful start. A “David and Goliath” phenomenon is taking shape on social media and it is wreaking havoc on the stock market.

Retail investors are targeting certain stocks, which happen to be the most shorted by top global hedge funds. Spreading their message across social media, these investors have created a ripple effect, which has impacted the fundamental structure of the stock market. Many media outlets are calling this wave “the battle of David and Goliath”.

The Great Short Squeeze?

Like many brick-and-mortar retailers, GameStop (GME) was battling to survive in the ecommerce world. Not surprisingly, given the challenges the business faced, its stock price was steadily falling. Because of poor fundamentals, GME became one of the favourite shorts of many hedge funds, resulting in over 100% of the outstanding shares being sold short. What followed was a textbook example of a short squeeze. A few traders started the trend and it quickly created a snowball effect as retail investors on social media sites (like Reddit) jumped on board.

As more people started to buy GME shares, the short sellers had no choice but to cover their positions, creating further demand and leading to higher prices. This resulted in chaos. According to Reuters, estimated losses from shorting GME have topped over $1 billion. That number skyrockets to $71 billion if we include all the shorts in the United States (US) so far in 2021. And, this is just the tip of the iceberg. An army of over 2.8 million Reddit users, from a group called WallStreetBets, continues the hunt for other highly shorted stocks.

In the beginning of January, three large hedge funds, Melvin, Maplelane and D1, saw their assets drop over 25%. The drop in their NAV may have breached International Swaps and Derivatives Association

This report is provided solely for informational purposes and nothing in this document constitutes an offer or a solicitation of an offer to purchase any security. This report has no regard to the specific investment objectives, financial situation or particular needs of any specific recipient and does not constitute a representation that any investment strategy is suitable or appropriate to a recipient’s individual circumstances. Global Alpha Capital Management Ltd. (Global Alpha) in no case directly or implicitly guarantees the future value of securities mentioned in this document. The opinions expressed herein are based on Global Alpha’s analysis as at the date of this report, and any opinions, projections or estimates may be changed without notice. Global Alpha, its affiliates, directors, officers and employees may sell or hold a position in securities of a company(ies) mentioned herein. The particulars contained herein were obtained from sources, which Global believes to be reliable

(ISDA) triggers, which in turn would lead to mass liquidation by their prime brokers. Melvin got a

$2.75 billion capital injection from Citadel and P72 to meet capital requirements, without which we may have seen an even larger meltdown.

This wave has gone Global

Hitting Wall Street like a tsunami, the ripple effect is being felt around the world. A Goldman Sachs basket of the most heavily shorted stocks has surged over 50% in January – its biggest monthly gain since at least 2008 (index start date).

An online community called Bursabets is the Malaysian version of Reddit. It has over 8,000 members who are targeting shares of glove makers. This sector was the most shorted as Malaysia lifted its short selling ban in 2021. Plus, with vaccine roll outs in the news, yesterday’s COVID pandemic winners are quickly turning to losers.

On Stockal, an Indian trading platform, GME shares are over 15% of trading volume and among the top five most-traded names on the platform. In India, leverage is not allowed while trading foreign stocks, so people are risking their savings hoping to cash in on the trend.

The situation is no different in China, where chat rooms frequented by retail investors are showing similar trends. GME and AMC Entertainment are the most-traded US names on Futu Holdings, a trading platform used by individual investors in China and Hong Kong.

Fundamental Impacts on the market?

Brokers – This increased trading also impacts the basic infrastructure of the financial system. The Depository Trust & Clearing Corporation (DTCC) is a post-trade financial services company providing clearing and settlement services to the financial markets. The DTCC has demanded large sums of collateral raising industry capital requirements to $33.5 billion, an increase of 29% in just one week.

This capital increase impacted all brokers including Robinhood, who has been forced to draw millions on its credit lines, and raise over three billion to meet higher margin requirements. Robinhood had no choice but to comply.

Options market – As a levered instrument, the short-squeeze also impacts the options market. There has been an increase in small trades (less than 10 contracts) in the option market, leading to a bullish feedback loop. As most option sellers trade volatility and hence are short gamma, they are hedging this risk by buying the underlying security when it goes up in price. This creates the bullish feedback loop as dealers buy the underlying stock as a hedge.

This report is provided solely for informational purposes and nothing in this document constitutes an offer or a solicitation of an offer to purchase any security. This report has no regard to the specific investment objectives, financial situation or particular needs of any specific recipient and does not constitute a representation that any investment strategy is suitable or appropriate to a recipient’s individual circumstances. Global Alpha Capital Management Ltd. (Global Alpha) in no case directly or implicitly guarantees the future value of securities mentioned in this document. The opinions expressed herein are based on Global Alpha’s analysis as at the date of this report, and any opinions, projections or estimates may be changed without notice. Global Alpha, its affiliates, directors, officers and employees may sell or hold a position in securities of a company(ies) mentioned herein. The particulars contained herein were obtained from sources, which Global believes to be reliable

Is there a bubble brewing somewhere else?

SPAC-tacular – There is an increase in special-purpose acquisition companies (SPAC), which are shell companies that raise money through initial public offerings (IPO) to acquire a private company, which then merges with the SPAC and becomes public.

To put in perspective, in 2014, SPACs raised $1.8 billion in US IPOs, based on the data from SPAC Research. In 2021, SPAC IPO have already raised $16 billion compared to $4 billion raised across nine traditional IPOs in the first three weeks in 2021. In 2019, SPACs represented 59% of total US IPO capital raising $76 billion in equity proceeds. The movement of billions of dollars in SPAC may highlight people’s real fear of missing out (FOMO), by jumping on the bandwagon.

Over The Counter (OTC) – It should come as no surprise that the lightly regulated OTC market is not immune to day trading effects. As penny stocks are back in vogue, over one trillion shares have changed hands on the OTC market. Many penny stocks have seen trading volume in billions of shares.

Will history repeat itself?

At the moment, euphoria has set in and everyone is having a good time, but not thinking of the consequences of excessive indulgence.

Tech Bubble – The environment today is similar to what investors saw before the tech bubble in 2000. Back then chat rooms were used by day traders as a source of ideas. Unprofitable company stock prices skyrocketed, as fundamentals did not matter. A new breed of amateur day traders poured their life savings into companies they knew very little about. Stock markets became the world’s largest casinos. When the music stopped, many companies went bankrupt and many retail investors lost everything.

The great financial crisis of 2008 – Back then home prices were expected to only appreciate. So individuals started buying houses they could not afford by leveraging themselves with freely available credit. We are seeing a similar phenomenon with the “David and Goliath” effect. Many retail investors think stock prices will continue going up forever. However, over the long run, stock prices are driven by fundamentals not speculation.

Unsurprisingly, many retail investors do not even know what they are buying. For example, an Australian company called GME Resources with the stock ticker GME (same as GameStop) jumped up 60% as its volume increased by 2,000% driven by retail investors who thought they were buying the real GameStop.

This report is provided solely for informational purposes and nothing in this document constitutes an offer or a solicitation of an offer to purchase any security. This report has no regard to the specific investment objectives, financial situation or particular needs of any specific recipient and does not constitute a representation that any investment strategy is suitable or appropriate to a recipient’s individual circumstances. Global Alpha Capital Management Ltd. (Global Alpha) in no case directly or implicitly guarantees the future value of securities mentioned in this document. The opinions expressed herein are based on Global Alpha’s analysis as at the date of this report, and any opinions, projections or estimates may be changed without notice. Global Alpha, its affiliates, directors, officers and employees may sell or hold a position in securities of a company(ies) mentioned herein. The particulars contained herein were obtained from sources, which Global believes to be reliable

Portfolio Impact

While every media channel is overly focused on GameStop, the reality is the market cap is a very small percentage of the total US market capitalization. Could GameStop be the canary in the coal mine?

Many hedge funds are being forced to delever and right size their portfolios. This is leading them to sell higher quality names to cover the shorts, and giving fundamental investors an opportunity to buy quality companies at attractive valuations.

According to Goldman Sachs, there are over 265 SPACS with over $82 billion in equity currently searching for acquisition targets. Combined with leverage this would equate to over $410 billion, or 12% of US merger and acquisition (M&A) volume during the last two years. Corporations and private equity firms are also sitting on trillions of dollars of cash on their balance sheets – an optimal situation for increased M&A activity. Historically, our portfolio has seen a few acquisitions almost every year, and as the M&A market picks up, it is possible that more of our names may get acquired.

Our ability to be highly selective and nimble in our portfolio holdings leaves us well positioned to enter a period of great opportunity for fundamental stock pickers. Our focus on high-quality companies with defensible business models and strong balance sheets should help outperform our small-cap benchmark. As we reflect on the state of markets and the fundamentals of our target companies, we are excited about the current environment and future growth opportunities.

TORONTO, ON, February 10, 2021 – Crestpoint Real Estate Investments Ltd. (Crestpoint) today announced the acquisition of Northport Business Park in Edmonton, Alberta. Following this major acquisition, along with continued growth within its existing portfolio, Crestpoint’s total assets under management have grown to $5.8 billion. 

EDMONTON, AB

Northport Business Park – 17306 129 Ave., 17408 129 Ave., 17315 129 Ave., 12908 170 St. & 12861 175 St.

Northport Business Park is a Class-A new-generation warehousing and distribution complex located in northwest Edmonton. Built from 2009-2015, the property is comprised of five state-of-the-art buildings totaling 846,000 square feet and also includes 16.5 acres of outdoor storage yards, and 42.8 acres of serviced excess land which could support an additional 700,000 square feet of density. Strategically positioned in proximity to surrounding transportation corridors, the property provides quick access to several major highways and the CN Edmonton Intermodal terminal. It is 94% leased to 11 tenants operating in various industries including third-party logistics, medical distribution, and building supply. Crestpoint acquired the asset within the “Crestpoint Core Plus Real Estate Strategy,” Crestpoint’s open-end Fund.

“Crestpoint’s acquisition of Northport Business Park, a premier Class-A industrial park, is a great addition to our portfolio’s existing number of quality industrial assets located across Canada. As the gateway to the north, Edmonton is conveniently located in several trade corridors, providing distribution and logistics companies with strategic access to all of northern Alberta, northern British Columbia and many parts of Saskatchewan. As e-commerce adoption continues to grow, we anticipate that the demand for quality industrial space, such as Northport, will continue to drive absorption and rental growth.” said Colin MacKellar, Executive Vice President & COO of Crestpoint.

About Crestpoint Real Estate Investments Ltd.

Crestpoint Real Estate Investments Ltd. is a commercial real estate investment manager, with $5.8 billion of gross assets under management, dedicated to providing investors with direct access to a diversified portfolio of commercial real estate assets. Crestpoint is part of the Connor, Clark & Lunn Financial Group, a multi-boutique asset management company that provides investment management products and services to institutional and high net-worth clients. With offices across Canada and in Chicago, New York and London, Connor, Clark & Lunn Financial Group and its affiliates are collectively responsible for the management of over $86 billion in assets. For more information, please visit: www.crestpoint.ca.

Contact

Kevin Leon
President
Crestpoint Real Estate Investments Ltd.
(416) 304-6632
[email protected]

Global industrial momentum appears to have peaked and is forecast to move lower into Q2. This poses a risk to reflation-positioned markets.

The global manufacturing PMI new orders index – a timely summary measure of economic momentum – declined for a second month in January. The January fall was cushioned by a jump higher in the US component, possibly reflecting optimism engendered by the Biden administration’s fiscal plans. New orders in the alternative ISM manufacturing survey eased last month.

The forecast of a slowdown in industrial momentum is based on a decline in global (i.e. G7 plus E7) six-month real narrow money growth from a July 2020 peak. Full December monetary data confirm a further fall – see chart 1. Real money growth has led turning points in global manufacturing PMI new orders by 6-7 months on average historically, suggesting that the latter will move lower into mid-year. (Caveat: the lead time at the recent peak was four months, assuming that a November top in manufacturing PMI new orders is confirmed.)

Chart 1

Feb04_2021_Chart-1_Global_Manufacturing_PMI_New_Orders

Monetary trends had suggested that China would lead an early 2021 economic slowdown. Chinese money growth picked up relatively modestly last year and slowed later on as the PBoC allowed money rates to rise sharply. Chinese manufacturing PMI new orders fell significantly in January in both the Markit survey (incorporated in the global PMI) and the NBS alternative. The surveys also reported a rise in in finished goods inventories. The differential between NBS new orders and inventories correlates with and often leads global manufacturing PMI new orders – chart 2.

Chart 2

Feb04_2021_Chart-2_Global_Manufacturing_PMI_New_Orders

The expectation here had been that the PBoC would recognise downside economic risks and engineer a reversal lower in money rates. This seemed to be playing out, with three-month SHIBOR falling through December and most of January. The PBoC, however, appears to have regarded the decline as excessive and restricted liquidity supply around month-end, causing very short-term rates to spike temporarily. This risks extending the monetary slowdown.

The OECD’s leading indicators support the suggestion that global economic momentum is peaking. The OECD altered the calculation method for its indicators at the start of the pandemic without making this explicit in official documentation. This caused a break in the data that clouds interpretation. Chart 3 shows six-month growth of the G7 indicator calculated on the “old” basis, as well as a Chinese indicator that attempts to replicate the components of the OECD’s US leading indicator. The G7 indicator seems to be confirming an earlier growth peak in the Chinese series.

Chart 3

Feb04_2021_Chart-3_G7+China_Leading_Indicators

The V-shaped recovery in global industrial output during H2 2020 partly reflected a diversion of consumer spending from services to goods. G7 plus E7 real retail sales, however, fell back in late 2020 – chart 4.

Chart 4

Feb04_2021_Chart-4_G7+E7_Industrial_Output_Real_Retail_Sales

Forecasters argue that strong industrial output growth will be sustained by a rebound in stockbuilding as firms replenish depleted inventories. The view here has been that the stockbuilding cycle bottomed in Q2 2020 and is unlikely to peak before early 2022. Cycle upswings, however, typically play out in an a-b-c pattern and the initial upthrust (a) may already be complete, suggesting a near-term pause (b) before strength resumes later in the year (c).

The central case here is a modest near-term economic slowdown, with global manufacturing PMI new orders remaining above 50, followed by a reacceleration in H2 2021. This reflects a view that key investment cycles (stockbuilding / business investment / housing) are fundamentally supportive, as well as incorporating the consensus assumption of economic reopening from Q2.

A H2 reacceleration scenario, however, requires an early stabilisation and recovery in global six-month real narrow money growth. A Chinese pick-up had seemed the most likely driver of this but, as noted, appears to have been deferred. US money numbers could be boosted as new stimulus checks are sent out but this is unlikely before late March.

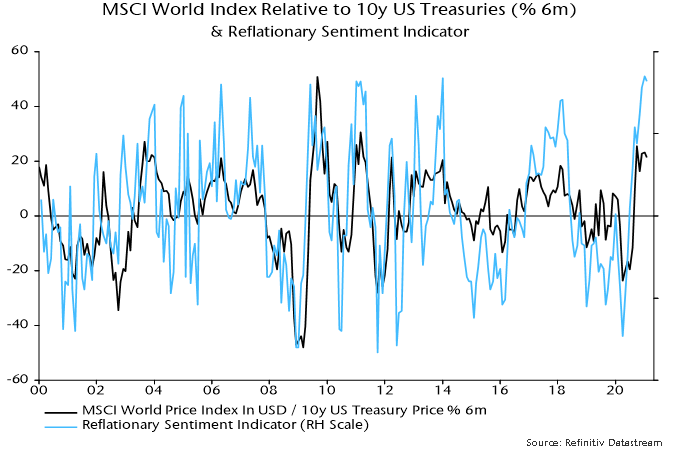
The risk of markets reacting negatively to disappointing near-term economic data is heightened by a strong reflationary bias in current investor positioning. Chart 5 shows a reflationary sentiment indicator derived by combining bullish sentiment data (from Consensus Inc) for various markets that have correlated with global economic momentum historically. An extreme low in the indicator in late March 2020 marked the bottom in equity markets – could the current extreme high mark a short-term top?

It is common knowledge that the fashion industry has a significant negative impact on the environment, yet the extent may still be underestimated. Did you know that after the oil industry, fashion is one of the largest polluters in the world? The fashion industry accounts for 10% of global carbon emissions. Some of the processes in the production of clothes are highly energy intensive and some of the facilities are still powered by coal. Synthetic fibers are more energy intensive than natural fibers, given they are made from fossil fuels. In this age of fast fashion, we are generating more textile waste than ever. The average western family discards around 30 kg of clothing each year. Of this waste, almost all is landfilled, with synthetic fibers, such as polyester, taking decades to decompose, or it is incinerated. A small fraction is recycled or donated.

Additionally, another serious impact the fashion industry has on the environment is its consumption and pollution of water. An incredible amount of fresh water is used in the dyeing and finishing process of fabrics used for clothes; as much as 200 tons of fresh water is used to produce a ton of dyed fabric. Cotton itself is an extremely water intensive crop to grow and 20,000 liters of water are needed to produce just 1kg of cotton. In terms of pollution, it is not just the dyeing process that involves the heavy use of chemicals, bleaching and wet processing are also contributors. Unfortunately, the countries that produce the majority of the world’s apparel and fashion products have either loose regulations or weak enforcement of said regulations. Wastewater from the dyeing process contains harmful substances, that when released into bodies of water is hugely damaging to the people and wildlife reliant upon them.

The encouraging news is that there is a greater focus on sustainability in fashion. There are solutions to combat some of these problems, and Coats (COA:LN), a recent addition to our portfolio, is doing its part. Coats is the world’s leading industrial thread company and operates under two divisions – apparel and footwear, and performance materials. In apparel and footwear, Coats is a supplier of premium thread (as well as zips and trims) and services (software solutions) to the global apparel and footwear industry. In performance materials, Coats designs and supplies high tech and high performance threads and yarn used in a range of industries (automotive, household and recreation, medical, health and food, safety, telecoms, oil and gas, conductive and composites).

While thread is only 1% to 2% of the cost of a typical garment, it is a critical component in the overall performance of the garment and efficiency of the production process. In apparel and fashion, Coats has a 21% market share by dollar value, more than double the nearest competitor. This is a strong and defendable core business representing about 77% of group sales. The company has been consistently increasing market share in stable markets, experiencing steady yearly gains, due to a combination of reasons, such as trade tariffs, Environmental, Social, and Governance (ESG), and COVID. This means that customers are constantly reviewing their supply chain. Coats has the largest global footprint of any thread maker, and can accommodate changes a customer may wish to make.

With a Coats thread, customers can have confidence that the thread will be identical wherever it is sourced. The quality of the thread is vital. It has to be durable and long lasting as manufacturing processes for apparel and footwear are increasingly automated, and any breakages in threads results in costly downtime. Coats also has an advantage in terms of digitalization. Thread manufacturing is still a relatively antiquated industry. Coats was the first company to launch an e- commerce platform while most in the industry still take orders by telephone. The e-commerce platform also makes sample and delivery time quicker, which is very important for fast fashion.

As for ESG, there is an increased focus on sustainability within the apparel and footwear industry. Coats is a western company with western sustainability standards. Coats is considered the market leader in ESG with initiatives, as they make sustainable threads from plastic bottles. Sourcing threads from Coats provides companies with the assurance their manufacturing base is working with a responsible and environmentally compliant supplier. Further, the company has committed to a number of environmental targets, such as a 40% reduction in water usage by 2022, a 7% energy reduction while transitioning to a 100% renewable energy supply, and polyester being 100% recycled by 2024.

Moving forward, the increasing environmental restrictions and sustainability requirements are squeezing the long fragmented tail of thread suppliers. This should enable Coats to leverage its size and scale to gain further apparel and footwear market share. Consumers are willing to pay a premium for products containing environmentally friendly or sustainable materials, so the industry is making more of them. The shift from ‘fast fashion’ to ‘sustainable fashion’ is happening and Coats is at the forefront of meeting changing industry needs, such as speed, productivity, innovation, quality, responsibility and sustainability.

TORONTO, ON, January 29, 2021 – Crestpoint Real Estate Investments Ltd. (“Crestpoint”) today announced the acquisition of two significant investments with a total value of $205 million: i) Legacy Apartment Portfolio, and ii) FedEx Distribution Centre. Following these major acquisitions, Crestpoint’s total assets under management have grown to $5.5 billion. 

VANCOUVER, BC

Legacy Apartment Portfolio – various addresses

Legacy Apartment Portfolio is comprised of 15 multi-family residential properties, acquired from six different vendors, strategically located across Metro Vancouver. The portfolio includes nine concrete mid-rise apartments and six wood frame apartments. The properties range in size from 14 to 72 units with a mix of bachelor, one bedroom and two bedroom units, with a total of 614 residential suites across the portfolio. Located in the highly desirable and amenity-rich neighbourhoods of Vancouver’s West End, Kitsilano/West Point Grey, South Granville and Marpole, the portfolio has an average walk score of 90. Crestpoint, on behalf of the “Crestpoint Core Plus Real Estate Strategy”, its open-end Fund, partnered with InterRent REIT with each acquiring a 50% interest.

“We are thrilled to be acquiring such an irreplaceable core multi-family portfolio in one of the most sought-after residential markets in the world. As our first residential investment for our Fund, we are excited to use this as a launching pad into the multi-family sector and look forward to partnering with InterRent REIT, one of the most highly regarded operators in the sector” said Elliott Altberg, Executive Vice President at Crestpoint. “The multi-family residential sector in Canada is highly fragmented and has historically been characterized by stable, attractive risk adjusted returns. As such, we look forward to further expanding our multi-family presence across Canada and are eager to continue diversifying our Fund into this highly desirable asset class.”

WINNIPEG, MB

FedEx Distribution Centre – 365 Black Diamond Blvd.

Strategically situated on 38.1 acres of land in Southeast Winnipeg, the FedEx Distribution Centre is a 248,000 square foot brand new design-build package distribution and sorting facility. It is located in Boniface Industrial Park, Winnipeg’s second largest industrial park and offers convenient access to numerous key transportation routes. The state-of-the-art Class-A facility features a clear height of 28 feet with 76 dock loading doors and six drive-in doors. The single-tenant industrial property is fully leased to FedEx for 15 years. Crestpoint acquired the asset within the “Crestpoint Core Plus Real Estate Strategy”, Crestpoint’s open-end Fund. 

“This asset represents Crestpoint’s second industrial acquisition in Winnipeg in the last 14 months, providing the Fund with geographic diversification and exposure to a high-quality core industrial asset. Given its central location within the Winnipeg market and the long term commitment from such a reputable tenant we are really excited to add this asset to our Fund.” said Kevin Leon, President & CEO of Crestpoint.

About Crestpoint Real Estate Investments Ltd.

Crestpoint Real Estate Investments Ltd. is a commercial real estate investment manager, with $5.5 billion of gross assets under management, dedicated to providing investors with direct access to a diversified portfolio of commercial real estate assets. Crestpoint is part of the Connor, Clark & Lunn Financial Group, a multi-boutique asset management company that provides investment management products and services to institutional and high net-worth clients. With offices across Canada and in Chicago, New York and London, Connor, Clark & Lunn Financial Group and its affiliates are collectively responsible for the management of over $86 billion in assets. For more information, please visit: www.crestpoint.ca

Contact

Kevin Leon
President
Crestpoint Real Estate Investments Ltd.
(416) 304-6632
[email protected]

It has been a year since COVID-19 emerged, and the world is still struggling to contain the virus. In the past year, the nations and regions that had better control over the virus have seen faster economic recovery. China, for example, announced that their 2020 Q4 GDP grew by 6.5% year-on-year, which has surpassed the GDP growth of 6% in Q4 2019. This brings China’s 2020 GDP growth to a total of 2.3%. By comparison, the United States (US), Eurozone, and Japan are forecasted to contract by 3.6%, 7.4%, and 5.3%, respectively.

For China, industrial production was the growth engine, increasing by 2.8% in 2020, as global demand for medical equipment, home improvement products, and home office electronics was strong. Despite overall consumption lagging production, online retail sales posted a solid 15% growth. Online channels accounted for one quarter of total retail sales, up from just 4% in 2019. Companies we hold in our portfolios also benefited from the strong online retail growth in China. L’Occitane, for example, is a maker of natural and organic ingredient-based cosmetics and well-being products. Their online sales in China grew by 83.5% in the six months ending September 2020, and accounted for approximately 32% of their total China sales. It was ranked the number 1 brand for body care and hand care on T-mall, the largest ecommerce platform in China. Similarly, online sales of Asics, a manufacturer of sports shoes and sports apparels, more than doubled in the nine months ending September 2020, and accounted for over 30% of its sales in China. Also, profits of the beverage manufacturer Vitasoy increased by 27%, as online and home channels delivered strong results.

The fast growth of ecommerce also boosted logistics demand. According to the State Post Bureau, China’s total express delivery volume rose by 37% in December 2020, following the 37% and 43% growth in November and October 2020, respectively. Kerry Logistics, a third-party logistics service provider we own in our portfolios, has benefited from the surging domestic and cross-border shipping volume. The number of cross-border ecommerce consignments they handled in the first half of 2020 increased by 24% compared to last year. In addition, the strong overseas demand has driven the cost of shipping from China to Europe and the US to triple or quadruple in recent weeks. As one of the few Asia-based global freight forwarders, Kerry Logistics has leveraged its unique market position to capture the growing demand. Its international freight forwarding segment profits increased by 40% in the first half of 2020. Another positive update on Kerry Logistics is the completion of the spin-off of its subsidiary, Kerry Express Thailand, in late December. The listing was well received by investors, with its shares rising as much as 161% from the IPO price in debut. In addition to ecommerce, the potential distribution of COVID-19 vaccines could also help drive the company’s revenue and profit growth. Kerry Logistics has nearly one million square feet of cold chain facilities in Hong Kong, and is well equipped to handle drugs, including vaccines, antibiotics and insulin.

China has been leading the world on the digital payment front, with the highest mobile payment penetration rate of 32.7%, versus 15% in the US. The Chinese government has taken a step further to start testing the use of its own digital currency, Digital Currency Electronic Payment (DCEP), which is a digital version of its official currency, Yuan. Pilot projects have been ongoing in Shenzhen, Xiong’an, Chengdu, and Suzhou since August 2020. The official rollout could be as early as 2022. DCEP’s share of China’s digital payment market is expected to reach 9% in 2025, and 15% in 2030. To be launched domestically first, the digital Yuan will help smooth monetary policy transmission and help policymakers regain control over money flow and consumer spending data from Alipay and WeChat Pay. Eventually, it could be used to promote the Yuan’s global status and become China’s preference for cross-border payments, bypassing the Swift network amid rising tension with the US.  

On the political front, we don’t expect the US-China relationship to improve significantly under the Biden administration, although the two countries might collaborate on matters such as fighting climate change and COVID-19. Meanwhile, the delisting of Chinese stocks in the US seems to have had a positive impact on the Hong Kong stock exchange, as investors in mainland China are shifting attention to the cheaply valued Hong Kong listed stocks. This helps the Hang Seng Index to be among the best performers in the region so far this year. This trend is expected to continue, with investors shifting out of A-shares to H-shares. We continue to have high convictions that the companies we hold in this region will outperform, supported by their competitive product and offerings, and solid balance sheet. 

COMMENTARY

January 27, 2014

Dear clients and colleagues,

We recently had a chance to meet with over 40 companies based in Germany and France. Here are some thoughts on the two biggest European countries and our views for 2014.

France

The main topics of discussion in France remain on how they can stimulate their job market and economy while engaging in much needed reforms. The government is now accelerating measures to improve France’s competitiveness and tackle its fiscal deficit. President Hollande just announced that €30 Billion in employer contributions for family allowances will be eliminated by 2017. There is also a strong willingness to streamline business regulations and bureaucracies to support the manufacturing sector.

Regarding fiscal issues, France is committed to cut public spending by €50 Billion between 2015 and 2017, on top of an additional €15 Billion for this year. France has little room to maneuver and finally politicians have realized the importance of reforms. Let’s hope that these announcements will translate into real actions sometime soon.

Germany

Germany’s strong economic performance should remain intact for 2014. The German model, which relies on leading edge technology to produce highly desirable products, should continue to deliver good performance overall. Automotive, Cap goods and Technology companies should do especially well. Despite the currency headwinds that German exporters are facing, most companies expect to maintain or increase their operating margins. One reason being that companies remain very much focused on bringing down their cost base. Even 5 years after the financial crises, rigorous restructuring programs are still on the agenda. Finally, we feel like the introduction of a minimum wage by 2015 and an increase in workers benefits would stimulate domestic consumption.

European markets

We see growth accelerating in 2014 but at very slow pace. In this context of anemic growth, we anticipate small caps to outperform their larger counterparts. In our view, European stocks offer better margins expansion and thus, more re-ratings potential than most other regions. Europe in general remains under-owned in many portfolios and we anticipate a gradual capital inflow to the region.

Balance sheets at corporate levels are sound and most of the deleveraging has been done. Corporate leverage is approaching its bottom level of 1995-1997 when the net debt to capital was around 40%.

Healthy balance sheets and an improvement in business sentiment could trigger an acceleration of M&A activities. A potential pick-up in M&A, even a small one, would be very beneficial for smaller companies. Keep in mind that more than 96% of all deals come from companies with less than 5 Billon dollars in market cap.

The Global Alpha Team

This report is provided solely for informational purposes and nothing in this document constitutes an offer or a solicitation of an offer to purchase any security. This report has no regard to the specific investment objectives, financial situation or particular needs of any specific recipient and does not constitute a representation that any investment strategy is suitable or appropriate to a recipient’s individual circumstances. Global Alpha Capital Management Ltd. (Global Alpha) in no case directly or implicitly guarantees the future value of securities mentioned in this document. The opinions expressed herein are based on Global Alpha’s analysis as at the date of this report, and any opinions, projections or estimates may be changed without notice. Global Alpha, its affiliates, directors, officers and employees may buy, sell or hold a position in securities of a company(ies) mentioned herein. The particulars contained herein were obtained from sources, which Global believes to be reliable but Global Alpha makes no representation or warranty as to the completeness or accuracy of the information contained herein and accepts no responsibility or liability for loss or damage arising from the receipt or use of this document or its contents. Performance figures are stated in Canadian dollars and are net of trading costs and gross of operating expenses and management fees. Further information about the Global Small Cap Composite is available by contacting the firm. Global Alpha Capital Management Ltd. (Global Alpha) claims compliance with the Global Investment Performance Standards (GIPS ®) and has prepared and presented this report in compliance with the GIPS. Global Alpha has not been independently verified.

In the game Monopoly, the property names all come from real places in Atlantic City, New Jersey. You might remember that four of the properties are railroads, and that one is the “Short Line Railroad”. This name is an exception because there was no Short Line Railroad in Atlantic City. The name is a contraction of “Shore Fast Line”, a railroad that did run there in the first half of the twentieth century.

In the business world, short-line railroads are the small stretches of track that spur off the main national networks. Typically, they provide first- and last-mile rail transportation and storage for their customers. There are about 550 of these short lines in the US and 60 or so in Canada, and they are usually privately owned. In 2019, the Private Client Infrastructure Portfolio joined with a team of seasoned operators in this space and purchased its first short-line rail asset in Sarnia, Ontario. Early experience in operating this asset has been positive, with financial results exceeding base case expectations.

In August 2020, the portfolio bought its second and third short-line rail assets in Louisiana and Texas, expanding the Private Client Infrastructure Portfolio’s geographic scope and further diversifying its overall portfolio of infrastructure investments. 

Short-line rail assets occupy entrenched positions with their customers and produce strong and stable cash profits. Rail is also a business that requires active management and, in return, can experience growing profits over time as well as provide protection against inflation. 

Even with the challenges of running a business during the COVID-19 pandemic, the short-line rail assets have proven to be resilient investments, due in part to short-line rail’s persistent, defensible characteristics. These include providing essential services to well-established, large-scale customers; operating in resilient markets with high barriers to entry; and having strong customer relationships, often with contracted revenues.

Infrastructure, along with real estate and private loans, are alternative assets that, where appropriate, comprise a modest part of our clients’ well-diversified investment portfolios. They can help improve the balance between the returns achieved by the portfolios and the risk required to generate those returns—which can be even more rewarding than playing monopoly and winning second prize in a beauty contest.

This post is for information only and is not intended as investment advice. The views expressed are those of the author at the time of publication and are subject to change at any time.

Early reports about COVID-19’s impact on marriages in the United States (US) indicate that marriage rates were lower than expected in 2020. Recent trends show that the opposite has been true for corporations, with the second half of the year seeing an unprecedented surge in corporate merger and acquisition (M&A) activity. This surge comes after M&A volumes dried up by more than 50% following the initial lockdowns in the spring of 2020, causing executives to re-evaluate opportunities, given the uncertainty.

Although total deal value is still down 6% to $3.5 trillion for 2020, more than two-thirds of the activity happened between July and December[1]. The fourth quarter of 2020 alone saw a 39% year over year increase in announced M&A deals from 2019. Further, December was the fourth strongest month in history for M&A revenue. It is not just a high volume of small transactions; mega deal announcements have been all over the news. Such examples include the S&P Global acquisition of IHS Markit for $39 billion, the Salesforce acquisition of Slack for $27 billion, and AON’s acquisition of Willis Towers Watson for $30 billion.

So, how is 2021 looking, compared to the second half of 2020? It appears unlikely to be any different. As management teams begin reflecting on what a post-COVID future looks like, we expect that companies will reposition themselves to adjust to shifting consumer behaviour, created by COVID. A quarterly survey of global CEO confidence reached a high of 64 in Q3 2020, after bottoming to 36 at the beginning of the year (like with Purchasing Managers’ Index (PMI), ratings above 50 are positive and below are negative)[2]. That same report highlighted that of the CEOs surveyed, 36% plan to increase their capital spending over the next 12 months, compared to their previous expectations. Given the recent political changes in the US, it appears likely that the next CEO confidence survey will show even more optimism.

Furthermore, many industries, such as travel, entertainment and energy, are still near their multi-year low; this makes companies attractive targets at their current valuation. While the initial expectation was that many names in these industries would go bankrupt, all-time low interest rates and massive liquidity injections made it so that they only had to load their balance sheet with more debts to stay afloat. These factors make it likely that the record high of $1.5 trillion cash that private equity funds currently hold will be put to work during the year. As opportunities become clearer, we will see a record year for M&A and other investment banking activities.

As for the important question on everyone’s mind: how is Global Alpha getting exposure to this? We own Rothschild & Co (ROTH PA), among other names. Founded in 1838 by the famous Rothschild family, Rothschild & Co is one of the world’s largest independent financial advisory groups, with headquarters in Paris, France. The company provides M&A, strategy and financing advice, as well as investment and wealth management. With 50 offices and 3,500 employees, the company has a foothold in over 40 countries, and it is still more than 60% family-owned. As a boutique firm, Rothschild also benefits from a favorable reputation in comparison to larger banks, as well as the trend of using more advisors to conduct individual deals. In 2019, boutique firms accounted for 22% of advisory deal value versus only 9% in 2000; its share is expected to keep increasing over the next decade.

Historically, the firm’s activities centered on its global financial advisory and its wealth and asset management businesses. A little more than a decade ago, Rothschild added a new private equity business that now represents 8% of their revenue, but 17% of their profit share, representing a new growth driver for them. It is also the reason that Rothschild is able to maintain a better margin profile than its peers. Additionally, this allows the firm to deploy its own capital alongside their institutional clients and incorporate strong ESG principles in its investment decisions.

Within its global financial advisory business, Rothschild employs more than 1,100 advisors, and derives two-thirds of its revenue from pure M&A, with the balance from capital markets financing. Rothschild ranks sixth in revenue globally and first in Europe for its investment banking business. We are confident that the company will be able to benefit from the current environment.

SWOT:

Strengths

  • Leader in the European Union, consistently gaining market shares
  • Best in class talent and solid reputation

Weakness

  • M&A is highly cyclical
  • High family ownership is a risk for shareholders

Opportunities

  • US market share can double in size
  • Emerging markets expansion


Threats

  • Departure of key bankers
  • Weak M&A cycle

[1] 4Q20 Independent Financial Advisor & Regional Broker Earnings Preview, Piper Sandler, January 13, 2021